
NPS is a customer experience metric that shows how likely clients are to recommend a given service or product. But it can be even more valuable if you perform diligent analysis of qualitative feedback.
Many say that NPS doesn’t provide practical data. We’re here to prove them wrong. NPS is not a vanity metric, especially when you know what to do with the information you collect with the survey:
In this guide, we’ll go through step-by-step how to make NPS survey data actionable and how to analyze results. Then, we’ll explore how to use NPS analysis to help you grow your business and improve customer experience.

How does NPS work?
The Net Promoter Score (NPS) measures your customers’ overall loyalty to your company.
According to Fred Reichheld, a business strategist and the creator of Net Promoter Score, a single question along the lines of
“How likely are you to recommend our company to a friend or colleague?”
can uncover how well your company is doing.
Even though the NPS question is a simple closed-ended one that - by definition - doesn't reveal a lot of details, it’s powerful as it gives a numerical value to something that would otherwise be hard to capture - clients’ loyalty.
The question is usually followed by open-ended questions that give more precious context to NPS scores.
You can use the Survicate NPS survey template to get a ready-to-send complete set.
Customer categories
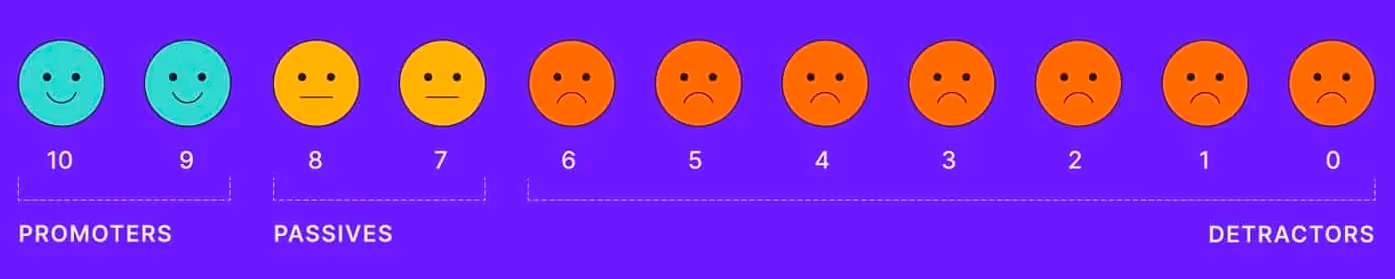
Customers can be divided into three categories based on the responses they provide.
Detractors
Customers who give scores from 0 to 6 are called detractors. They are not only churn risks. These customers are likely to spread bad word of mouth about your company.
Passives
Those who rate the likelihood of recommending your product or service 7-8 are passives. These customers are indifferent and on the verge of becoming either detractors or promoters.
Promoters
Promoters, or those who give scores of 9-10, are enthusiastic and loyal customers. They are likely to attract new customers, repeat purchases, and leave positive reviews of your business.
Each of these customer categories requires different treatment in a business growth strategy.
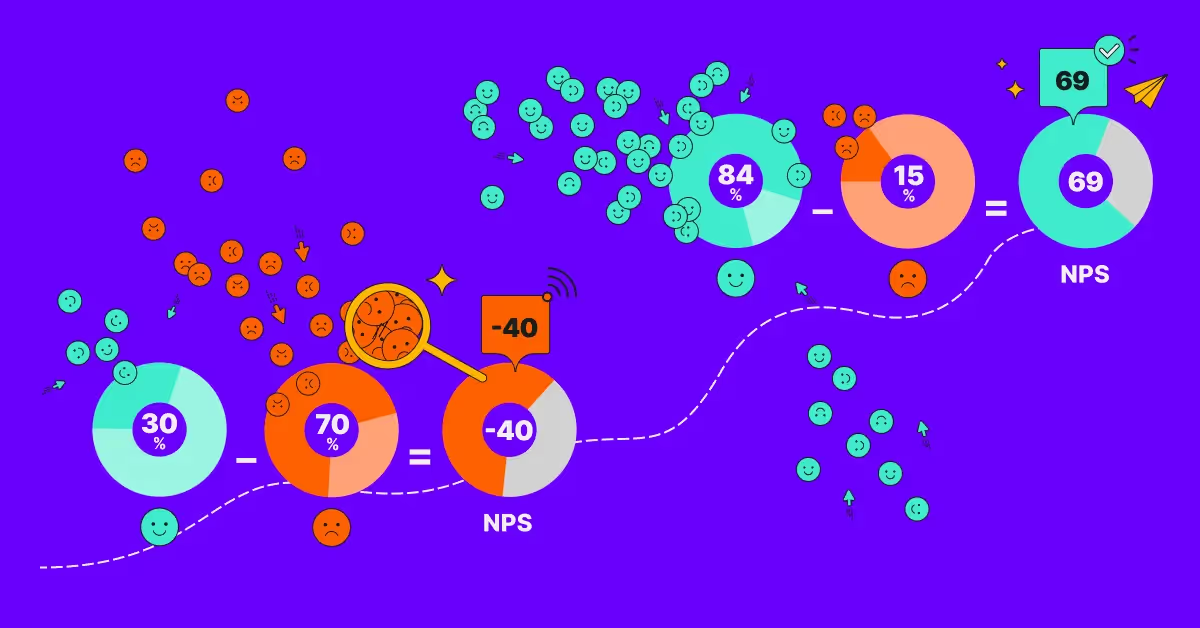
How to calculate NPS?
The formula for the NPS score is the percentage of promoters minus the percentage of detractors. Passives are excluded.

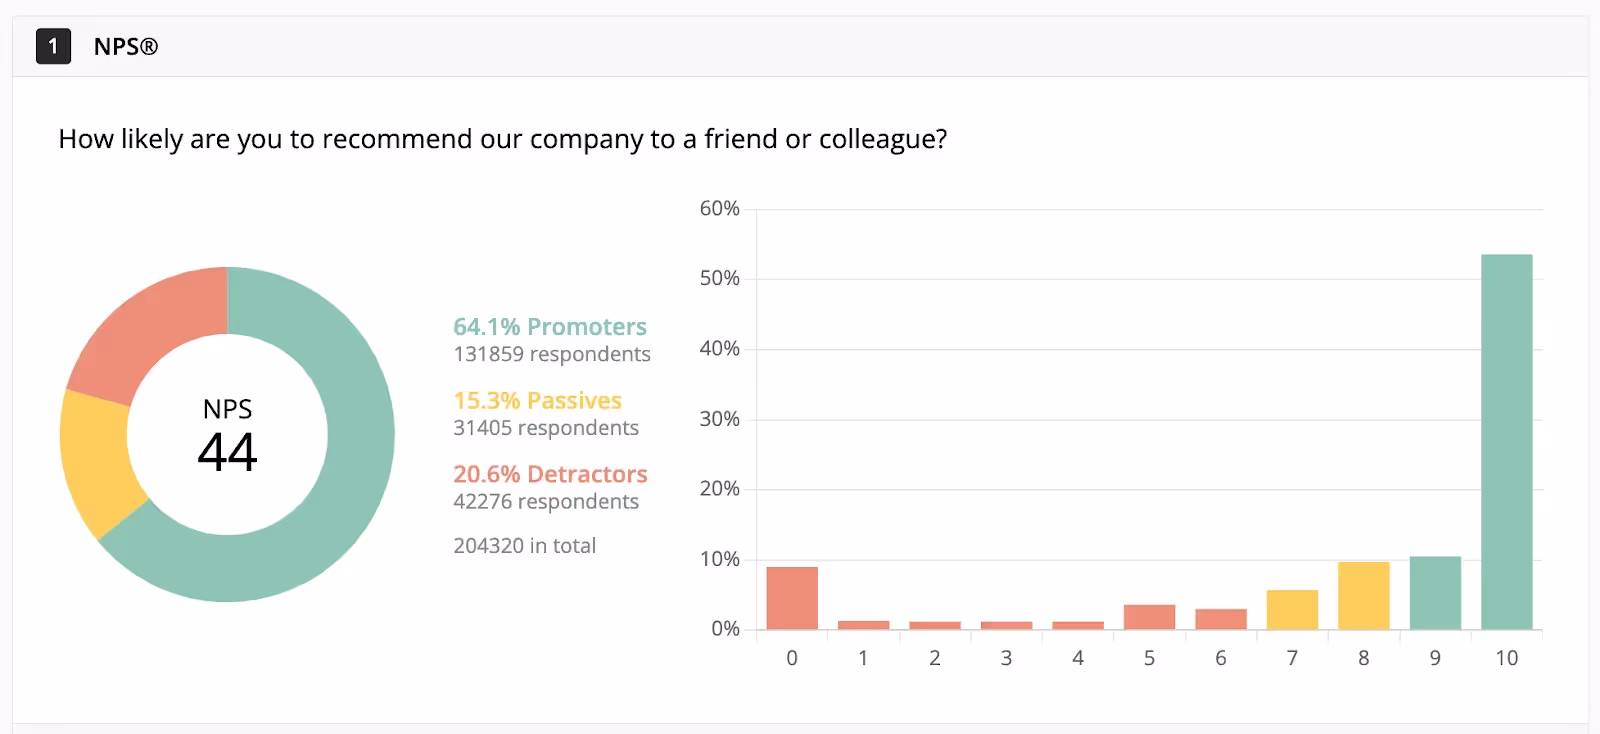
Survey software like Survicate calculates your NPS score in real-time, so you don’t have to do any of the work yourself. Simply use our NPS survey template to kick-start collecting feedback and use the reporting tab in our dashboard.
Here is the Net Promoter Score report as you would see it in our tool:
What do you need to perform NPS data analysis?
Make sure you have collected enough data. If you find that you are struggling to get the right sample size, supplement your NPS score with CES and CSAT text answers. We’ll explore more about how these surveys intertwine later on as well.
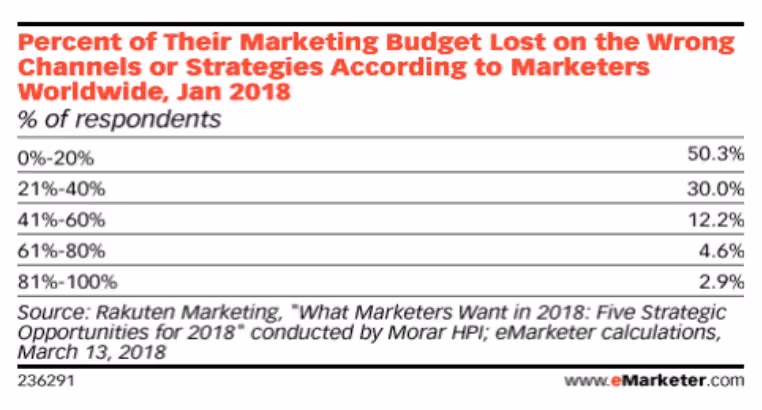
Secondly, survey the right people and reach them through the right channels. Rakuten Marketing found that businesses waste about 26% of their budgets on reaching customers through ineffective ways.
What channels to use depends on what type of business you run and your target audience. For some brands, it makes sense to contact clients via email. Other businesses should have pop-ups on their websites, as their customers visit them regularly.
Finally, you’ll need open-ended follow-up questions. While the NPS score itself is an important metric to track, your analysis will be most useful when you combine quantitative and qualitative data.
Step 1: Segment your NPS respondents
Categorize your NPS responses to make the analysis more actionable. It will also be simpler to interpret survey results and take appropriate action.
“The most actionable part of the NPS survey is the categorization of the open-ended verbatim comments from promoters & detractors.”
Andrew Chen, author and leading voice on mobile, metrics, and user growth
To be able to draw actionable conclusions from sentiment analysis, you can break down the scores according to geography, demographic, and other dimensions.
Geography
Culture affects NPS scores. For example, Americans tend to give a higher rating than just about any other country. (It’s like tipping - while it’s customary in the US, that isn’t the case everywhere.)
So, to have a more accurate picture, break down the results according to geographical location. And avoid comparing scores from respondents from different locations.
Demographic
By identifying characteristics like age, gender, and income, you can determine whether a specific demographic has more promoters or detractors. Perhaps you’d be better off targeting marketing campaigns at younger customers than older generations?
From Mice to Whales methodology
Have a look at the distribution of scores from different sizes of companies. Perhaps you cater to small businesses most, but you are getting better NPS scores from enterprises. This could suggest changing your strategy entirely would be beneficial.
Purchases or service levels
Customer impressions might differ depending on what types or levels of products or services they consume.
You can use NPS data to determine whether your product has bugs, a subscription plan isn’t profitable, or whether there are features you should market more aggressively.
Position
Noticing a pattern between a high number of promoters or detractors among users having particular roles within organizations can give you a lot of insight. You may be marketing to the wrong audience (or the right one).
The same goes for response rates. If you are seeing that customers don’t respond to your survey, this could be because they don’t have a use for your product.
Or, your service or product may have a steep learning curve or require some sophistication. You may want to repeat your persona research and either pivot or improve your customer onboarding process.
First-time users and tenured customers
It’s a good idea to compare the number of promoters and detractors among new and more tenured customers. Ideally, customers who have been with you longer should be more enthusiastic about recommending your product or service. Otherwise they are potential churn risks.
NPS data can help you figure out what touchpoints are potential struggles.
Step 2: Interpret NPS data
So, what is a good Net Promoter Score?
There are a couple of ways of looking at the NPS score.
The relative method entails comparing your NPS score to industry benchmarks.
The absolute method is about looking at NPS scores beyond industries. In an absolute sense, an NPS score between 0 and 30 is considered satisfactory.
Alternatively, you can track your performance by comparing your own NPS scores over time.
Remember about the margin of error. The bigger the sample, the smaller it is. You can read a very detailed run-down on how to calculate the margin of error here.
Seasonality
You may notice that the NPS score you receive is seasonal: There are times of the year when customers are more likely to give you a high or a low score. If you notice such a pattern, you may consider a year-to-year analysis of NPS scores. Instead of comparing the results to the previous quarter, compare them to the ones you got a year before.
Year-over-year comparisons may be more accurate than quarter-over-quarter analysis in such cases. If you run an NPS survey in June, make sure to run it in June the following year. That way you get corresponding data for that time period.
Look for actionable insights
When it comes to the Net Promoter Score analysis, ask yourself the following:
- Do detractors tend to sway towards 0, 6, or are they evenly distributed?
- Do you have a very divided audience (very few passives)?
And analyze the context of these scores as well:
- Are there one or two things in particular that make customers detractors or passives?
- Is there a large chunk of passives that could easily be turned into promoters?
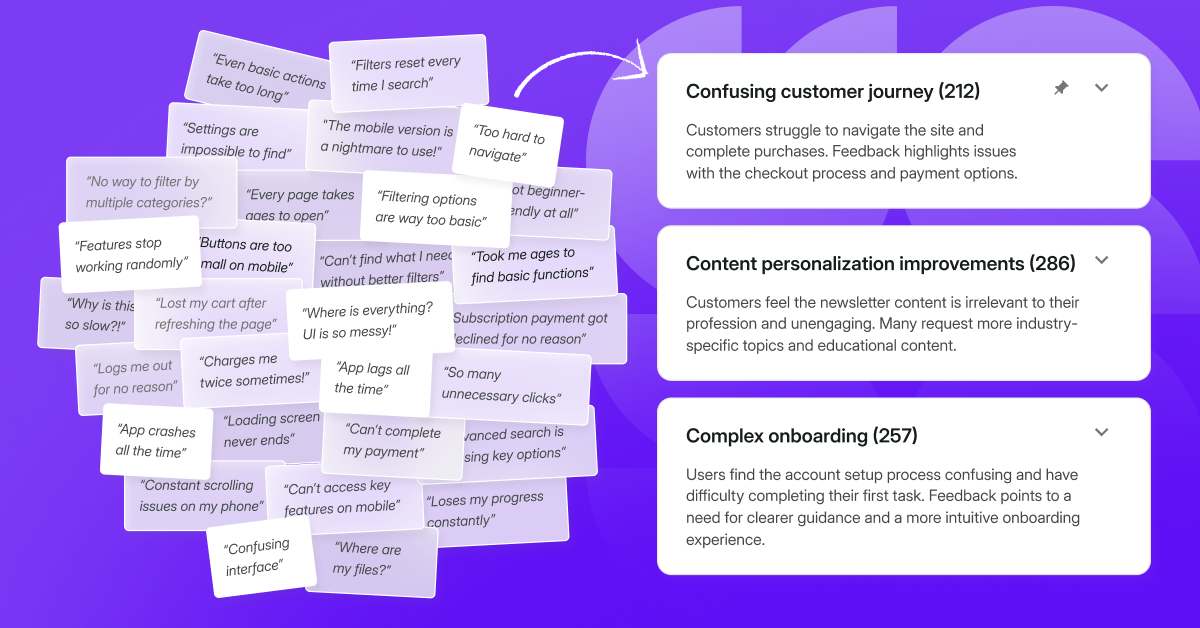
The only way to get context is by analyzing open-ended follow-up questions.
Use a tool to go through your open-ended question responses. Going through them manually is time consuming and costly.
Using Survicate, you can take advantage of the word cloud to see which topics are of most interest to respondents.
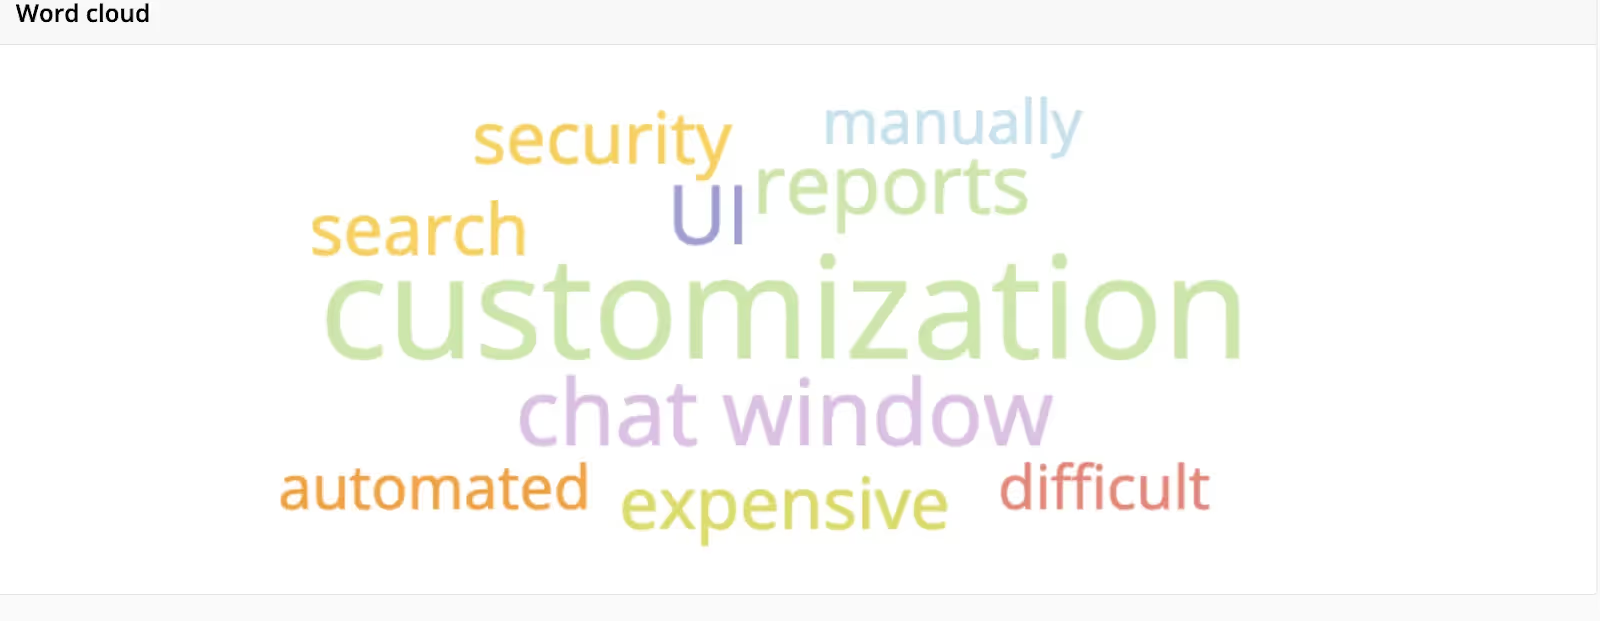
Then focus on responses that mention those issues.
Step 3: Chart NPS against other CX scores to get more insight
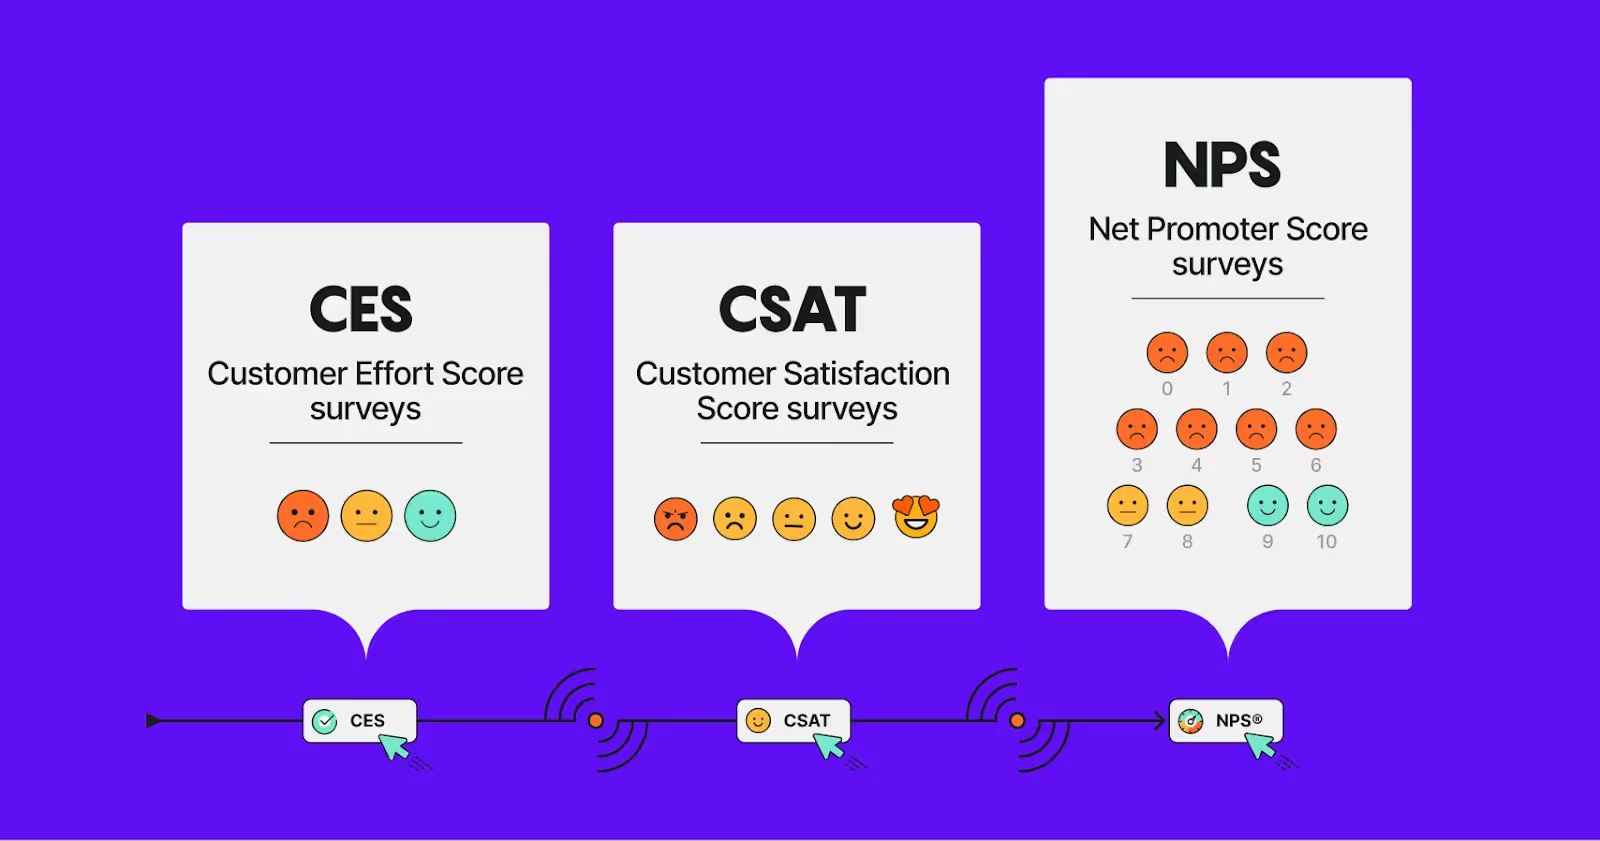
Comparing your NPS results with CSAT and CES scores helps you prioritize changes. If you just look at NPS, you will only see the general picture, rather than recognizing particular issues your customers face.
CSAT can easily be correlated to particular events, so if your relational NPS is high, but CSAT scores on individual touchpoints are low, you are probably dealing with some minor issues that are easily fixed.
Running CES surveys on particular touchpoints will shine more light on what needs to be improved. Only when you have an in-depth understanding of the problem, you understand its complexity, and you can prioritize your roadmap.
Step 4: Make sure the right data reaches the right teams
Rally the whole company to improve your NPS score. This means you have to share your analysis insights with the right people, collect additional feedback (if needed), and develop creative ideas to solve the problems.
For instance, if you run an NPS survey on your website and get a low score or if the answers to the open-ended questions in the survey signal problems with the website, contact your marketing team. You can gather such data with a website feedback survey.
Run a help desk survey. If customers are unhappy with customer service, consider training those on the front end.
Or, they may simply be unhappy with what you’re actually selling. Make sure you survey customers about your product or service.
And then contact the Product Team to make necessary changes.
Step 5: Leverage customer feedback
The best strategy is to make use of all feedback, whether positive or negative.
How you prioritize it should depend on the proportion of scores. If your overall NPS score is low - meaning you have a lot of detractors and passives - focus on them first, while not neglecting promoters.
Detractors
The first thing to do about detractors is to make them feel heard and valued. Of course, you should remedy the situation and fix the issue if possible, but first make sure you get back to them. Reaching out goes a long way. Contacting them about their feedback may prevent them from spreading bad word of mouth about your brand.
Or, maybe, the problem is something more general. Imagine a large portion of your detractors complain about the same missing feature that is easy to implement. Adding the feature can be a quick fix that can potentially turn detractors into promoters.
It may not be always possible to convert a detractor into an ardent brand evangelist. Still, if you act on their feedback and get in touch with them the right way, you will be able to prevent them from leaving negative reviews and spreading bad word of mouth about your brand.
Passives on the verge
There is a massive difference between a passive that is a 2 and a passive that is a 6. The answers to open-ended questions may give you actionable ideas about how to turn these passive customers into promoters. Analyze their responses for quick wins.
By fixing the issues they report, you may be able to prevent future customers from turning passive or negative.
Promoters
If you have a promoter, you have an independent brand advocate. You may want to:
- Ask them to leave a review on a relevant review site.
- Confirm that their comments can be made public.
- Request a testimonial to post on your website.
- Invite them to participate in product testing or different focus group studies.
Unless, of course, you notice they recently had a bad experience with your company. In such a case, prioritize fixing the issue and reaching out to the customer.
Run NPS surveys with Survicate
While the NPS score is important, the bulk of the analysis should focus on open-ended question responses. Divide customers into segments and analyze their answers to the open-ended questions to contextualize their scores.
You can also pair the NPS survey with CSAT campaigns and CES surveys to help you pinpoint where the struggles are. Do so especially if your NPS is low.
Remember to close the feedback loop by addressing the issues and setting up processes that will prevent them from arising again.
With Survicate's 10-day free trial, you can choose from among over 400 templates, including NPS, as well as test out all Business plan features. Sign up for free today, no credit card required.


.svg)

.svg)

