Customer experience (CX) can be a make-or-break for your business.
You need a CX program to set yourself apart from the competition and encourage customers to come back for more. And, of course, reap the benefits of word-of-mouth marketing and customer feedback.
But I’m sure you knew that already. After all, when was the last time you came back for a service that was inconvenient, tiresome, or just bad for you? Excluding your local post office, of course.
According to Gartner, 81% of marketers see customer experience as the best way to stay ahead of the competition.
At the same time, over 70% of CX leaders have problems designing customer experience programs that bring measurable results.
If you don’t want to be one of them, you need to know how your audience interacts with your brand—based on hard data, not your guesswork—and keep improving.
Measuring the right customer experience metrics will help you achieve that goal.
This guide will take you through the most relevant customer experience metrics. You’ll learn:
- How (and where) you should measure customer experience metrics;
- How to choose the most appropriate ones;
- And how to use your findings to improve your customer experience program.
Let’s dive in!

What Are Customer Experience Metrics?
Customer experience metrics are a set of indicators that showcase your company’s customer experience program quality and customer satisfaction. Every client interaction with your company influences the customer experience, so you should keep an eye on every customer journey touchpoint.
That’s the only way to see the full picture and keep getting better.
Some CX metrics, such as churn rate, customer lifetime value, upsell rate, are based on operational data.
But numbers rarely tell the whole story. If you know the customer churn rate, wouldn’t you also like to see why the customers abandon your business? And what could you do to make them stay? The right survey questions will help you add context to raw data.
Customer experience measurement aims to discover how to improve your services and increase your clients’ happiness—all to boost your revenue in the end.
The 10 Key Metrics for Measuring Customer Experience
Here’s a list of ten important customer experience metrics that will help you understand and boost your customer experience program quality.
You don’t have to track them all—choose those that make the most sense to you.
Just remember: while NPS, CES, and CSAT are the core customer experience metrics, don’t forget about the operational business metrics. Combining the two types in your analysis is the only way to tell if your customers’ satisfaction and brand loyalty impacts the bottom line.
Now, let’s go over each CX metric and see how they can help you improve your customer experiences.
Net Promoter Score (NPS)
Net Promoter Score (NPS) is a simple yet effective customer experience metric that reflects your clients’ opinions on your brand. It will help you discover their loyalty and attachment level.
Measure NPS by asking one simple survey question:
“How likely is it that you will recommend our product to a friend or colleague?”
Free-to-Use NPS Survey Template
The respondents can pick a number on a 10-point survey scale, where 0 means “not likely” and ten means “very likely.”
Of course, feel free to ask the respondents for additional comments explaining their choices.
How to Measure Net Promoter Score (NPS)?
First, you have to set up a survey that asks the Net Promoter Score (NPS) question.
Launch the survey in a channel that your customers frequently use—send an email survey in a newsletter, set up a website survey, or just pop the question after the customer uses your chat.
To calculate NPS, you have to split the respondents into three groups:
- Detractors (those who picked the scores 0-6);
- Passives (scores 7-8);
- Promoters (scores 9-10).
Next, subtract the percentage of detractors from the percentage of promoters.

Use NPS as a relationship survey, which tracks your clients’ overall relationship with your brand. Re-run NPS survey regularly to track changes in customer loyalty.
Or run a transactional NPS survey to monitor particular interactions. Implement it at the most engaging touch points in the customer journey, like after the client contacts customer support or upgrades their current plan.
How to Use Net Promoter Score for Better Customer Experience
NPS is a popular customer experience metric because it tracks your customers’ overall attitude towards your brand.
Based on the score and the feedback you get:
- Ask detractors (and passives) how you can improve and act on their feedback;
- Try to engage promoters even more by offering them special deals, exclusive group memberships, or limited offers;
- Encourage promoters to further recommend your company by attracting potential customers and leaving reviews;
And anything else you come up with!
Resolving issues pointed out by detractors, and delighting your loyal customers will do wonders for your customer experience.
If you use customer segmentation, observe what the NPS looks like for each segment. Then, try to improve the experience for the groups that score the lowest!
And make sure to check out how your Net Promoter Score stacks up against your competitors. Our 2021 NPS benchmarks report will help you discover if your Net Promoter Score is good, of you need extra work!
Customer Satisfaction Score (CSAT)
Customer Satisfaction Score (CSAT) reflects the customer satisfaction level with your particular product, feature, or service.
To monitor CSAT, you need to set up a survey that asks the clients to rate their experiences with your company’s service, usually on a 1-to-5 scale.
Free-to-Use CSAT Survey Template
Unlike the more general NPS, CSAT is a typical transactional survey. It concerns specific customer journey touchpoints—for example, using a new feature in your app, receiving the ordered product, or finishing a call with your customer service.
How to Measure Customer Satisfaction Score?
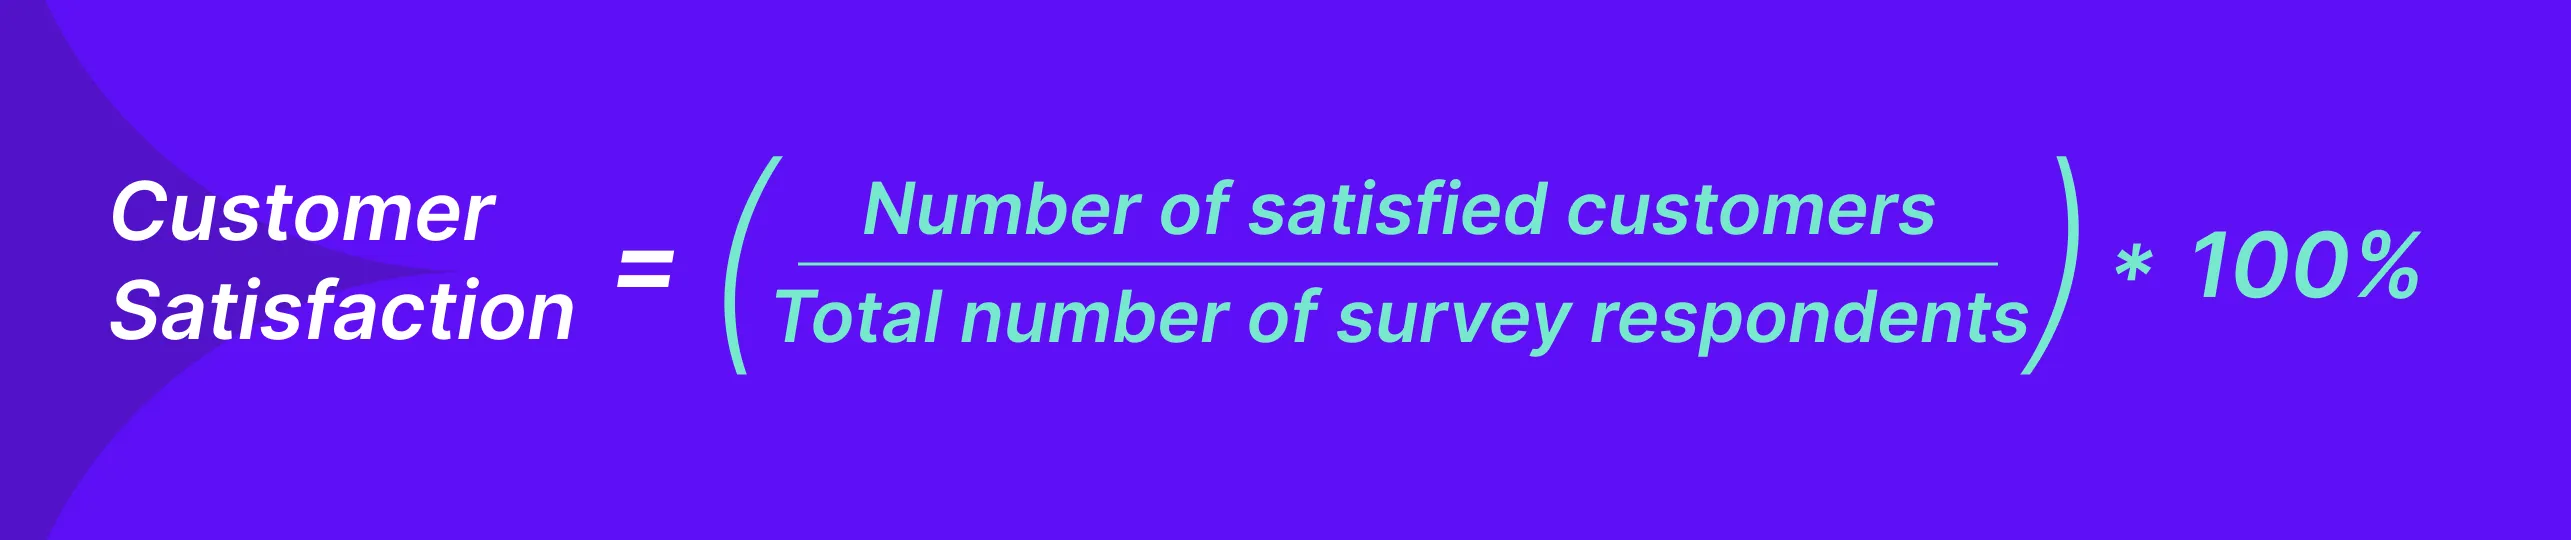
After you collect your data, there are two things you can do:
- Draw the average to discover the general customer satisfaction level;
- Divide the number of happy respondents (those who chose four or five on the scale) by the total number of respondents.
Show CSAT surveys as a pop-up on your website after your client takes a specific action, send an automatic post-transaction email, or implement a chat survey. Transactional surveys work best when respondents are the most engaged.
Remember to re-launch the survey regularly to monitor your performance and progress over time.
How to Use Customer Satisfaction Score for Better Customer Experience
The higher your CSAT, the better.
Ideally, it should keep improving. To achieve that, start asking follow-up questions in your CSAT surveys. Ask the unhappy customers what they disliked, and ask the happy customers what they enjoyed the most. Skip logic will help you create the right paths for your respondents.
And since CSAT is touchpoint-based, you can quickly act on the feedback you receive. Even if your clients don’t leave concrete recommendations, you will still find the strongest and weakest points in the customer journey.
Customer Effort Score (CES)
The Customer Effort Score (CES) reflects how easy it is for your clients to interact with your product and how well your website matches the visitor intent. It can be about navigating your product, contacting your support team, placing an order, or whatever else fits into your customer journey.
To measure Customer Effort Score, you need to launch a survey with a statement that the respondents have to either agree or disagree with:
“The company made it easy for me to handle my issue.”
Usually, the respondents have to pick one option on a 5-point scale, ranging from “strongly disagree” to “strongly agree.”
Free-to-Use CES Survey Template
How to Measure Customer Effort Score?
To calculate the Customer Effort Score, you need to draw the average. Just divide the total sum of customer effort scores by the number of survey responses.

You should send CES surveys right after the customer finishes their interaction with your company—like in the Intercom Messenger, on your website after specific triggers, or in your app. You can automate the process with event-based triggers or web survey targeting. Also, include additional survey questions to collect more insights.
How to Use Customer Effort Score for Better Customer Experience
In the Amazon era, effortless interaction with companies is the norm. According to Harvard Business Review, reducing customer effort is the only way to strengthen brand loyalty. What’s more, making things easy for your customers and meeting their expectations is much more critical than delighting them.
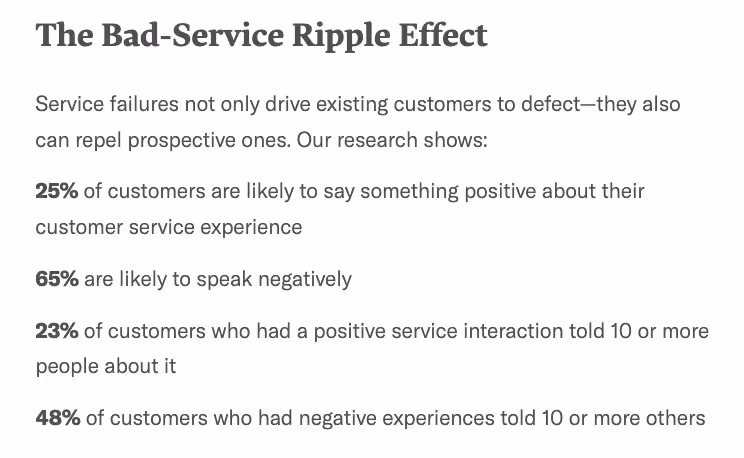
Look at the graphic above. The message is clear: your customers are much more likely to slam your service than to sing praises. This means that even one friction can harm your customer satisfaction levels.
Watch your Customer Effort Score closely, act on negative feedback, and improve all the poorly-scoring services. And since CES is touchpoint-based, you’ll quickly discover the main friction points.
Customer Lifetime Value (CLV)
The Customer Lifetime Value (CLV) metric reflects the general revenue you can get from your customers during their present and future interactions with your company.
To put it simply, the higher the CLV, the better your ROI (Return on Investment) from each customer.
This customer experience metric is popular among marketers who want the CLV to be higher than CAC (Customer Acquisition Cost). The reason is simple: if you spend more on your clients than your clients spend on you, you’ll never grow.
How to Measure Customer Lifetime Value?
CLV is a metric based on your operational data.
The easiest way to calculate CLV is to multiply the average sales value by the number of transactions and the average retention period.
Then, take that number and multiply it by the profit margin.

There are more ways to calculate CLV out there, so research the options that best suit your business. Here’s an example from the Kissmetrics blog based on Starbucks data:
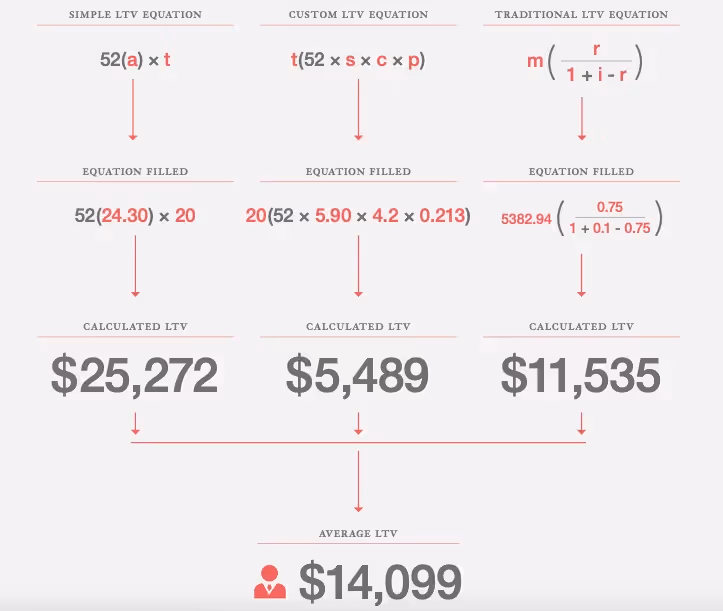
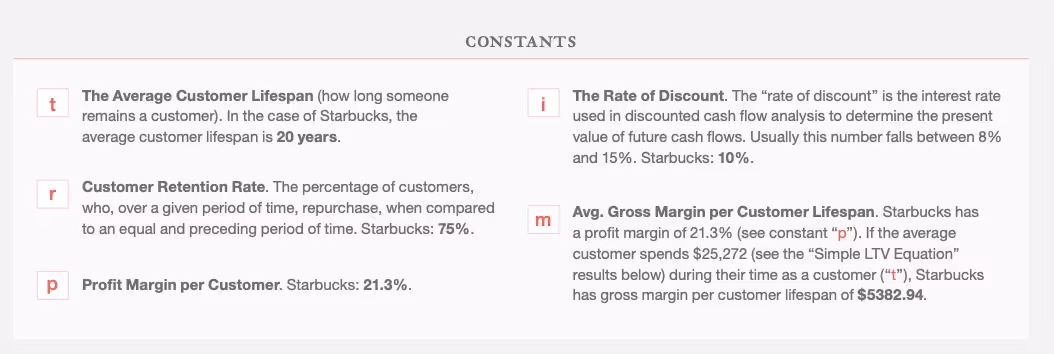
Even if you don’t feel like getting deep into the math right now, take a look. The numbers are extraordinary—like the crazy Average Customer Lifespan of 20 years and 75% Customer Retention Rate. Being a customer-centric company pays off!
How to Use Customer Lifetime Value for Better Customer Experience
The Customer Lifetime Value metric will help you discover how satisfied your clients are with your services. If your customers want to stay with you and spend a lot of cash in one place, it means you’re doing something right.
The tactics to increase the CLV—like acting on your customers’ feedback, rolling out loyalty programs, or smart upselling—may also improve customer experiences. Your customers will feel heard and cared about, and who doesn’t like to get good deals?
There’s an extra perk to having high CLV: you can use it as your company’s USP (Unique Selling Point). It will come in handy as an incentive for high-end affiliate partnerships.
Just remember always to stay human. Never sacrifice your services’ quality and communication for a short-term revenue boost. Pushing new products down your clients’ throats whenever they visit your website won’t bring the desired effects.
Customer Retention Rate (CRR)
Customer Retention Rate (CRR) shows how many customers keep doing business with your company over a given period.
It helps to judge how good your business is at keeping its existent clients and when they are most likely to leave.
And since it’s from five to 25 times more expensive to acquire a new customer than to retain an old one, it’s good to keep your retention rate high!
How to Measure Customer Retention Rate?
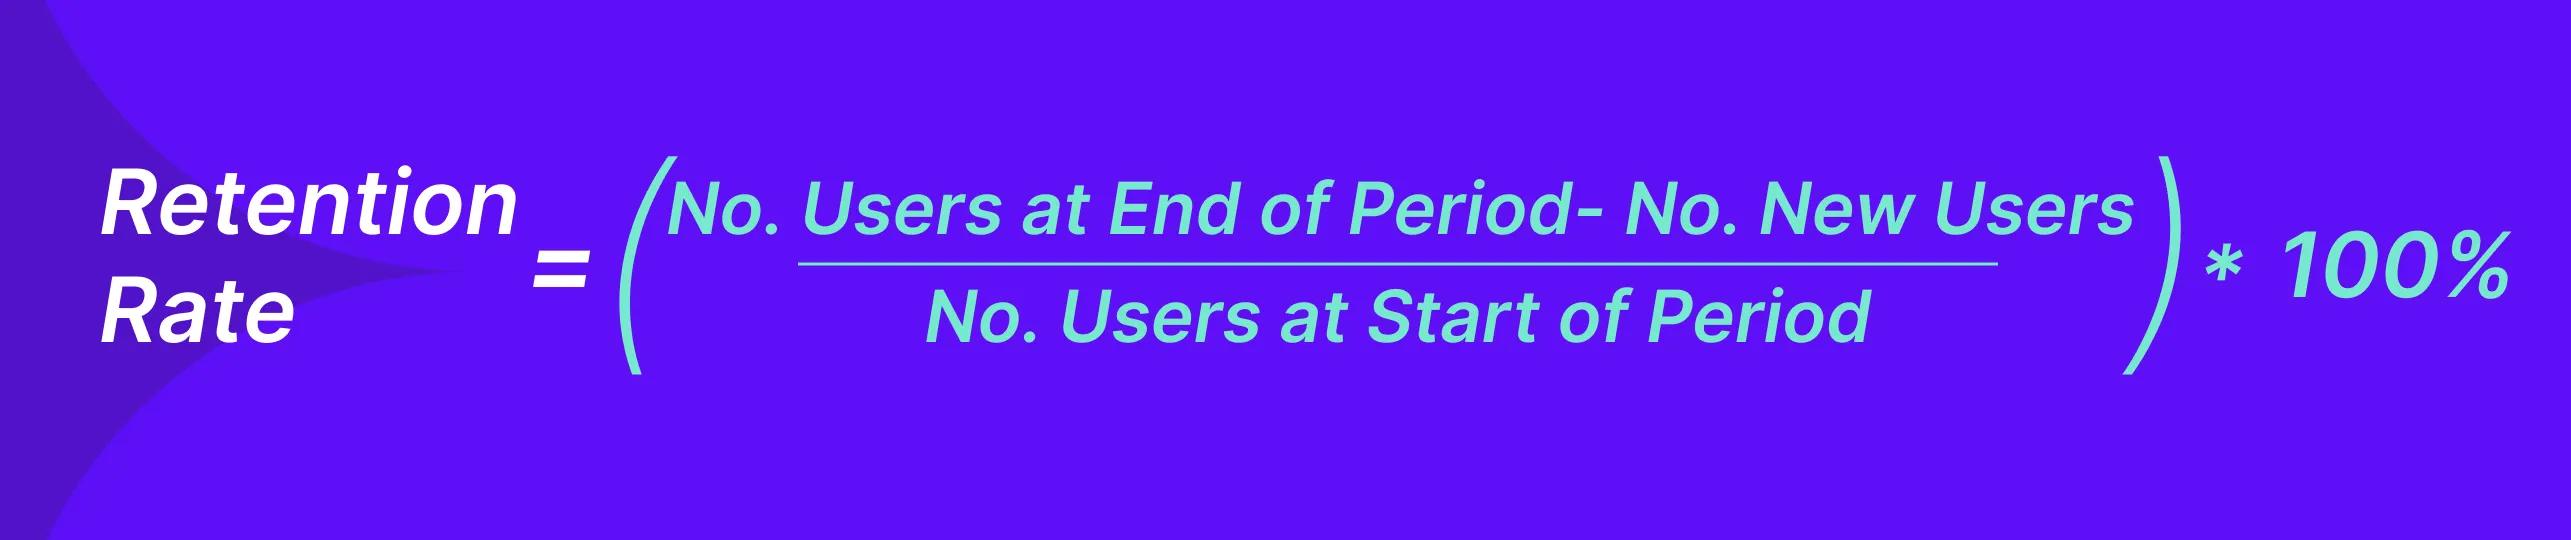
To measure CRR, subtract the number of new customers from the number of customers you have by the end of a given period. Then divide everything by the number of clients you had at the beginning of the period.
How to Use Customer Retention Rate for Better Customer Experience
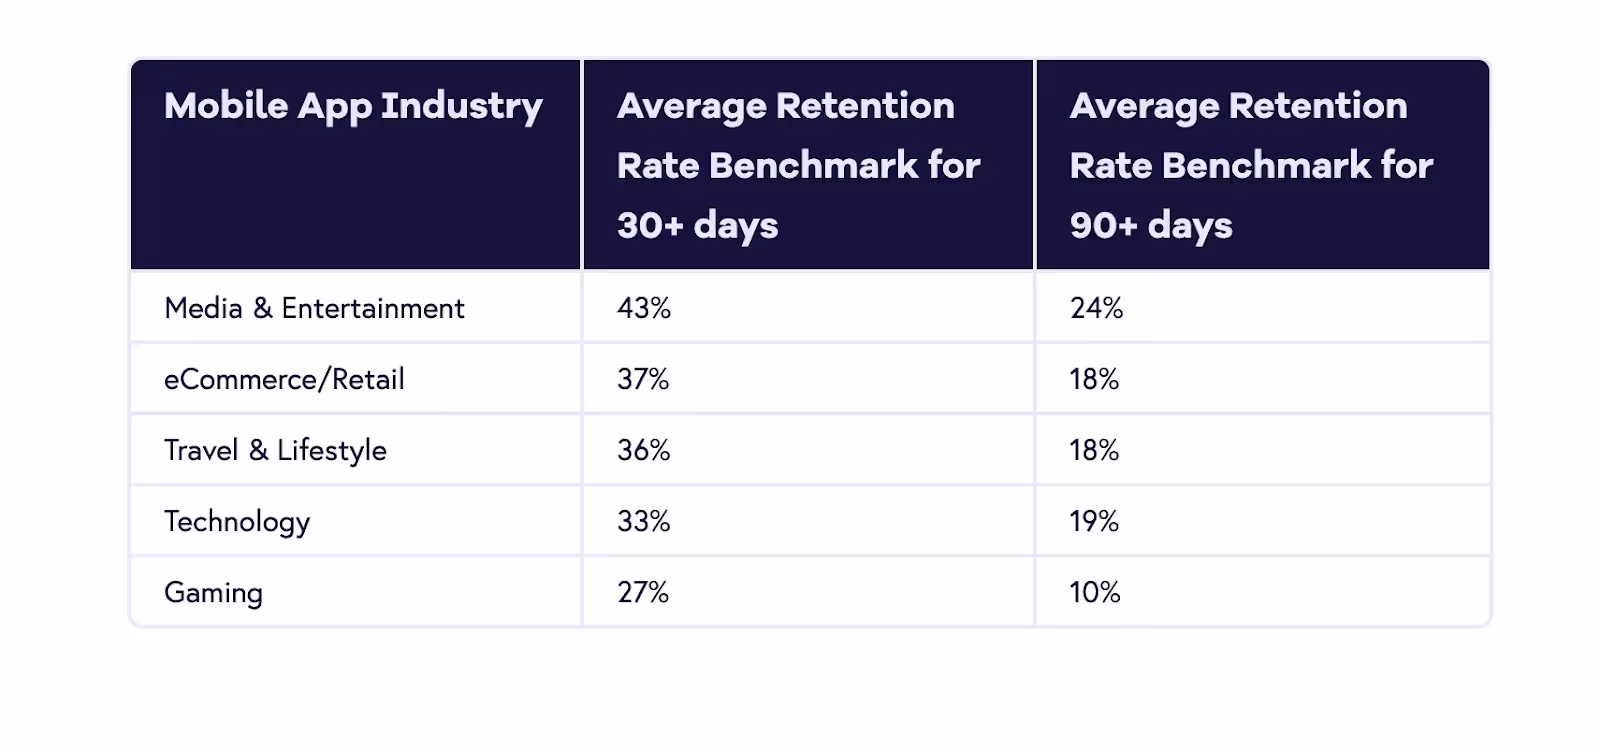
The more customers stay with your company, the better the customer experience must be. This is why you should always try to keep your retention rate high. Of course, a “high retention rate” will mean something else for every industry.
It’s best to segment your customers and see what the CRR looks like for each group. If you’re not yet sure which segmentation criteria to choose, check out our article on customer segmentation examples (from real companies).
Then, increase satisfaction for the lowest-performing segments based on their feedback—improve customer support, add app features, etc.
Customer Churn Rate
Customer Churn Rate is the opposite of retention rate. It reflects how many customers leave your business in a given time.
It helps to assess how successful your company is at retaining customers and monitor brand loyalty.
How to Measure Customer Churn Rate
To calculate CCR, you have to divide the number of lost customers in a given period by the added numbers of:
- the existing customers you had at the beginning of the period,
- and those that joined you in that period.

How to Use Customer Churn Rate for Better Customer Experience
High churn is a sign that you should improve customer experience.
Track CCR to see which customer segments are most likely to churn, when, and why. You can find it out by setting up a survey whenever customers cancel their subscription or return a product. Make sure to ask why they decided to leave you.
Free to Use Churn Reason Survey Template
Then, take action to prevent this from happening. Offer a discount code, create a nurturing email campaign, or use the feedback you get to change in the future.
Average Resolution Time (ART)
Average Resolution Time evaluates the quality and efficiency of your customer support teams. It shows how much time it takes to handle customers’ tickets on average.
The Average Resolution Time depends on the problem type and communication channel, so there’s no universal benchmark to follow.
How to Measure Average Resolution Time
To calculate Average Resolution time, you need to divide the total amount of time spent resolving tickets in a given period by the number of requests in this period.

If you use any ticket-based customer success platform, you should have no problem obtaining this data.
How to Use Average Resolution Time for Better Customer Experience
This metric doesn’t directly indicate your customers’ happiness level, but it can still help you improve your customer experience management program.
To provide a seamless customer experience, you need quick, frictionless problem-solving. Therefore, you should always aim to reduce ART.
Fight high Average Resolution Time by improving your customer support or customer service capacity. And if you discover a growing number of tickets or requests, identify the primary problem source. Maybe fixing recurring bugs in the app will provide relief to the support folks and reduce the ART?
First Contact Resolution (FCR)
First Contact Resolution (FCR) is another indirect customer experience metric that concerns customer support effectiveness.
This customer service metric shows how efficient your team is in resolving customer requests after the first contact attempt with your business.
How to Measure First Contact Resolution
To calculate the FCR rate, you need to divide the number of requests resolved at the first attempt by the total number of requests.

First, you have to define what “the first attempt” means for your company. It will depend on your customer service team structure, capacity, and contact channels you provide. For example, will you count every request you get, including abandoned customer service calls and misdirected messages, or only those that got picked up? Try to think of such details and corner cases before you start monitoring!
How to Use First Contact Resolution for Customer Success
This is another customer experience metric that tracks how smooth your clients’ interactions with your company are. So, the higher your FCR, the higher your chances of a successful customer experience management program. If your rate is low, act immediately!
With the data you get from monitoring both ART and FCR, you’ll have a good picture of your customer support department’s efficiency.
Customer Referral Rate
Customer Referral Rate is numerical proof of your NPS score. It shows how many clients recommended your services to their friends and colleagues.
Referral rate works best if your company has a dedicated referral program that uses tracking links. Otherwise, you have to treat the data with a grain of salt.
No analytics tool can track all the customers that convert through online recommendations—the customer journeys are much too long and messy for that.
How to Measure Customer Referral Rate?
To calculate Customer Referral Rate, you have to divide the number of referred purchases by the general number of purchases in a given period.

How to Use Customer Referral Rate for Customer Success
The Customer Referral Rate will help you determine how satisfied your customers are with your company. The higher it is, the better—especially if it’s above the 2.3% global average.
People tend to recommend products and services that they believe in. So, if they’re willing to recommend your business —they must have had delightful experiences with your product! Even with an incentive-based referral program in place, most still won’t push things they dislike to their friends, colleagues, and networks.
Trial-to-Paid Conversion Rate
The trial-to-Paid Conversion Rate is popular within SaaS companies. It reflects how many people choose to upgrade your product from its free version to the paid version.
This metric helps to:
- predict your revenue,
- see which features are the most popular,
- and which audience segments are the most promising (in terms of current and future profit)
How to Measure Trial-to-Paid Conversion Rate?
To calculate the Trial-to-paid Conversion Rate, you have to divide the number of conversions in a given period by the number of trials ended in the same period (either because someone converted or the trial ended).

If your company offers a freemium plan, simply monitor how paying users compare to non-paying users. This will help you predict the rate at which your clients convert.
Trial-to-Paid Conversion Rate = Customers who converted ÷ customers on the free plan
How to Use Trial-to-Paid Conversion Rate for Customer Success
We pay for products we enjoy. So the more people choose to upgrade their plan, the happier they are. Of course, this is a simplification, especially if you offer a freemium plan.
Try to get as much information out of monitoring your conversion rates as possible. For example, track when your clients are more likely to convert or see which audience segment converts the best. Then, you can target and personalize your nurturing campaigns.
Measuring Customer Experience: Which CX Metrics Should You Focus on?
There’s no definitive answer to this question. It all depends on your brand’s nature and business goals.
On average, companies track 2.5 customer experience metrics. While you can measure more, remember: collecting data only matters if you act on your findings. Don’t collect numbers for the sake of numbers!
Keep the three things in mind when choosing the right customer experience metrics for you:
- What are the key areas you want to work on? Do you want to define your customer journey, improve the customer success department, or increase the number of loyal customers?
- What kind of feedback can you act on? Think about your capacity and finances first. For example, if you know there’s no extra budget for customer service, don’t track metrics like FCR or ART. Instead, focus on CLV and churn rate to tighten the marketing efforts.
- Focus on measuring the critical business areas. Is easiness of interaction your main selling point? Make sure you monitor your Customer Effort Score. Do clients stay with you for your impeccable customer support? Keep tabs on the First Contact Resolution metric.
A good start for a beginner is to figure out the basics: Customer Lifetime Value and Customer Churn Rate. You’ll be able to gauge how many satisfied customers you have.
Now, it’s time to hear from your clients. Let Survicate take it from here. You can sign up for free now and start collecting feedback after a couple of clicks.
Begin with NPS—since it’s the most general, it’s an excellent first step to get to know your audience. Don’t worry about questions and design. After you log onto your account, pick the right from our library of ready-to-go survey templates.
Just don’t forget about survey fatigue!
Survey fatigue happens when surveys are too long or appear too often. As a result, the respondents get tired and disinterested, which affects the response rate.
One concise survey will give you much better results than a couple of poorly-made ones.
How to Use CX Metrics to Improve Your Customer Experience?
Now that you've chosen your key customer experience metrics, it’s time to set things in motion.
If you’re unsure how to get around using CX metrics in your customer experience management program, here’s a quick action plan.
Check out our guide to customer experience strategy if you need more details and advice!
Step 1: Align the CX Metrics and KPIs With the Customer Journey
To make sure you measure customer experience right, pin down your customer journey.
First, think about your clients:
- Who are they?
- How do they navigate your site and product?
- What are their pain points?
Then, map all the possible customer interactions with your company, from finding your site to making a purchase. You will predict when your customers might need extra help and solve problems before they happen.
Identify the metrics and KPIs connected with each step in the journey and the customer experience metrics to track your success rate.
For example, new clients won’t turn into your brand ambassadors overnight. They’re unlikely to recommend a product they hardly know. So there’s no point in showing an NPS survey to new users who just converted for a trial.
However, you might discover that new customers tend to churn after the trial period. If that’s the case, offer them additional support during the trial (like an onboarding email flow), run a CES survey by the end, and measure the Trial-to-Paid Conversions to check if your actions had the desired effects.
Step 2: Ask Questions at the Right Time and Place
Survey fatigue is real. You can’t just flood your audience with questions.
Prioritize the customer experience metrics you want to track and choose the most crucial ones for your business. Then, make sure to meet your audience on their favorite channels—and at the right time.
For example, if your customer has just talked to the sales team via live chat, show them a CSAT survey in the same chatbox. They’re most likely to share their opinion while the issue is still fresh, and they won’t need to make an effort to click on the survey.
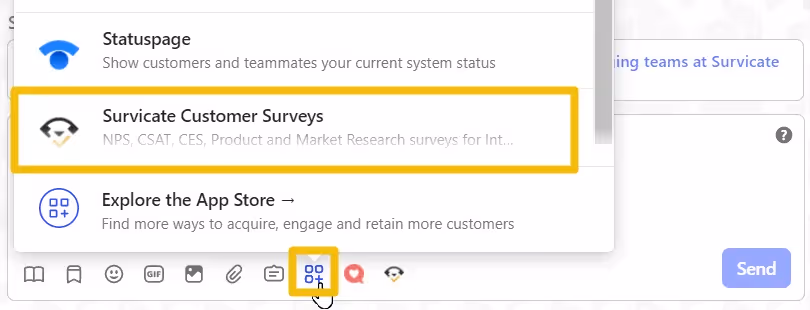
Survey tools such as Survicate will help you launch surveys automatically when your audience meets the right conditions (when they use live chat to solve their problem, visit a specific place on your website, etc.).
Step 3: Monitor and Act
Never lose sight of the metrics you’re tracking. Regularly review customer feedback and set up new action plans and goals based on your findings.
Use dedicated tools to see your survey results and customer journey analytics. This will help you draw conclusions and act quickly. If you use Survicate, integrate it with your CRM tools to get more actionable audience insights.

Collect customer feedback with Survicate
Customer experience metrics and customer experience measurement will help you develop, assess, and improve the customer experience program. Today's market is busy, so only customer experience leaders can set themselves apart from the competition.
Combine operational, business metrics with survey data to better understand the customer journey and your strongest and weakest points. You’ll quickly act on the feedback you receive and provide the experience your clients want—not one you think they want.
When choosing the right customer metrics to measure, focus on those aligned with your business goals and current KPIs.
The best survey tools such as Survicate will help you set up surveys and collect all customer feedback in one place. You can also integrate with your CRM of choice to get even more data points and see the bigger picture. You’ll be able to take quick action without the hassle of setting up endless spreadsheets. And the faster you react to customers’ feedback and seal the holes in your CX program, the better the customer experiences will be.
Ready to start now? Set up an NPS survey with Survicate and start boosting your customer experience! Also, you can foster your decision making checking our newest ranking of best customer satisfaction tools.


.webp)

.webp)

.svg)

.svg)