
Tl; dr
⭐️ Establish clear objectives for your product analysis to ensure that the metrics you track are meaningful and aligned with your business goals.
⭐️ Dive deep into quantitative and qualitative data to understand user behavior and product performance comprehensively.
⭐️ Online surveys are a powerful tool for gathering user feedback and providing insights for competitive analysis, helping you understand your market position.
⭐️ Regularly map and evaluate the user journey to identify and rectify pain points, bottlenecks, and areas for UX improvement.
⭐️ Use the actionable insights from product analysis to drive continuous improvement and innovation, ensuring your product remains user-centric and competitive.

Do product analytics metrics haunt you? Are there so many to choose from that you don't even know where to start? Well, product analysis can be an overwhelming task if you don't approach it strategically.
With this guide, for example.
We'll show you that you don't have to measure everything to conduct a sound product analysis. We'll take you by your hand to slowly but surely go through every step of the process. And finally, we'll show you how others do it using online surveys as an additional data source of customer feedback.
Buckle up, and let's go 🚀
So, what is digital product analysis?
Product analysis is a process of analyzing how customers engage with digital products. It involves tracking user behavior, understanding engagement patterns, and using this information to improve the product's functionality and user experience.
Gathering real-time data helps you move beyond surface-level metrics to uncover actionable insights. With this information, you can optimize customer journeys, increase customer lifetime value, and make data-driven decisions to grow your business.
What is the purpose of product analysis?
Would you like the short or long answer? Before we decide on that, let's see what John Cutler, former Product Evangelist at Amplitude, says about a lot of the Product teams out there:
Many teams have very little sense of their current impact. So the idea of improving decision quality doesn't resonate. It's a paradox of sorts. Without situational awareness, the idea of improving situational awareness feels distant and abstract.
You probably get the idea by now and the short answer as well. But just for the record—you need product analysis to know.
To know if your product sticks, identify trends, assess your current impact, and make it bigger. We could also say it's for data-driven decision-making, but it's 2024, and we're all fed up with buzzword-dropping.
Now for the long answer. You just cannot afford guesswork anymore. A comprehensive product analysis process is necessary to gather relevant data on how different user groups engage with your product.
You need to know precisely what the user journey looks like, how the product features perform, what the customer satisfaction level is, and where your product lands in competitive product analysis.
It's the only way to increase the quality of your decisions and:
💎 Create a user-centric product
Your users should always be at the core of what you create, so a thorough understanding of product analytics data is crucial to developing a product they'll fall in love with.
💎 Build well-targeted marketing campaigns
There's no money to burn on marketing anymore, so you better get to know your users well. And fast. Perform user segmentation to build user personas and effectively connect with your potential customers.
💎 Drive continuous improvement
A digital product is a never-ending story, a non-finite commitment, and so should be improving on it. The product analysis process should be, at its heart, continuous, meaning it should be a part of daily work for Product teams. Only then can it bring value and unlock the potential of your product.
Step 1. Establish goals and objectives
"How smart," you might think ironically. As blunt as this point is, it is also unavoidable if you aim to implement product analytics successfully.
You may track an endless number of "key" metrics, but will they make any sense if you don't define product analysis objectives in the first place? Well, they might, but chances are your team will start eating its own tail trying to figure out what's really important.
So, you must ask yourself a fundamental question: Why do you want to run a product analysis? 🧐
Is it to monitor the overall product health or user satisfaction? Maybe it's about troubleshooting your conversion or checking if your product onboarding goes smoothly.
Product analytics metrics will also show user engagement and help you perform the retention analysis or measure new feature impact, as well as prioritize product roadmap
A thorough product analysis of your user segments can also pinpoint the target market, so you actually position yourself in the right niche, multiplying your chances for conversion.
It's your call, but before you get down to analyzing data, you must have your objectives clear.
Step 2. Know your product and how users interact with it
No matter the "why" behind it, if you're analyzing feature adoption or how users engage post-onboarding, you must know the ropes of your product. Inside out. And back.
But it doesn't end here. Once you master all the intricacies of your product, it's time to do the very same thing from the user's perspective because it's not about you (quoting the Ancient One ⤵️)
Gather data on product overview
Before you start looking at the product through your users' lens, make sure you have the basic facts straight and you know the answer to this, seemingly simple question:
What problem does your product solve, and how does it work?
Apart from the obvious, it should also reveal your value proposition along with the target audience.
Now, how do you learn your users' perspective?
The best way to start off—eat your own dog food 🦴. It's the fastest way to understand how your product features work in practice and what can potentially cause user concerns.
Having the basics grounded, let's move to data collection and dig into your qualitative and quantitative data.
Quantitative data to capture user behavior
Let's put it straight: you can't and shouldn't measure everything. Too many metrics in your product data collection will overload your teams and obscure significant data. Nonetheless, there is a golden standard of key metrics to track, no matter what.
📡 User behavioral analytics will help you understand how users interact with your product.
Metrics to have a look at page views, clicks, session duration, and conversion rate.
📡 User retention and churn are the ultimate scales of your success, and you need to be on top of them. Always.
A consistently growing retention level is a sign that you deliver as a company—the product performance is good, marketing strategies work, and user expectations are fulfilled (or even surpassed).
Conversely, with a growing churn rate, you need to dive deep into product analysis and find the culprit fast. Is it the product itself? Maybe it's positioned to the wrong target audience? Or maybe it crashes way too often?
📡 Customer lifetime value (LTV) is a metric you can use to segment your users to identify patterns in their behavior. Especially those who bring the most revenue. Analyze their customer journey, how they use the product, what they need, and...act accordingly.
Following your top-tier user preferences gives you a fair chance of boosting conversion and pushing your product in the right direction.
💡TIP: Don't be satisfied with raw data.
No matter what metrics you choose to follow, remember to always build a context around them; otherwise, they'll end up in the vanity metrics cemetery. For example, 100k pageviews standalone look good, but with a 4-second average session duration or a 1% conversion rate, there's clearly an issue to solve.
Qualitative data to capture user insights
Quantitative and qualitative data are the yin-yang of product analysis. You can never grasp the entirety of user experience without analyzing both.
So, where should you take qualitative data from while running a product analysis report?
💌 Customer feedback comes in all shapes and sizes. You can get customer feedback from your customer-facing teams: Support, Success, and Sales. While it's an important source of learning the user's POV, it shouldn't be the only one.

We will make an educated guess that most of your customer base will be reluctant to reach out to support. In fact, the ACA Survey Report shows that 43% of customers would rather clean a toilet than call customer support.
Although we should probably take this particular result with a pinch of salt, you have to remember that most dissatisfied customers leave silently. That's why it's crucial to be proactive when it comes to collecting customer feedback.
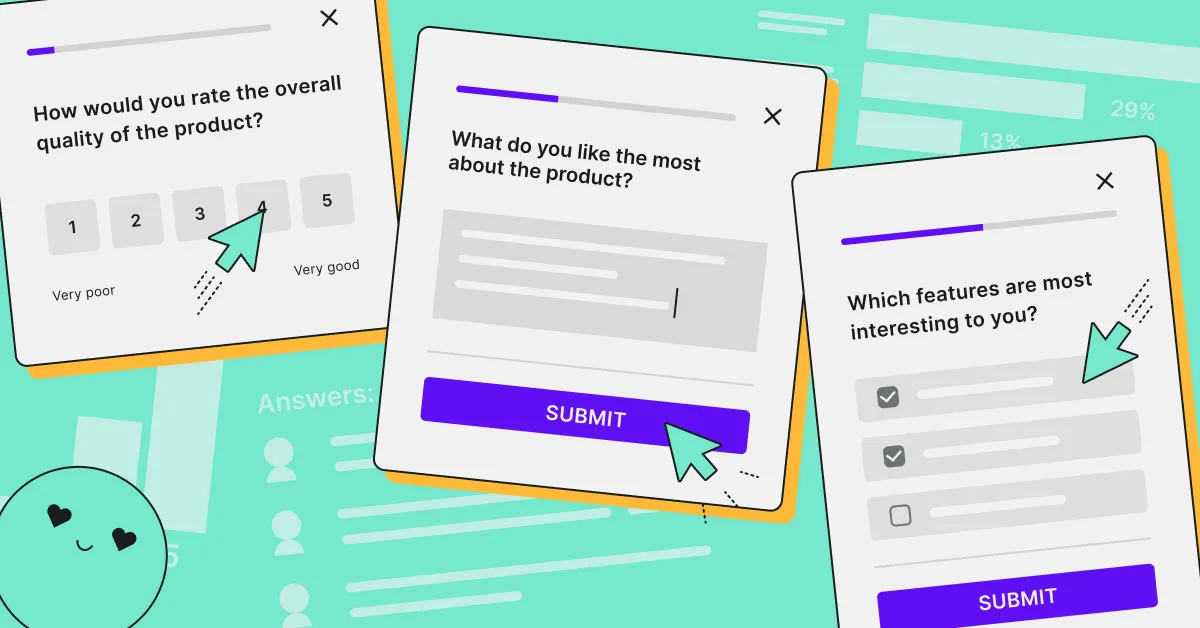
And that's where online surveys come in handy for many different purposes. Be it measuring product satisfaction, feature validation, or finding the product-market fit. Easily distributed at different touchpoints, be it in-product, in-app, website pop-up, or email, online surveys are sidekick to getting customer insights fast and in bulk (and they also serve for the quantitative research!).
💌 Customer interviews are the obvious choice for getting valuable user insights, but they require more resorts and time. However, they are definitely the best method to get an in-depth perspective from your users. Just don't forget that they will make the analysis process longer and will most probably require a separate team member specializing in user research to look into this qualitative feedback to identify patterns and trends.
💌 Customer testimonials and online reviews, again, a rather reactive than proactive way to collect user feedback. Nevertheless, it's crucial to keep a finger on a pulse and react quickly when negative reviews come in. Otherwise, it can end up with trust issues from potential customers and influence your user retention rate.
Step 3. Evaluate user experience
With all the collected data on the table, it's time to use it properly and get down to a proper product analysis to understand user engagement and identify trends. But before, don't forget to map out the digital journey—it will help you analyze data.
Map the user journey
When thinking about digital customer journey mapping, think globally. And focus on the user. Don't get entangled in the intricate relationships between Marketing, Customer Success, or Product teams. Instead, look at it as a whole experience.
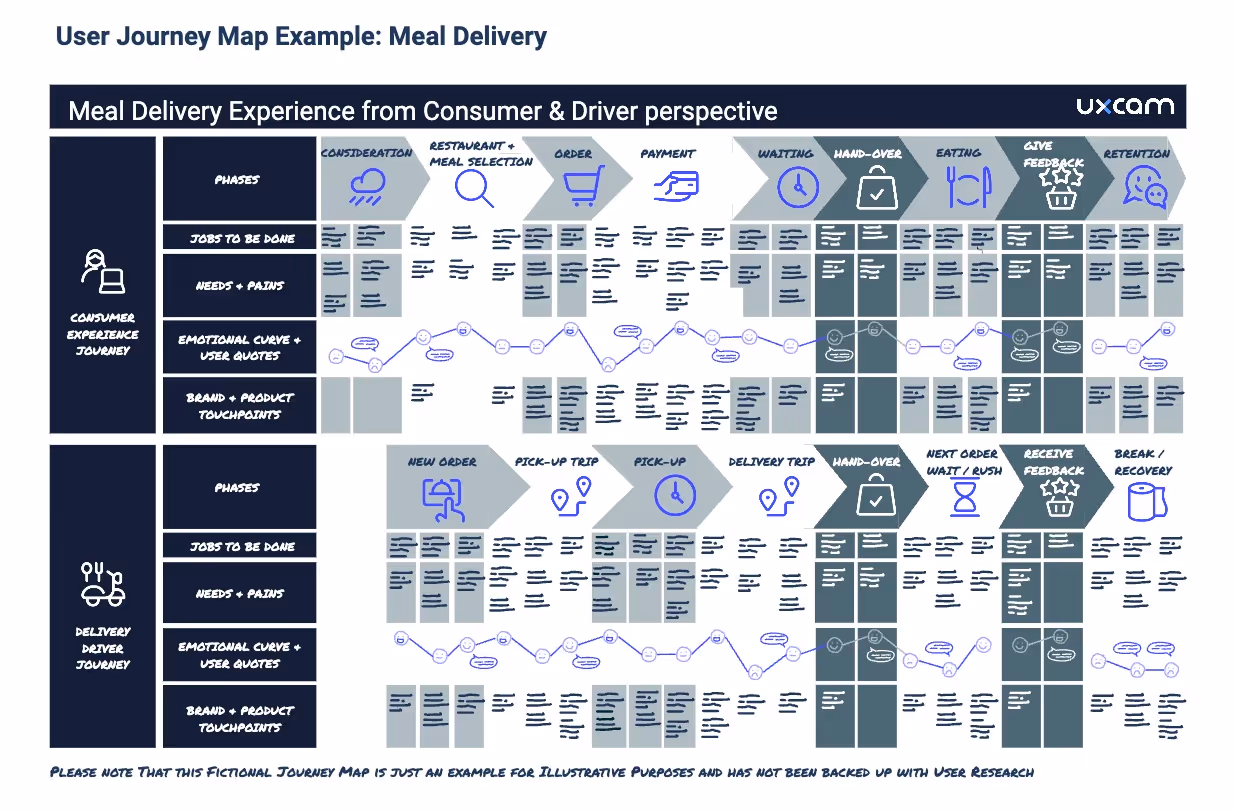
Examine how your customers move along the path with user flow data and mark any potential friction point or bottleneck. The product analytics data you collected should help you pinpoint any potential flaw in the user flow that can affect satisfaction levels and even raise the user acquisition cost.
Analyze user behavior data
Understanding how different types of users interact with your product is essential. To stay on top of user engagement, you may want to track metrics such as:
- Page views: Are certain pages or features attracting more attention?
- Clicks: What are users clicking on the most?
- Session duration: How long are users staying on your product?
- Conversion rates: At what rate are users taking the desired action?
Collecting this data with your product analytics tool allows you to notice specific trends among your users. Some may use your product daily, leveraging many features, while others might log in less frequently and use only a few. This will help you build your power and casual user segments—a handy resource for analyzing feature usage and product roadmap prioritization.
You can also consider segmenting users into categories:
- Free vs. paid users: Are paid users engaging more and getting more value?
- Active vs. dormant users: How many users are consistently active? Who has stopped using the product, and who has returned after a period of inactivity?
- Regional differences: Are there usage patterns based on geographic regions?
Performing a user journey analysis can reveal users' paths to achieving their goals within your product. This process will help you identify the following:
- Pain points: Where do users struggle or get frustrated?
- Bottlenecks: Where does the user flow slow down or stop?
- UX improvement areas: Which parts of the product need a design overhaul or simplification?
Tips for a thorough analysis:
💎 Prioritize metrics that reflect user engagement and satisfaction.
💎 Use segmentation to understand different user behaviors and needs.
💎 Map user journeys to visualize the user experience and identify improvement opportunities.
💎 Actively seek out and address user pain points to enhance the overall user experience.
Step 5. Perform competitive analysis
Your product does not exist in a vacuum; thus, you need proficient market intel and knowledge of what's up and coming in your niche. Competitive product analysis is an auxiliary yet powerful tool to enrich your product analysis report.
You can use secondary research to gather information about products you compete with. Compare features, pricing, and unique selling points, and finally, conduct trends analysis to understand the impact of feature adoption over time.
Running a competitive product analysis will help you explain the value of understanding your product's position in the market and how it compares to competitors. But that's not all. You should also discuss using competitive insights to differentiate your product and identify areas for innovation.
Step 6: Optimize and monitor
Okay, with all the data on the table, you now need to put it into action. Based on the gathered user feedback, collected data, and trend analysis, it's time to identify areas for improvement and optimization. How do you do it in practice? Look at some of the case studies below and get inspired.
Remember that monitoring product and user behavior is a continuous commitment. That's why you should establish a regular cadence for running your product analytics.
How user feedback can help in product analysis - case studies
Helps in the continuous discovery (Medscape)
Using surveys within a Continuous Discovery framework, Medscape's Product teams have enhanced their product development by directly incorporating user feedback. Contextual surveys have been key in recruiting users for interviews and validating hypotheses, leading to actionable insights.

This approach underscores the value of user feedback in driving product decisions and fostering customer-centric innovation.
Helps validate new features faster
Intergiro's product team used in-app surveys to validate new features and collect user insights during the product validation process. They periodically set up surveys in different parts of their product to get pinpoint feedback on specific elements.

For example, when developing a bulk payment feature to improve the payment flow for users who processed hundreds of operations manually, Intergiro first released it as a beta version to companies that provided initial feedback. The beta launch allowed them to collect valuable insights fast and make quick fixes before the public launch, reassuring the team that they provided a valuable addition to facilitate client operations.
Helps find the product market fit
Landing used Survicate's product-market fit survey to continuously measure how well their platform meets user needs and expectations. The PMS survey acts as a health check for Landing's value proposition, providing qualitative feedback that gets analyzed and transformed into new roadmap items.

As Liz from Landing notes, the survey feedback reveals gaps between what they assume users want versus their actual needs.
"Without this feedback, we're looking at an ocean through a straw."
By continuously validating their product-market fit through user insights, Landing can build a community-driven platform that truly meets customer demands.
And for more product-market fit inspiration, dive into PowerUs' story.
More use cases that can help you with product analysis
There are many more examples of how online surveys can help you gather data for sound product analysis. If you're on a mission to improve your customer journey, have a look at Hitta's case, how they employed NPS surveys to pinpoint bottlenecks, and how designing feedback loops helps them.
Speaking about NPS and customer centricity, you should definitely have a peek at how Preply fosters a company culture of "customer obsession" with NPS as their North Star metric.
If you're curious about how you could use the product feedback data, check Workwise's case study. And if you'd like to see if surveys could work along A/B testing and user satisfaction topics—wetter.com's story is a read to recommend.
Back up your product analytics data with customer feedback
Analyzing your product is a must; however, with the amount of data at hand, the vital part is to prepare well. Knowing the "why" behind your product analysis will save you a lot of trouble and potential chaos in your product team.
While quantitative data coming from your product can serve as a good outline for the story you seek to reveal, using customer feedback will fill the gaps with context and give you a fuller picture of the digital journey you offer.
And that’s where Survicate thrives. With us, you can run surveys that collect all kinds of statistical data (NPS, CSAT, CES, to name just a few), but surveys can also uncover more nuanced information collected with open-ended questions.
Importantly, you no longer have to fear the tedious open text analysis, as Survicate offers an AI text response analysis that will automatically group user feedback into topics, saving you a lot of time (and probably nerves).
Lastly, while we’ve already mentioned AI, you can also create your surveys automatically by simply describing your needs. Never has survey research been more effortless.
So, try it out—sign up for Surivate’s 10-day free trial, which offers all Business Plan features, and level up your product analysis process.


.webp)
.webp)
.svg)

.svg)

