Key Takeaways
- User friction hampers digital experiences, creating unnecessary hurdles that lead to frustration and potential user dropout. Addressing it promptly is vital to improve user satisfaction and retention.
- Surveys are instrumental in detecting friction points; NPS, CSAT, CES, and other types of surveys provide actionable user insights that can guide improvements to enhance the overall user experience.
- Simplifying user processes is crucial; a digital user journey with minimal steps can significantly reduce user friction and improve task efficiency.
- Enhancing UI/UX is non-negotiable; an intuitive interface builds a positive user experience, directly impacting user engagement and satisfaction.
- Personalized experiences are key; tailoring content and interactions to user preferences can bridge the gap between user expectations and service offerings, reducing emotional and cognitive friction.

What is user friction?
User friction is an all-too-common snag in the digital experience that users encounter while navigating websites, apps, and other platforms. It is the sum of impediments ranging from poor interface design to bugs that hinder progress, causing frustration and potential abandonment of the task at hand.
Often unexpected and always unwelcome, these obstacles disrupt the interaction flow, serving as speed bumps on the path to accomplishing a task online.
Identifying and mitigating user friction aims to create an effortless user experience where the technology is an enabler rather than a barrier. This involves diagnosing the types of friction, which include emotional, cognitive, and interactional resistance, and applying methods to alleviate the friction points.
Ultimately, the key is for designers and developers to anticipate user needs and smooth out any wrinkles that could lead to user dissatisfaction or the loss of customers.
Types of user friction
There are generally three recognized types of user friction:
- Emotional friction: This type involves feelings of frustration or stress that prevent you from completing a task.
- Interaction friction: Here, the difficulty arises from the product's interface, where interactions with the system are not intuitive or straightforward.
- Cognitive friction: Occurs when there is a gap between what you expect to do and what the product requires, causing confusion or mental effort.
What causes user friction?
User friction impedes your ability to interact with digital products effortlessly. Understanding its causes is crucial for enhancing your user experience.
- Poor user interface design: includes cluttered layouts, inconsistent font usage, and confusing color schemes that can hinder the user's ability to complete tasks efficiently.
- Complex navigation: like hidden menus, overly complicated dropdowns, or a lack of search functionality.
- Inadequate user onboarding: without clear guidance, users might struggle to understand how to use an application effectively.
- Requirement of excessive information: asking for too much information just to use a service can be off-putting, especially if it leaves the user questioning the purpose and security of the data collection.
- Lack of mobile optimization: it can include unreadable text, unclickable links, and slow load times, which detract from your mobile user experience.
Collect user feedback to eliminate friction points
Surveys are a direct line to customer thoughts and experiences. They help you spot and smooth out bumps in the user journey.
From gauging loyalty to pinpointing specific issues, the right survey can show where users are getting stuck. Here's a breakdown of survey types that can reveal user friction.
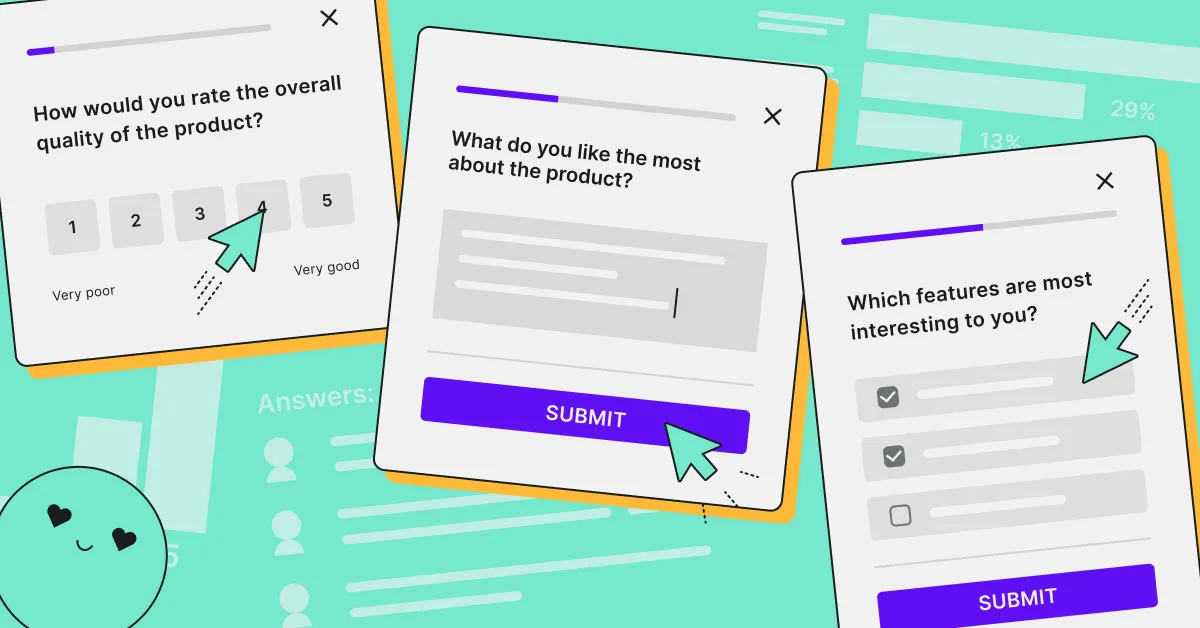
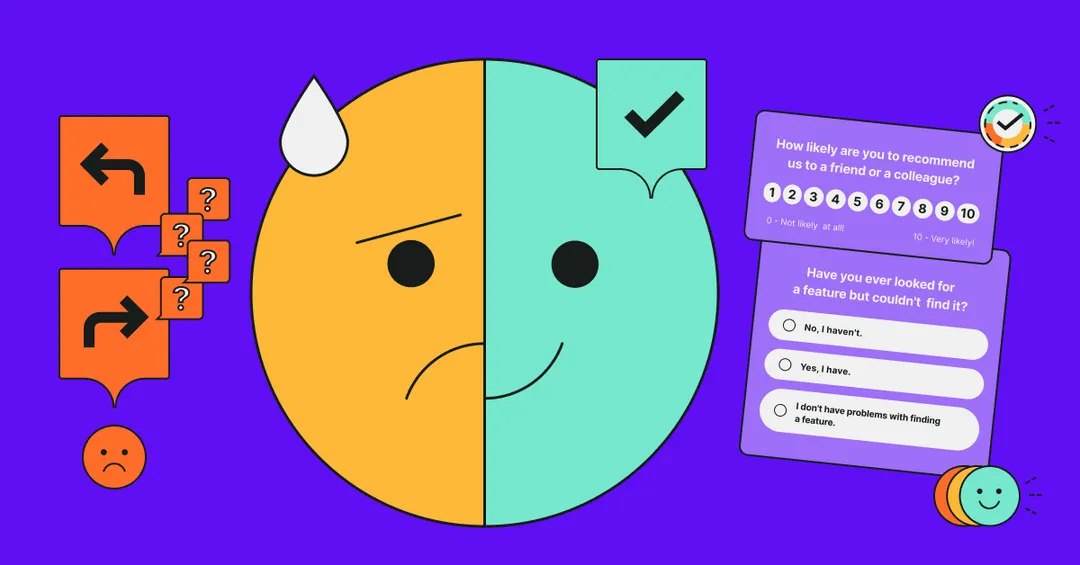
Which surveys help to spot digital friction?
NPS, or Net Promoter Score surveys, ask customers to rate the likelihood of recommending a company's product or service to others. The score is a clear measure of customer loyalty and satisfaction.
By analyzing the responses, businesses can identify areas where users are experiencing friction, which may prevent them from promoting the brand.
Customer Effort Score (CES) surveys measure how easy it is for users to do what they need to do with a product or service. These surveys ask, "How easy was it to handle your request?"
A high effort score indicates significant user friction, and a signal to analyze your users' digital journey.
Customer Satisfaction Surveys, or CSAT, are used to understand how satisfied customers are with a product, service, or a specific interaction.
By asking a follow-up open-ended question, you can get a sense of where friction might be occurring and what aspects are working well.
These surveys may be a part of the usability testing process. They focus on how users interact with a product or service, particularly the user interface. Usability surveys help understand if the design is intuitive and if users find the product easy to use.
Feedback from these surveys can highlight complex or confusing elements that cause user experience friction.
Exit surveys are presented to users as they are about to leave a website or app. These surveys aim to understand why users are leaving and can uncover issues that may not be apparent through other forms of feedback.
They're especially useful for identifying unexpected friction points that could lead to a loss of users and churn.
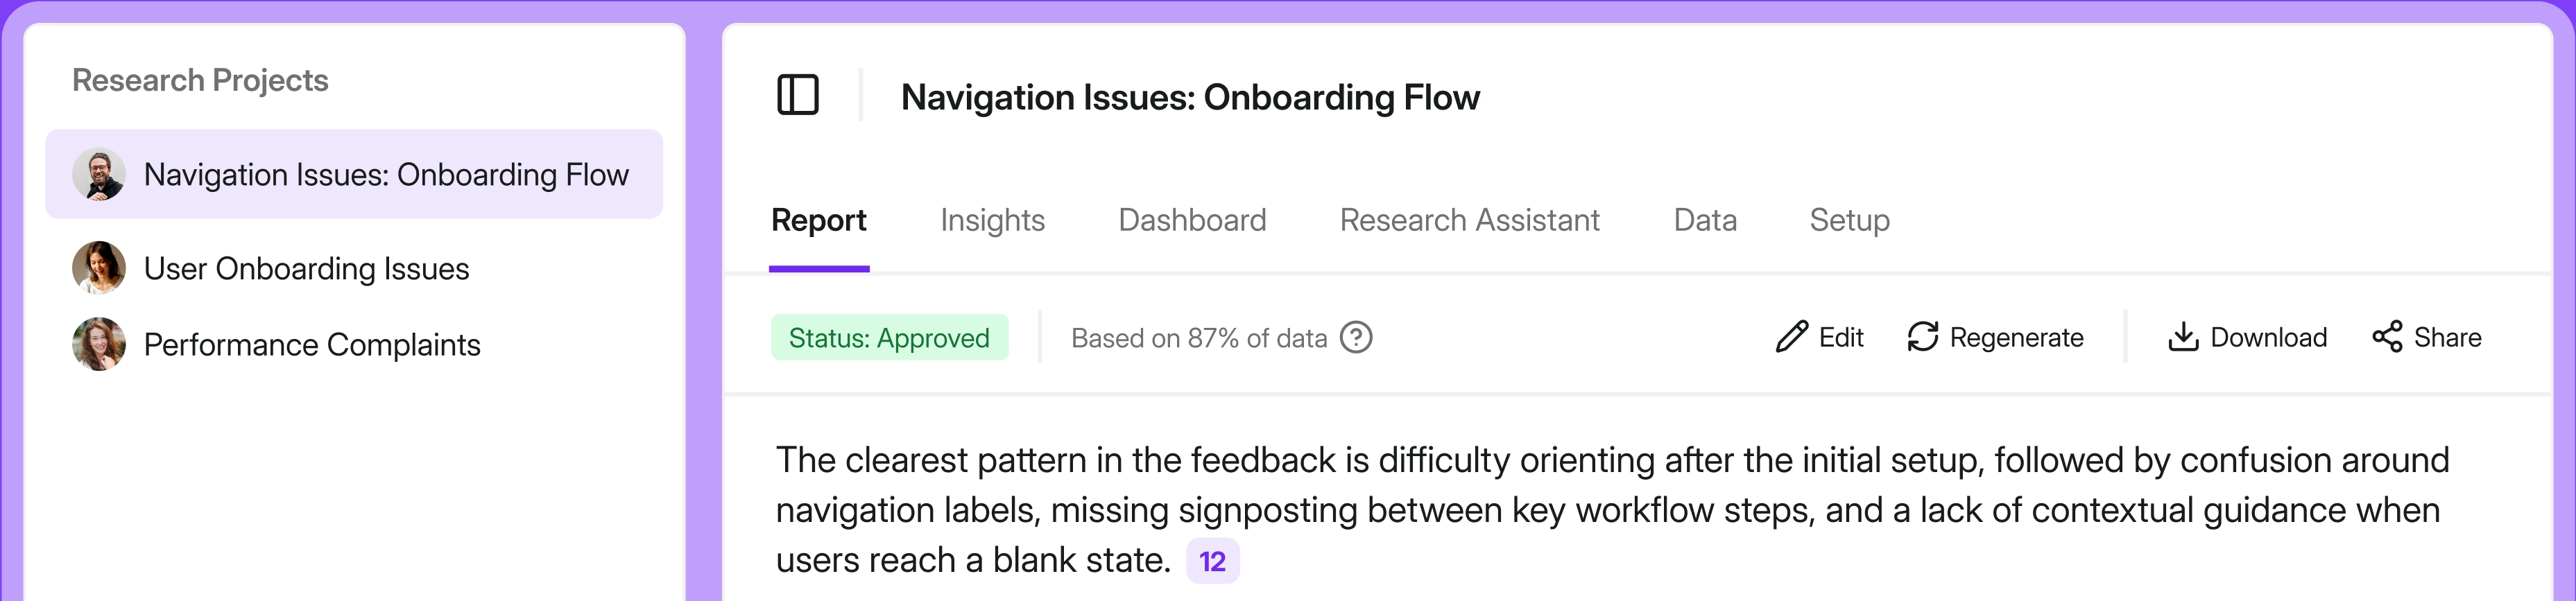
Onboarding surveys collect user opinions on their initial experience with a product or service. These surveys are crucial for understanding if the onboarding process is smooth or if obstacles make it difficult for users to get started.
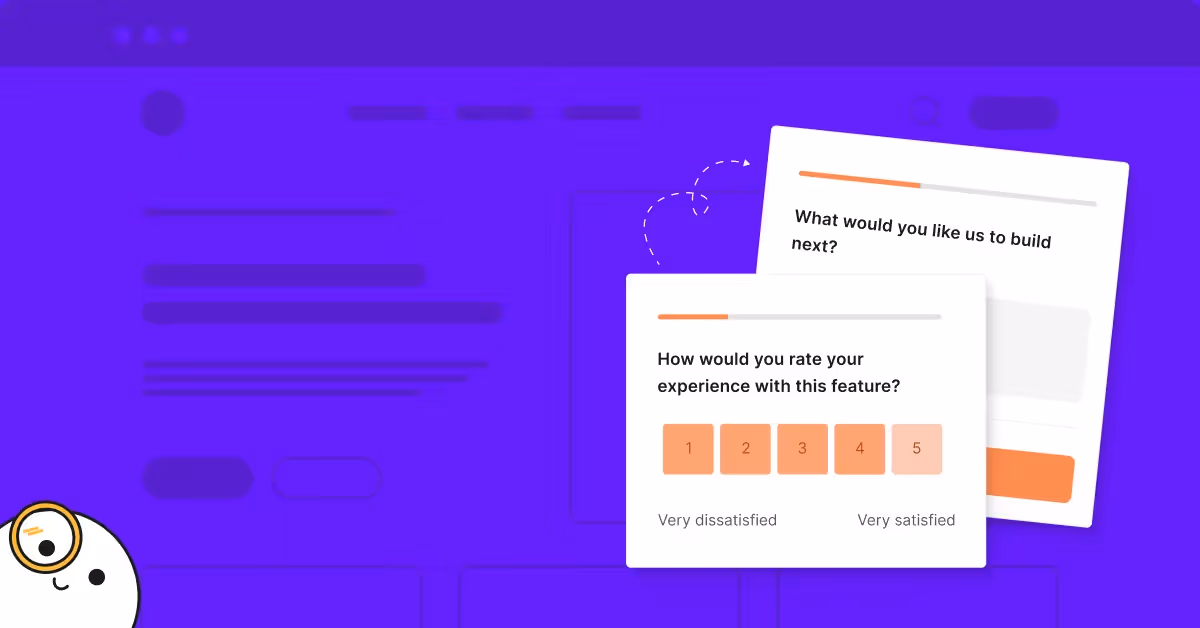
When new features are rolled out, or updates are made, feature-specific surveys target user opinions on these changes.
This feedback is important for determining whether the new features enhance the user experience or introduce new friction points.
Finally, post-transaction surveys are used to gather customer feedback immediately after a purchase or interaction.
This type of survey is key for identifying friction within the buying process or service experience, allowing businesses to make quick adjustments to improve customer satisfaction.
Best survey distribution channels
Choosing the right channels to distribute surveys is key to getting valuable user feedback. Here are effective ways to reach users for insights into their experiences and friction points.
Email surveys
Email surveys reach users after they've interacted with your service or product. They're ideal for collecting in-depth feedback and understanding any friction the user may have experienced.

In-product surveys
In-app surveys are placed within the application, allowing immediate feedback while the user engages with your app. This immediacy helps identify friction points as they happen.
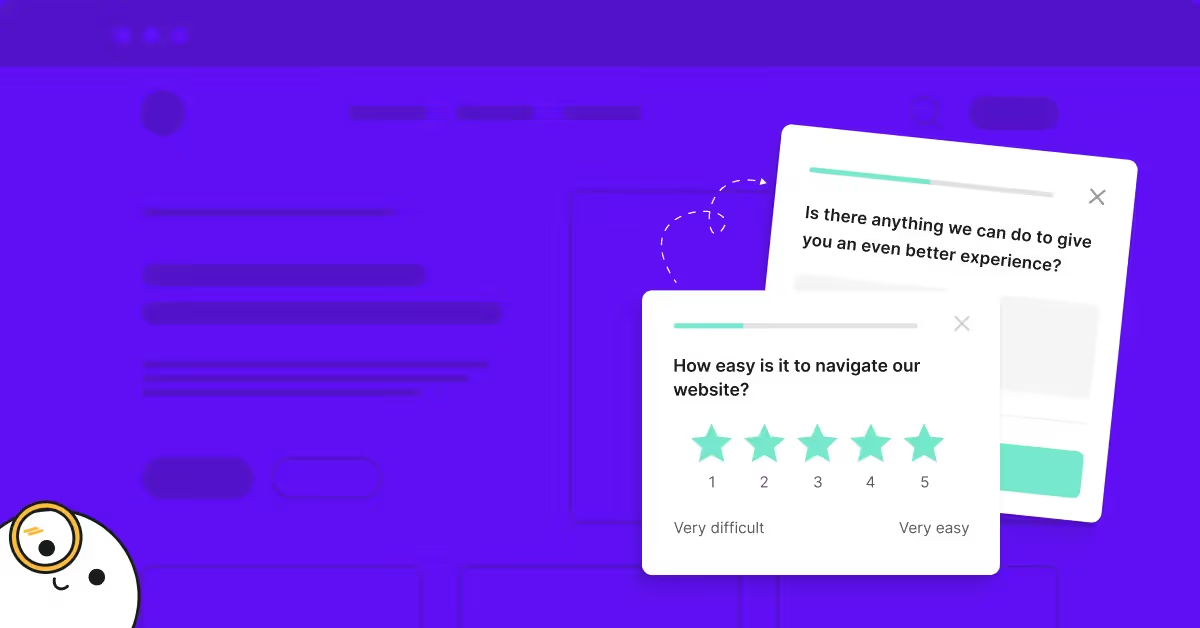
Pop-up website surveys
Website feedback widgets provide a constant opportunity for users to report issues or suggest improvements. Their simplicity encourages users to share their thoughts without much effort.
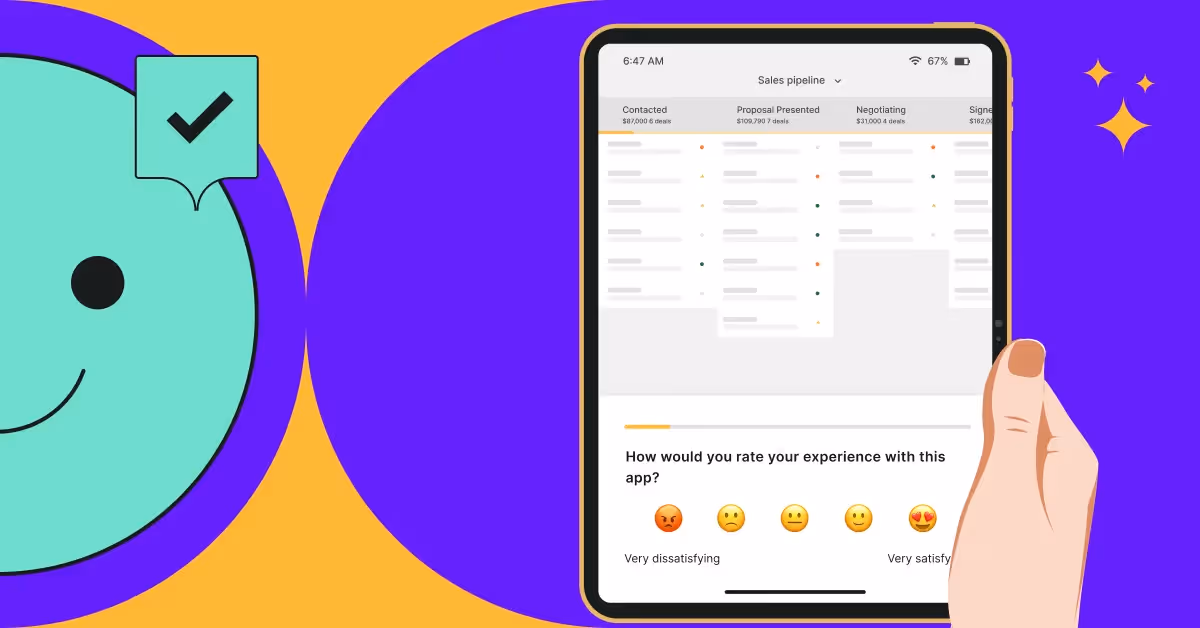
Mobile in-app surveys
Mobile surveys are tailored for users on the go. They cater to the mobile experience, ensuring the feedback is relevant to that platform's unique user interface and interaction challenges.
Detecting user friction with advanced survey targeting
To effectively use surveys to identify user friction, precise targeting is essential. Here's how to ensure your surveys collect actionable insights:
- Segment your audience: Tailor your surveys to specific user groups based on behavior, demographics, or user status (new vs. returning). This ensures questions are relevant and can elicit more accurate responses.
- Utilize trigger-based surveys: Set up surveys to appear after certain actions, such as after a purchase or when a user exits. This captures feedback at critical moments.
- Use microsurveys: Limit the number of questions and make them specific to the user's experience. This increases completion rates and the quality of the data collected.
- Ask open-ended questions: Use open-ended questions to gather detailed feedback but balance these with closed-ended questions to maintain simplicity and clarity.
- Test and iterate survey design: Continuously test different survey formats and question types to find what yields the most insightful responses.
- Incorporate rating scales: Use scales (e.g., 1-5) for users to rate their experience. This provides quantitative data that is easy to analyze for trends.
- Time surveys appropriately: Don’t interrupt critical tasks with surveys. Choose a natural pause or completion point in the user journey to ask for feedback.
How to eliminate friction points?
Reducing user friction is essential for improving both customer satisfaction and retention. Implementing these targeted strategies will streamline your users' experience, making every interaction with your product more efficient and enjoyable.
Make user processes simple
Simplify navigation and remove unnecessary steps in workflows. Ensure your user's journey towards completing a task is as direct and efficient as possible. For example:
- Prioritize tasks: List the most common tasks and ensure they are the easiest to accomplish.
- Minimize steps: Evaluate whether every step in a process is necessary; if not, remove it to save users' time.
Enhance user interface and experience
The user interface (UI) directly impacts the user experience (UX) and should be intuitive and free from confusion. Actions to enhance UI/UX include:
- Improve clarity: Use clear, descriptive labels for buttons and actions to prevent misunderstandings.
- Optimize for responsiveness: Ensure your design adapts smoothly across devices, providing a consistent experience.
Personalize content and communication
Personalization bridges the gap between user needs and your services. To increase engagement:
- Tailor content: Show relevant and engaging content based on the user's past behavior to make their experience more relevant.
- Interactive elements: Implement features like progress tracking to encourage continued use and interaction with your product.
How to measure user friction?
To accurately assess user friction within your digital product, it’s essential you employ comprehensive evaluation methods. These methods will highlight areas that may be inhibiting user engagement and satisfaction.
Analyze user feedback
Collect and analyze user feedback to gain direct insights into users' challenges. Utilize surveys, interviews, and feedback forms to ask targeted questions about your users' experiences. Pay close attention to recurring issues or points of confusion that may signify high friction areas.

- Surveys and feedback forms: Design brief, focused surveys that encourage honest feedback.
- Interviews: Conduct one-on-one sessions to get to know user experiences.
- Feedback Forms: Embed forms within the product for real-time responses.
Assess behavioral metricsReview quantitative data to understand how users interact with your product. Key performance indicators (KPIs) such as bounce rates, exit pages, and time on task can indicate friction points.
- Bounce Rate: A high bounce rate might suggest a page is too complex or does not meet user expectations.
- Exit Pages: Frequent exits from specific pages could indicate a problem with content or functionality.
- Time on Task: Longer than average time spent on simple tasks often signals usability issues.
Review customer support inquiriesAnalyze customer interactions to identify common user difficulties. Support tickets, chat logs, and call transcripts are valuable sources of information regarding user friction.
- Support Tickets: Look for patterns in user complaints and requests for help.
- Chat Logs: Assess logs for signs of confusion or repeated queries about the same issue.
- Call Transcripts: Evaluate discussions for evidence of frustration or repeated problems.
Impacts of user friction
User friction can significantly affect digital customer experience, impacting personal satisfaction and the commercial success of the app or website in question.
Reduced user satisfaction
If you encounter emotional friction, your journey becomes fraught with negative feelings. This might be due to a design that doesn’t resonate emotionally or tasks that are frustrating to complete.When your interactions are marked by annoyance or confusion, your overall satisfaction with the service drops, which can deter you from reusing the product.
Lower conversion rates
The presence of interaction friction makes tasks, like completing a purchase, more challenging. Statistics suggest that such friction contributes to as many as 71% of online shopping carts being abandoned.When your conversion pathway is obstructed by poor design or confusing navigation, conversion rates for the business decline sharply.
Increased User churn rate
Cognitive friction arises from designs that compel you to expend more mental effort than necessary, which can overwhelm or fatigue you.This might manifest in complex processes or unclear instructions that can lead to you ceasing to use the application altogether – a direct correlate to increased churn rates for the provider.
Design Considerations for Minimizing User Friction
When creating digital interfaces, you aim to make tasks as easy as possible for users. Here are key design considerations to minimize user friction:
Understand your user's goals: Tailor the design to meet user expectations with an intuitive flow. This means knowing what your users want to accomplish and structuring the experience to facilitate those actions effortlessly.
Simplify user journeys: Don't overwhelm users with the number of steps required to complete an action. Users should be able to achieve their objectives with minimal obstacles and in as few clicks as possible.
Reduce too much cognitive load:
- Use familiar UI patterns
- Provide clear labels and instructions
- Avoid information overload
Optimize onboarding processes: Break down complex tasks into manageable parts and guide users through with in-context help and tutorials. This can include:
- Interactive guides
- Progress indicators
- Tooltips
Offer self-service support:
- FAQs
- Chatbots
- Help centers
Address emotional friction: Be conscious of how users might feel at each step. Minimize confusion, frustration, or dissatisfaction by:
- Consistency in design to set clear expectations
- Feedback mechanisms like confirmations and error messages to reassure users
Refine with data: Regularly collect and analyze user data to identify and resolve friction points. Consider metrics such as:
- Time spent on tasks
- Abandonment rates
- User feedback surveys
By incorporating these considerations, you support smoother interactions that increase satisfaction and higher conversion rates.
Minimize user friction with Survicate
By identifying friction points, you can take targeted actions to simplify processes, enhance interfaces, and personalize user interactions, ultimately bringing a more enjoyable and efficient experience.
Survicate offers a powerful toolset to detect and address user friction. With customizable surveys, you can gather valuable insights directly from your users, identifying specific areas for improvement.Whether it's through NPS, CES, or usability surveys, Survicate equips you with the data needed to make informed decisions that enhance user satisfaction and loyalty.
Reducing user friction isn't just about improving aesthetics or functionality; it's about understanding your users and refining your digital touchpoints to meet their needs more effectively. With Survicate's sophisticated survey software, you can pinpoint trouble spots and precisely refine your user experience.
Ready to smooth out the digital bumps and boost your user engagement? Sign up for Survicate's free 10-day trial of all the Business Plan features. Experience firsthand how the right insights can transform user friction into user flow.
User friction FAQs
In this section, you'll find targeted answers to common queries about user friction and various strategies for optimizing user experiences.
How can methods for reducing user friction be implemented in design?
To reduce user friction in design, you can streamline user workflows, simplify interfaces, and ensure functionalities are intuitive. Regularly conducting usability tests also provides insights that enable you to refine the user interface (UI) to minimize obstacles.
What are effective ways to identify points of friction in the user journey?
You can identify friction points by analyzing user behavior data, seeking user feedback, and performing A/B testing. Heatmaps and user session recordings are practical tools that reveal where users face difficulties or abandon tasks.
What role does cognitive friction play in user experience?
Cognitive friction occurs when a user is confused or experiences mental strain while using a product. It negatively impacts user experience, increasing the effort required to understand and use an interface, potentially leading to user dissatisfaction or disengagement.
How can user friction be measured and analyzed effectively?
User friction can be measured by tracking metrics such as error rates, task completion times, and abandonment rates. Analyzing these metrics within the context of the user journey helps determine where optimizations are necessary to reduce friction.
In what ways does interaction friction impact overall user satisfaction?
Interaction friction, such as cumbersome navigation or complex processes, can lead to frustration, reducing overall user satisfaction. Ensuring smooth, responsive, consistent interactions is crucial for maintaining a positive user experience.
What strategies can be employed to minimize friction in user interfaces?
To minimize friction, design user interfaces that are clean, consistent, and familiar. Use predictable navigation patterns, provide clear calls to action, and maintain a responsive design. Offloading complex tasks and incorporating helpful prompts also reduces friction.


.webp)
.webp)

.webp)
.webp)
.svg)

.svg)