
It comes as no surprise that understanding and predicting customer behavior is paramount to success. Companies, big or small, thrive on their ability to effectively engage with customers. But how can businesses measure this elusive concept of engagement?
That's where customer engagement metrics come into play.
This guide will walk you through the basics, breaking down complex terms into simple ideas that even a high schooler can grasp. Let's dive into the sea of customer engagement metrics and uncover the keys to upholding strong relationships with your audience.

What are customer engagement metrics?
Before we embark on this journey, let's define the term. Customer engagement metrics are tools that help businesses measure their customer interactions and relationships.
Think of it as a report card for your company's ability to connect and resonate with the people who use your products or services. They provide insights into customer behavior, preferences, and satisfaction levels.
Overview of customer engagement metrics
When tracking your business performance, you must monitor customer engagement metrics. These metrics offer insights into how effectively your business interacts with its customers.
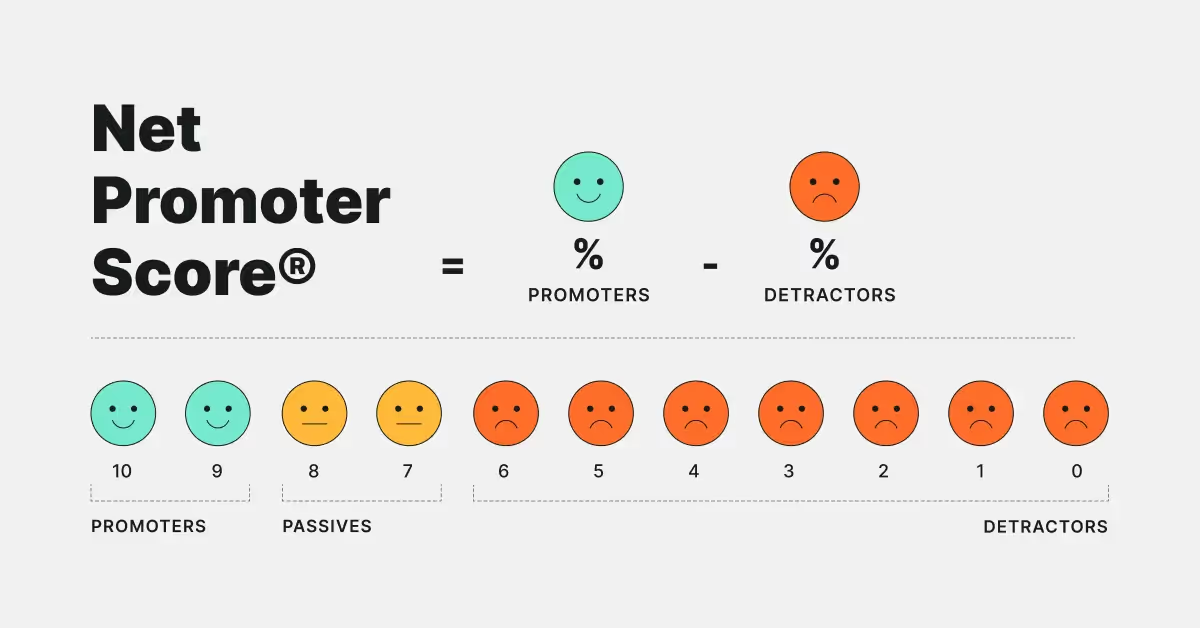
This metric assesses the loyalty of a company's customer relationships. Net Promoter Score (NPS) is often used as an alternative to traditional customer satisfaction metrics and is correlated with revenue growth.
The score is calculated based on responses to a single question: On a scale from 0 to 10, how likely are you to recommend our company/product/service to a friend or colleague?
Respondents are grouped into three categories:
- Detractors (0-6): Unhappy customers who can negatively impact your brand through negative word-of-mouth.
- Passives (7-8): Satisfied but indifferent customers who competitors could sway.
- Promoters (9-10): Loyal enthusiasts who will keep buying and referring others.
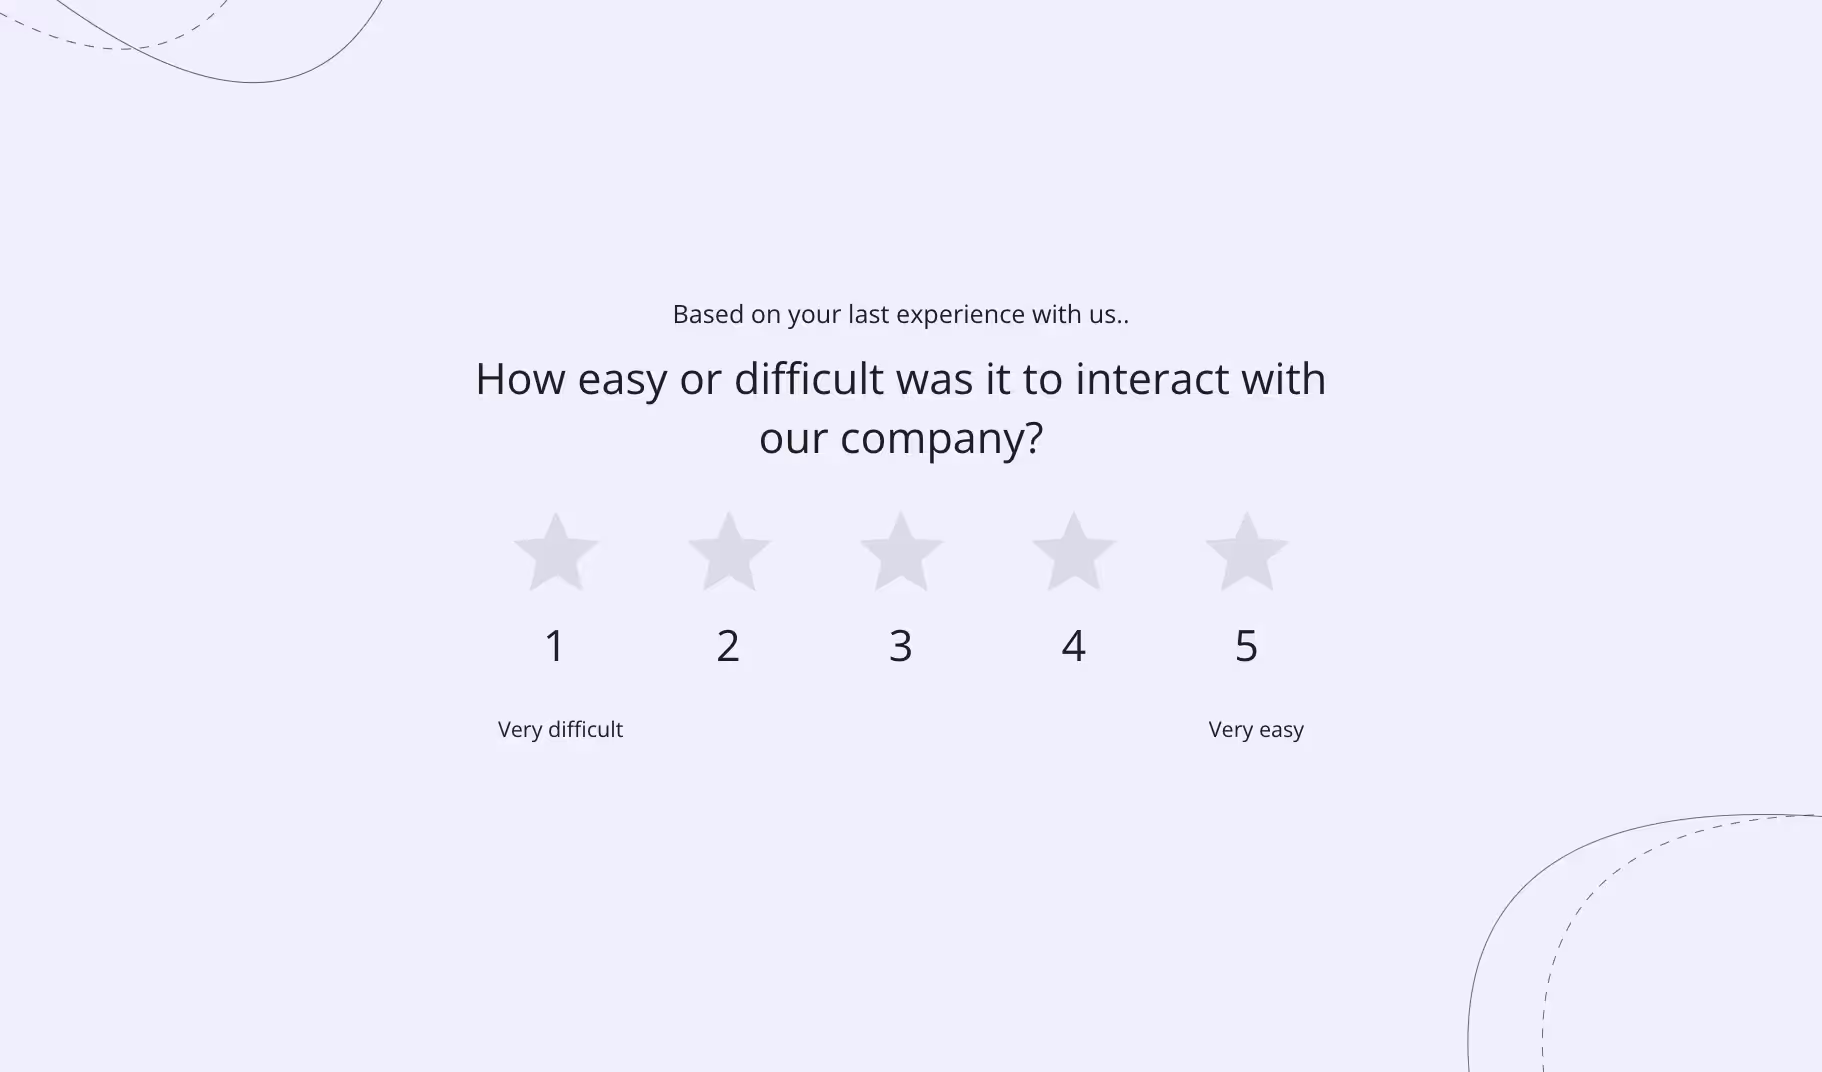
It measures the ease or difficulty a customer experiences when interacting with your company. A lower score indicates a smoother customer experience, which can lead to higher satisfaction.
This indicates interaction levels on your website. It considers factors like session duration, conversions, and page views. An engaged session might involve staying on the site for over 10 seconds, viewing at least two pages, or completing a conversion event.

Customer Lifetime Value (CLTV)
Represents the total revenue a business expects from a single customer account throughout its relationship with the company. A high CLTV suggests strong engagement and greater business value.

Monitoring these metrics can help you tailor your strategies for improved customer engagement. Understanding the customer acquisition cost is also essential in evaluating the effectiveness of customer engagement strategies, as it helps measure the cost associated with acquiring new customers and the impact on the business's growth and customer satisfaction.
Key Performance Indicators
Key performance indicators (KPIs) are crucial for understanding and tracking customer engagement metrics. By tracking these metrics, you can gauge the health of your customer relationships and implement strategies for improvement.
Conversion rate
Your conversion rate is the percentage of visitors to your website who complete a desired action, such as a purchase, subscription, or form submission. A high conversion rate indicates that your site effectively incentivizes users to take action.
Customer Lifetime Value
Customer Lifetime Value (CLV) predicts the total value your business will derive from your entire relationship with a customer. Knowing your CLV helps you decide how much to invest in customer acquisition and retention.
Customer retention rate
Your customer retention rate is the number of customers you keep over a given period, excluding new ones. Monitoring this KPI is essential as retaining existing customers costs less than acquiring new ones.
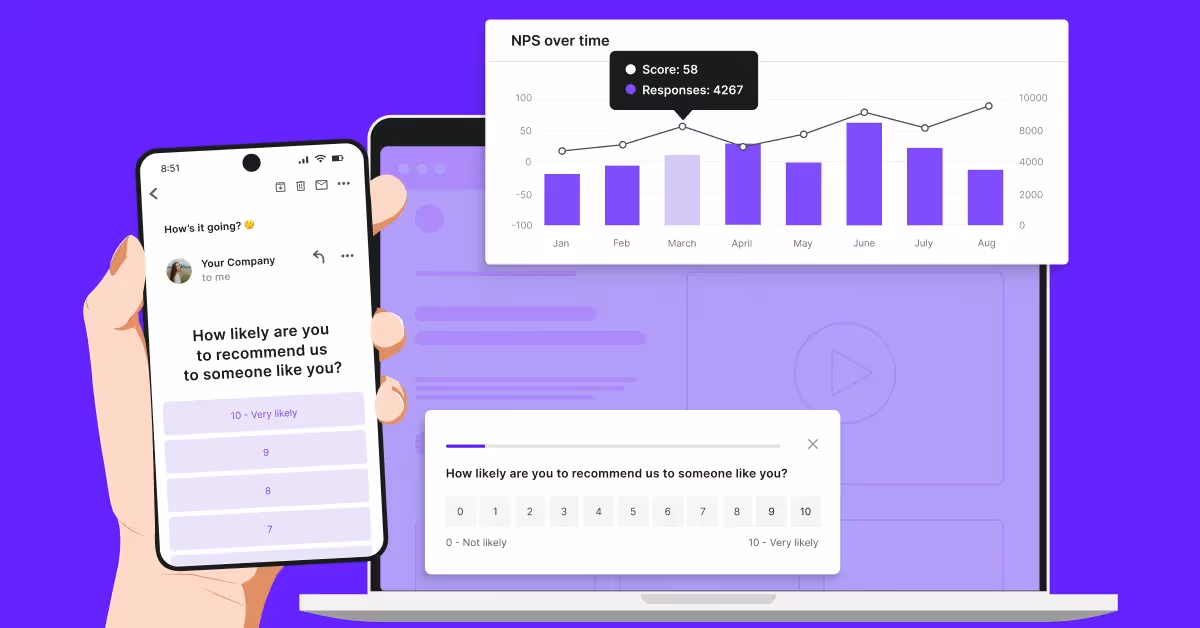
Net Promoter Score (NPS)
The Net Promoter Score (NPS) measures customer loyalty and the likelihood of customers recommending your brand. Customers are surveyed on a scale from 0 to 10, with responses grouped into Detractors, Passives, and Promoters.
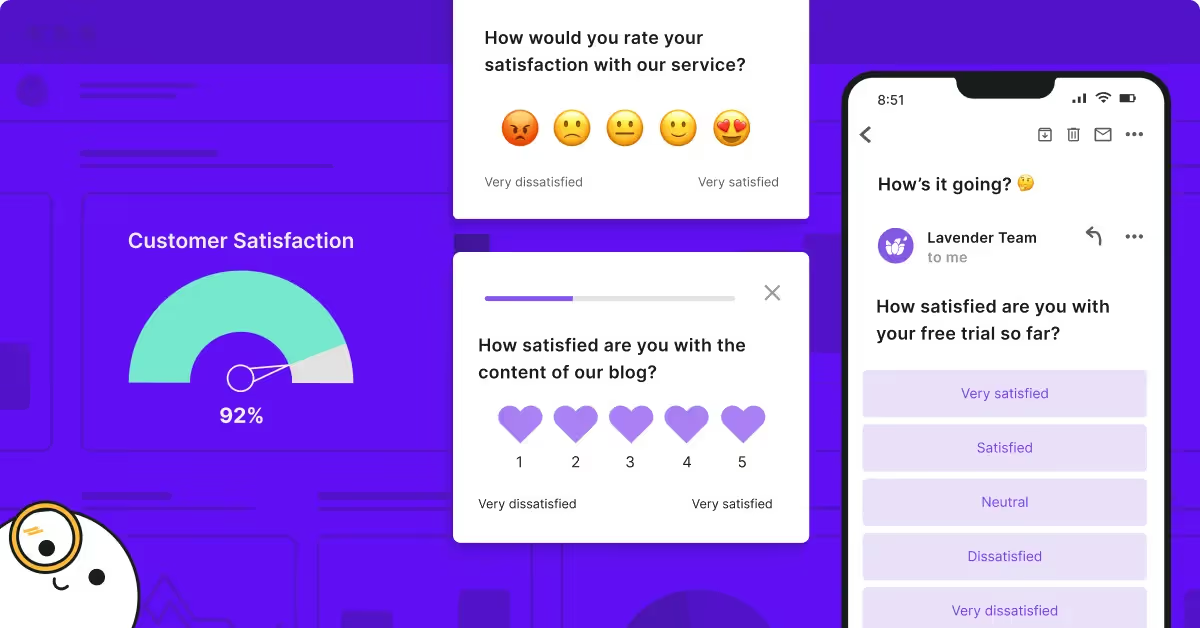
Customer satisfaction score (CSAT)
Finally, your Customer Satisfaction Score (CSAT) measures customers' satisfaction with your offerings. Customers rate their satisfaction, typically on a 1 to 5 scale, providing immediate feedback about their experience with your product or service.
Engagement through digital channels
Certain metrics can be key indicators of how effectively your content resonates with your audience.
They allow you to assess the quality of interaction and engagement your users have with your digital channels. Keeping customers engaged through digital channels helps improve customer satisfaction and build loyalty, directly influencing their overall experience with your brand.
Click-through rate (CTR)
Your Click-through rate is a critical measure of the percentage of people who click on a link after seeing your content. A higher CTR indicates that your message is compelling enough to encourage further action.

- How to Calculate: (Number of Clicks / Number of Impressions) x 100
- Use Case: Evaluate the effectiveness of your ads, emails, or social media posts.
Bounce rate
Bounce rate measures the percentage of visitors who navigate away from your site after viewing only one page. It's a signal of how engaging and relevant your content is to the initially presented audience.
- High bounce rate (>70%): Often suggests the content was not relevant or engaging.
- Low bounce rate (<30%): Implies content closely aligns with visitors' expectations.
Page views per visit
This metric indicates how many pages a user visits in a single session. It gives insight into how engaging and navigable your website is.
- To increase page views: Ensure your site has relevant internal links and clear calls to action.
Social media engagement
Social media engagement reflects how your audience interacts with your content across platforms like Facebook, Twitter, and Instagram. It includes likes, comments, shares, and follows.
- Engagement rate formula: (total engagement / total followers) x 100
- High engagement: Suggest content that resonates well with your audience.
- Types of engagement: Likes, comments, shares, and mentions.
User behavior analysis
User Behavior Analysis (UBA) is a systematic approach to understanding how users interact with your product. It lets you gather insights into their behavior and optimize the user experience accordingly.
Session duration
Session duration measures users' time on your site within a single visit. Monitoring this metric can help you gauge content relevancy and site performance.
A higher average often indicates that users find value in your content, while a lower average may signal the need for improvement.
Frequency of visits
The frequency of visits refers to how often users return to your site or application. It is a crucial metric that reflects user retention and loyalty.
You can track this by looking at Daily Active Users (DAUs), Weekly Active Users (WAUs), and Monthly Active Users (MAUs). High frequency suggests strong engagement and value offering.
Interactions per visit
Tracking interactions per visit provides insight into how users are engaging with your site's features during each session. This includes clicks, form submissions, or any other measurable activity. High interaction rates can indicate a compelling and intuitive user interface, essential for a positive user experience.
Voice of the Customer
The Voice of the Customer (VoC) is a collection of insights that reflect your customers' experiences and expectations. It is a strategic approach to improving customer satisfaction and loyalty.
Customer Feedback
You collect customer feedback to understand how your customers perceive their interactions with your brand. This feedback can manifest as:
Customer satisfaction scores (CSAT)
These metrics offer quantitative data that provide a snapshot of customer sentiments.
Sentiment analysis
Sentiment analysis employs AI tools and natural language processing to quantify the tone of customer feedback. It categorizes opinions as positive, negative, or neutral. You can observe sentiment trends and shifts over time via:
- Social media comments
- Reviews and ratings
- Customer service communications
Understanding sentiment helps refine your strategies to enhance customer experiences.
Customer suggestions
Your customers' suggestions are a rich source of innovation and improvement. Actively soliciting ideas through:
- Surveys and questionnaires
- Feedback forms
- Online forums and community boards
These inputs can guide product development, service enhancements, and customer journey refinements.
Loyalty and advocacy measurements
To effectively measure customer loyalty and advocacy, emphasizing the importance of customer engagement is crucial for creating loyal customers.
Engaged customers are not only more likely to become loyal; they also tend to overlook company glitches, spend more, and are highly likely to recommend your brand to others.
You should focus on specific metrics that reflect repeat customer behavior and the promotion of your brand through word-of-mouth. They are crucial for understanding how your customers interact with your brand over time and the likelihood of them driving new business to you through referrals.
Repeat purchase ratio
The repeat purchase ratio (RPR) is a direct indicator of customer loyalty. Calculate RPR by dividing the number of customers who have made more than one purchase by the total number of customers over a given period.
For instance, if you have 100 customers and 30 have purchased more than once:
- Example Calculation: ( \text{RPR} = \frac{30}{100} = 0.30 ) or 30%
A higher RPR suggests stronger customer loyalty.
Referral rates
Referral rates are a measure of advocacy that evaluates the propensity of your customers to recommend your brand.
- Method: Track the number of referrals over a period and compare it to your active customer base to ascertain the rate.
- Tip: Offer a simple and trackable referral program to measure this metric accurately.
High referral rates can indicate that your customer base is loyal and actively engaged in promoting your brand.
Membership renewals
Membership renewals denote loyalty, particularly for subscription-based services and membership clubs.
- Key points: Monitor the percentage of members who renew their membership after it expires.
- Significance: This metric is a testament to your value, compelling members to continue their association.
An increasing trend in membership renewals is a positive sign of sustained customer loyalty and satisfaction.
Churn analysis
Churn analysis is crucial for examining your customer engagement metrics and understanding and mitigating the loss of your customers over time.
Churn rate
Customer churn rate is a fundamental metric representing the percentage of your customers who discontinue your services during a certain time frame.
To calculate your monthly churn rate, you divide the number of customers you lost within the month by the total number of customers you had at the beginning of the month. Take the result and multiply by 100 to get a percentage:
Monthly Churn Rate = (Customers Lost During Month / Total Customers at Start of Month) * 100
Why customers leave
Identifying why customers leave is central to churn analysis. By examining data from sources like exit interviews and customer feedback, you gain insights into common reasons for attrition, which can be both qualitative (e.g., dissatisfaction with service) and quantitative (e.g., usage frequency).
Common causes include:
- Poor customer service
- Lack of perceived value
- Attraction to competitor offerings
Reactivation success rates
Finally, assess your reactivation success rates. This metric shows the effectiveness of your efforts to win back customers who have churned. Tracking reactivation helps refine your engagement strategies:
- Percentage of churned customers successfully re-engaged
- Impact on revenue and customer lifetime value (CLV)
Common pitfalls in measuring customer engagement
Just like making the perfect lemonade, measuring customer engagement can be tricky. Here are some pitfalls to watch out for:
- Focusing too much on numbers: While essential, they don't tell the whole story. Don't forget to dig into the reasons behind the metrics. If people give low CSAT scores, find out why.
- Ignoring negative feedback: Imagine someone telling you your lemonade is too sweet. It might sting, but it's valuable feedback. Negative comments are opportunities for improvement. Don't sweep them under the rug.
- Not adapting to change: Just as your taste in lemonade might change, customer preferences evolve. Keep an eye on trends and be ready to adapt your strategies accordingly.
- Relying on a single metric: Like using only one ingredient in your lemonade, relying solely on one metric can lead to an unbalanced view. Combine different metrics for a holistic understanding.
The road ahead: continuous improvement with Survicate
Managing customer engagement metrics is not a one-time task. It's a journey of continuous improvement. You should see these metrics as tools for growth, always striving to improve your lemonade.
Embark on your journey to understanding customer engagement with Survicate. Sign up today for a free 10-day trial and unlock the power of insightful metrics.
Because just like perfecting your lemonade recipe, understanding your customers is the key to success.

Frequently Asked Questions
In this section, you’ll find answers to common queries related to the key metrics instrumental in measuring customer engagement. These metrics provide insight into your customer’s interactions, satisfaction, and overall loyalty to your brand.
Understanding how to track customer engagement is crucial for calculating a customer engagement score, which helps measure and understand customer engagement metrics to improve customer relationships, drive business growth, and foster brand loyalty.
What are the most common metrics used to measure customer engagement?
The most common metrics include Customer Satisfaction Score (CSAT), Net Promoter Score (NPS), Customer Effort Score (CES), and churn rate. Each of these metrics gives a different perspective on how customers interact with your business.
How do you calculate a customer engagement score?
A customer engagement score is often calculated based on customer interactions with your brand, like website visits, downloads, and social media interactions. The specific formula can vary depending on the company's priorities but often involves weighting different types of engagement according to their importance.
What role do social media metrics play in understanding customer engagement?
Social media metrics, such as likes, shares, comments, and follows, are crucial for gauging how effectively your content resonates with your audience. They shed light on your brand's reach, and the interaction customers have with your social media campaigns.
Can you list the key performance indicators for successful customer engagement?
Key performance indicators (KPIs) for successful customer engagement include conversion rate, retention rate, average time on site, session depth, frequency of purchases, and customer lifetime value. These KPIs help you understand the depth and value of customer interactions with your brand.
How is email marketing engagement typically assessed?
Email marketing engagement is typically assessed by monitoring open rates, click-through rates (CTR), and email conversion rates. These indicators reflect how compelling your email content is and its effectiveness in driving desired customer actions.
What are some effective ways to track product usage and engagement?
Product usage and engagement can be tracked through metrics such as active users, session length, feature usage, and adoption rate. These metrics help you understand how customers interact with your product and which features they find most valuable.


.webp)
.webp)


.svg)

.svg)

