If it can be measured, it can be improved. This holds true for all things in marketing and business. When it comes to customer experience, it’s also very much true, but there is one problem - how do you even measure customer experience? After all, putting a number on experience seems to be counter-intuitive - but not impossible. Reading this quick and easy guide is exactly what you should be doing to tell if your customer experience efforts are working. So, how do you measure online customer experience?
Let's cut to the chase.
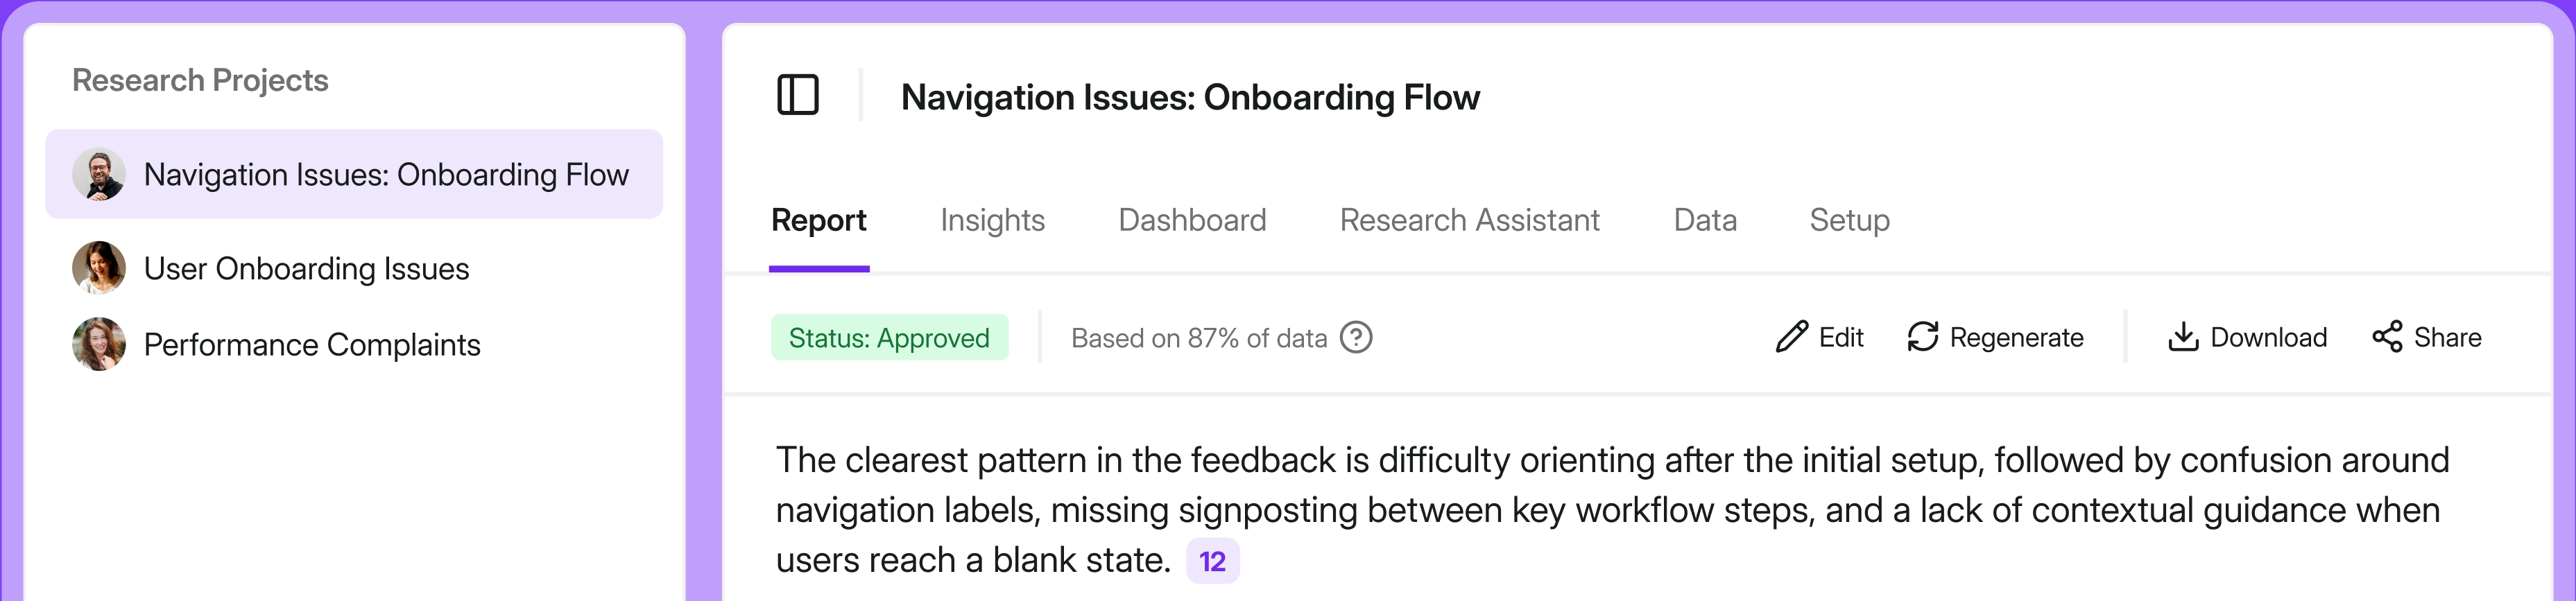
1. Use surveys to measure Customer Satisfaction (CSAT)
Have you ever been frustrated by interpreting customer satisfaction scores? There’s a slight problem - it depends on so many factors that are out of your control. For example, the customer's mood or the time of day they interacted with your product and many others.
And it gets worse – customers might not be completely honest about their experience, or may not remember the details of the interaction. Sounds familiar? The solution: Create targeted surveys.
Surveying customers is a great way to get feedback on their experience with your business. By asking questions about their satisfaction with your products (or their parts), you get a better idea of what needs to be changed, improved and optimized in your customer experience. When you spend time on survey targeting, your survey can fit the customer journey and catch the right respondents at the right time. For example, you can:
- use the number of website visits to target your survey
- show the survey only to visitors from a specific source (e.g. LinkedIn campaign, Facebook ad)
- ask the questions to visitors speaking a particular language (only speakers from Spanish-speaking countries, for example)
Targeted surveys help you identify customer pain points and areas where your business might be falling short. Plus, you are less likely to misinterpret CSAT results.

How to create CSAT surveys
Soon after a customer interacts with your product, send them a short survey. Your survey can be set up in minutes with Survicate which offers 125+ ready-made templates to choose from. With this intuitive platform, you can easily create surveys that suit your needs and goals. After the four-step creation process, send out your survey via email or a shareable link. You can also launch it on a mobile app or your website. So simple.
If you want to get the most accurate CSAT results, there are a few things you should keep in mind.
Pay attention to the question wording – Depending on how a survey question is formulated, the answer may differ. For example, if you ask "Are you satisfied with our company's products?" you are likely to get a different response than if you ask "What could we do to improve our products?"
Be aware of response bias – This happens when people tend to answer questions in a way that is not representative of the population. For example, people may be more likely to respond to a survey if they are unhappy with the company's products compared to a satisfied customer.
Don't wait too long to send out the surveys – The longer you wait, the more likely it is that your customers will forget their experience with your business, which can hurt the B2B customer experience.
Be sure to follow up with customers – Thank your customers for taking the time to fill out your surveys. Let them know that you're taking their comments seriously and that you’ll act on their feedback.
2. Use Net Promoter Score to segment your audience
“How likely are you to recommend our product to a friend or family member?” This one question can give you many insights into your customers’ experience with your product. However, you can’t just ask this question and then leave it at that. Net Promoter Score is not a set-it-and-forget-it kind of metric. You need to constantly monitor your Net Promoter Score and actively work to improve it. What's the most effective way to do it?
The solution: Segment your audience. In general, respondents are asked to give an answer between 0-10. 0 (not at all likely to recommend the product) and 10 (extremely likely to recommend the product). According to their responses, customers are classified into three categories:
- Promoters – 10 or 9 – They are your brand advocates who will continue to use your product and recommend it to others.
- Passives – 8 or 7 – They might be satisfied with your product but not happy enough to be loyal customers. Be careful: you may lose them.
- Detractors – 6 or less – They’re unhappy with your product and are likely to spread negative word-of-mouth. They need your utmost attention.
How to deal with segmenting your audience?
Remember that not all customers are equal. Therefore, when segmenting your audience for net promote score purposes, consider factors such as e.g. customer lifetime value (LTV) or customer churn rate. For example, if you have a high customer churn rate among passives, it might be worth focusing on keeping them happy and turning them into promoters. Alternatively, if you have a low customer churn rate but a high number of detractors, you might want to focus on improving your product for that segment.
In short, when measuring net promoter score, take into account the bigger picture and tailor your approach accordingly.
3. Use the Customer Effort Score to find bottlenecks in your customer journey (CES)
Exactly how much effort does it take a customer to complete a particular task? Bottlenecks are places in your customer journeys where customers are getting stuck and cannot proceed to complete a particular action, such as try out. Identifying bottlenecks is the first step to fixing them. The more you understand where they are, the easier it will be to improve and transform the customer experience. When your customer journey does not lead to the expected destination, and the customers just give up somewhere along the way, it is time to identify the friction points where they put too much energy in.
The solution: Use the Customer Effort Score. CES is a key KPI for identifying customer journey bottlenecks that you should keep an eye on.
A high customer effort score indicates that something is wrong with your customer journey. It could be anything – from a confusing checkout process to a complicated user interface.
How to deal with measuring Customer Effort Score?
Run CES surveys – They help you identify if your audience finds it easy to interact with your company. A CES survey means that it’s carried out after specific interaction, during specific customer journey touchpoints. For example, after signup, after trying out a specific feature, after completing a purchase on your eCommerce store, etc.
Use heatmaps and session recordings - Heatmaps can be used to visualize areas on your website or app where users are struggling. They show you where people are clicking, how far they scroll, and what they’re looking at. More importantly, they help you uncover bottlenecks in the most visual way possible.
4. Use the Churn Rate to find out where you’re losing the most business
You're might be losing customers – and you might don't even know about it. They’re churning - leaving your business for some reason, big or small. Maybe your product is fine, but your customer service is bad. Maybe your website is hard to navigate. Maybe your product is not mobile-friendly. The problem is that most businesses don't have a clue where the problem lies. They think they're doing everything right, when in fact, they're throwing money down the drain. And at a certain point, churn will surpass new customer growth and your business will be in a tight spot that’s hard to get out of.

The solution: Calculate your churn rate
The customer churn rate tells you how many customers are leaving or no longer paying for your services over a particular time period. It’s a critical metric for customer experience analytics – as it’s 6-7x more expensive to find new customers than it is to keep existing ones. The churn rate helps you determine which groups of users are losing interest in your services. And, where you need to make adjustments to improve the customer experience in troublesome areas.
How to measure the churn rate
Track all customer key touchpoints – from awareness, acquisition, engagement, and customer retention. You need to identify which interactions led to customers leaving. Was it a poor first interaction? A customer's problem with billing? Lack of features they were looking for? You can calculate churn by dividing the number of customers you lost over a period of one month with the number of customers you won that month and multiplying that number by 100.
So, if you had 80 new customers at the end of the month and 100 of them left you, that means that your churn rate is 80/100*100=8%. A good churn rate is anywhere from 5-7% on an annual basis, so 8% is fairly high. Regardless of the churn you have at the moment, it’s always a good practice to keep your finger on the pulse as churn can be the silent killer of any SaaS product. To find out why your customers are churning, you can use a customer exit survey.
5. Use the Lifetime Value to find out which customers stay the longest and why (LTV)
The longer a customer sticks around, the more valuable they are to your business. But it's not just about quantity – it's also about quality. It's better to have a small group of dedicated customers than a large group of one-time buyers who only spends a few bucks here and there. So, how can you tell which customers are going to stick around for the long haul? And more importantly, how can you keep them satisfied so they continue to do business with you? Learn more about customer loyalty ➡️ Customer Loyalty Guide: Build a Strong Customer Base
The solution: Use the Lifetime Value metric

Lifetime Value is a way to measure how much revenue (or profit) a customer will generate over the course of their entire relationship with your business. Consider that lifetime value can vary depending on the product or service you're offering. A customer who purchases expensive items or who requires regular maintenance will likely have a higher lifetime value than one who purchases low-cost items that they only need once.
Keep in mind that lifetime value is just one metric and it's important not to get too hung up on it - just like any other metric on this list taken in isolation. It's helpful, but it's not the be-all and end-all. There are other factors that contribute to a customer's worth, so make sure you're taking those into account as well.
How to deal with measuring Lifetime Value?
Track customer purchase history – How long the customers stay with your company, and whether or not they refer others. Use CRM tools and systems that will give you easy access to this information.
Measure revenue at each touchpoint – You can measure the revenue customers generate at each touchpoint in the customer experience lifecycle. This will give you a clear idea of which customer experience channels and interactions are most valuable to your company.
Integrate records to create the customer journey – Look at all the data you have on each customer, from shopping history to service interactions. This will give you a complete view of the entire customer journey map.

Start measuring customer experience today
Can you finally put customer experience KPIs into action? We believe so. By following our five examples, you should be able to identify the most important customer experience metrics now. Getting to know your customers’ needs better is just a step away. Start with creating a Survicate survey and listen to what your customers have to say. Sign up for our 10-day free trial and create powerful surveys today! ⬆️


.webp)

.webp)
.svg)

.svg)