UX metrics show you if the changes you’ve made based on user research are working. They help you put a number on those initiatives and suggest whether you’re going in the right direction.
Even though it might be tempting to measure every metric and KPI that might be relevant to your research, it’s best to focus on a few that will really move the needle for you.
In this blog post, we’ll discuss 6 of the most popular behavioral and attitudinal UX metrics and KPIs you should be aware of in 2025.

Attitudinal UX KPIs
Attitudinal UX metrics provide information on how your users perceive your product or service by focusing on their subjective opinions and feelings.
They help uncover users' expectations, preferences, and emotional reactions, which can inform your design decisions and help create a more user-centric experience.
Net Promoter Score (NPS)
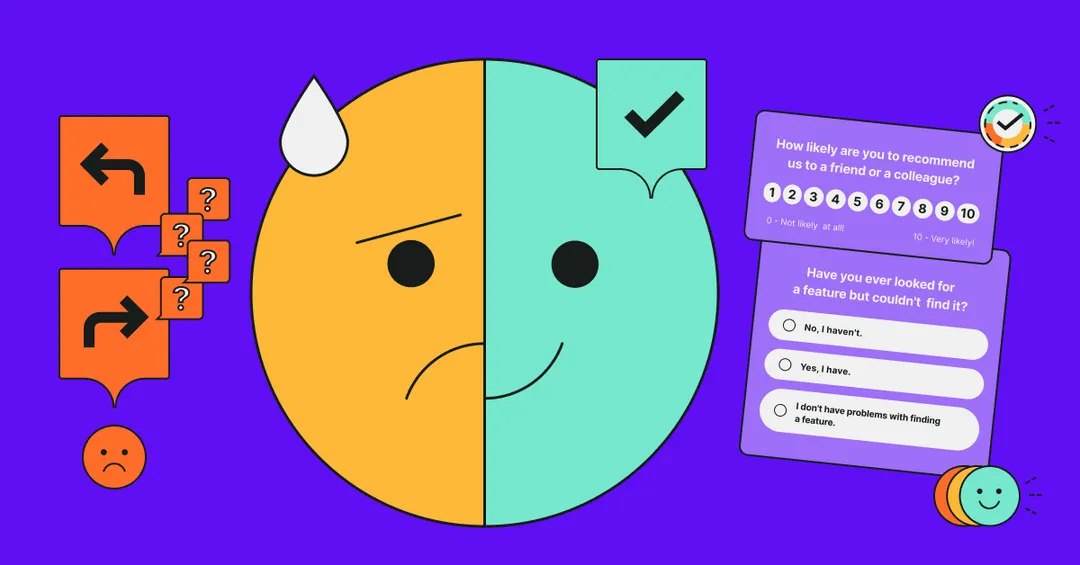
NPS measures the likelihood that your users would recommend your product to a friend. The metric is composed of a simple rating-scale question:
“How likely is it that you would recommend this company to a friend or colleague?”
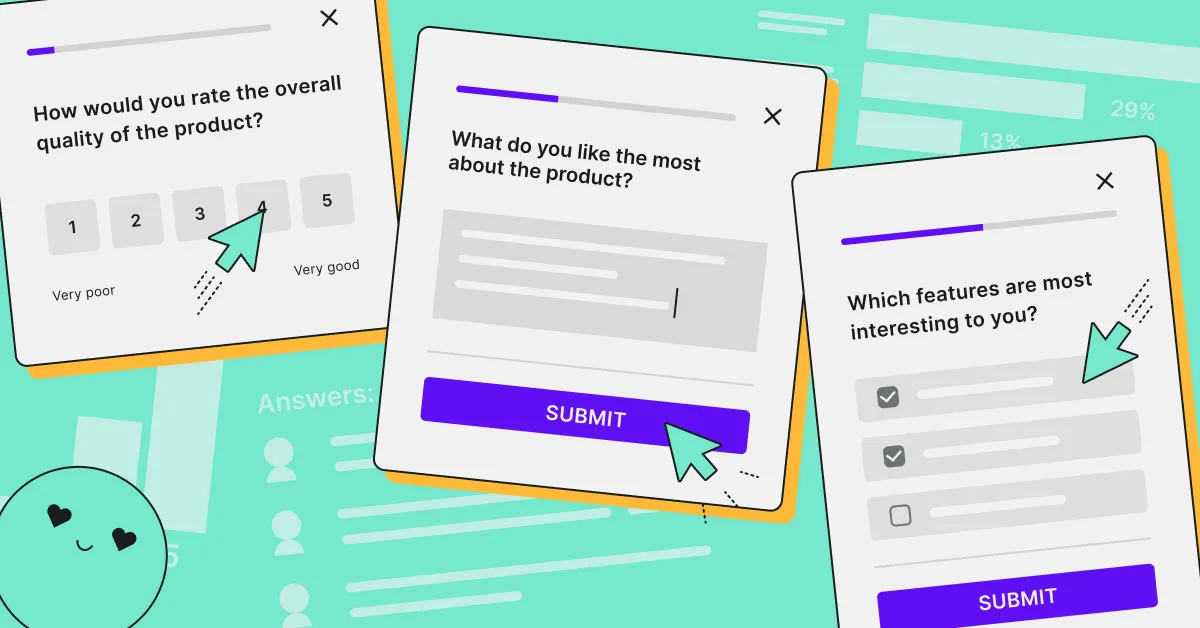
The easiest way to measure NPS is by using automated surveys, such as the one in the template below:
To answer the question, customers need to select a score on a scale from 0 to 10. Based on their response, they fall into one of three groups:
- Promoters (score 9-10)
These are customers who are highly satisfied with your product/service and are likely to recommend it to others. They’re most likely to keep shopping with you, so your aim should be always increase your number of Promoters.
- Passives (score 7-8)
These are customers who are satisfied with your product/service but are not enthusiastic enough to recommend it to others. Even if they shop from you regularly, they might switch to a competitor if they get a better deal.
- Detractors (score 0-6):
Detractors are customers who are unhappy with your product/service. They’re likely to discourage others from using it or spread negative word of mouth.
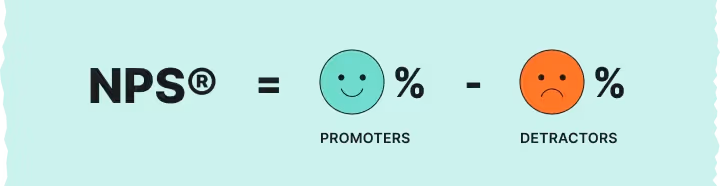
To calculate your NPS score, work out the percentage of total respondents in each category. Then, subtract the Detractors’ percentage from the Promoters’ percentage.
You can also use our free NPS calculator. Simply enter the number of responses for each category into the relevant fields and get a score.
Although NPS is a reliable indicator of your customers’ overall experience and satisfaction with your product or service, you need to ask for more information to find out why they feel a certain way.
You can do so by adding a follow-up question to your NPS survey, as in the example below:
Customer Satisfaction (CSAT)
Customer Satisfaction (CSAT) is a standardized survey you can use to measure customer satisfaction.
A typical CSAT survey asks the respondents to rate their satisfaction on a 1-to-5 scale. You can ask your users about their general satisfaction with your brand or a particular product or service you offer.
The first rating question is often followed by additional, open-ended questions—for example, asking the respondents to provide a reason for their score.
Just like with NPS, the easiest way to measure CSAT is with a survey tool that comes with a pre-loaded template such as the one below:
To calculate your CSAT score, you'll only need the number of satisfied customers (those who picked 4 or 5).
The CSAT formula is:
(the number of 4s and 5s) ÷ (total number of responses) x 100 = CSAT score

System Usability Scale (SUS)
The System Usability Scale (SUS) is a standardized, reliable, and easy-to-use tool to measure the end users’ perception of how usable and user-friendly a product is.
The metric consists of a 10-item questionnaire that uses a 5-point Likert scale (from 1 - Strongly disagree to 5 - Strongly agree) for each item. Participants rate their level of agreement with each statement, and the scores are then calculated to produce a final SUS score ranging from 0 to 100. The higher the score, the better the perceived usability of the system.
- I think that I would like to use this system frequently.
- I found the system unnecessarily complex.
- I thought the system was easy to use.
- I think that I would need the support of a technical person to be able to use this system.
- I found the various functions in this system were well integrated.
- I thought there was too much inconsistency in this system.
- I would imagine that most people would learn to use this system very quickly.
- I found the system very cumbersome to use.
- I felt very confident using the system.
- I needed to learn a lot of things before I could get going with this system.
The methodology and scoring are outlined in the System Usability Scale (SUS) Template. You can adapt the questions to better suit your needs.
Some of the benefits of the SUS include:
- Simplicity: The metric is relatively simple to administer and understand, making it easy to implement even for those who are not experts in usability testing.
- Reliability: The SUS has been widely tested and proven to be a reliable tool for assessing usability across various types of systems and user groups.
- Versatility: The SUS can be used to evaluate a wide range of products and services, including websites, software applications, hardware devices, and more.
- Cost-effectiveness: As a self-administered questionnaire, the SUS is a cost-effective means of gathering usability data compared to more resource-intensive methods.
Behavioral UX KPIs
Behavioral UX metrics tell you how users interact with your product and what problems they face as they complete the tasks.
They are quantitative measures that provide data on user actions and behaviors such as click-through rates, time on task, task success rates, error rates, and navigation paths.
Behavioral metrics can help identify patterns, trends, and potential pain points in the user experience as well as provide measurable data to drive your UX design decisions.
Task Success Rate (TSR)
TSR measures the effectiveness of a product or a feature by representing the percentage of users who are able to complete a task in a study.
It is calculated by dividing the number of users who completed the task by the total number of users who attempted the task, and then multiplying the result by 100 to express it as a percentage.
Measuring TSR is important for several reasons:
- Identifying usability issues: By tracking the TSR, you can identify specific tasks that users are struggling with, which may indicate usability issues. This will help you prioritize areas for improvement and address the problems more efficiently.
- Benchmarking: You can use TSR to benchmark the performance of a product against its previous versions or even your competitors.
- ROI justification: Demonstrating improvements in the TSR can help you explain the return on investment (ROI) of UX initiatives to stakeholders, as it provides a quantifiable measure of the impact of design changes.
Time to Task Completion (TTC)
Time to Task Completion (TTC) measures the amount of time it takes for your user to complete a specific task or action within your application or website.
TTC is important because it can help you understand the usability and overall effectiveness of a particular design or feature as well as identify where your users might be experiencing difficulties. Other reasons you might want to measure TTC include:
- Usability evaluation: A shorter TTC indicates that users can accomplish their goals more quickly, suggesting that the interface is well-designed and user-friendly. A longer TTC may indicate usability issues, confusion, or complex interactions, requiring further investigation and potential redesign.
- Benchmarking: Comparing TTC values across different designs, competitors, or iterations will help you establish performance benchmarks and identify areas for improvement.
- Identifying pain points: Analyzing TTC might reveal problematic interactions or steps within a task, allowing your designers to address these issues and enhance the user experience.
- Assessing learnability: Measuring TTC over multiple attempts can provide you with insights into how quickly users can learn to use an interface or feature effectively.
User Error Rate (UER)
User Error Rate (UER) shows how often your users make mistakes while using a product, system, or interface.
It helps researchers and designers figure out which parts of the design are confusing or difficult for users, so they can make improvements and create a better experience.
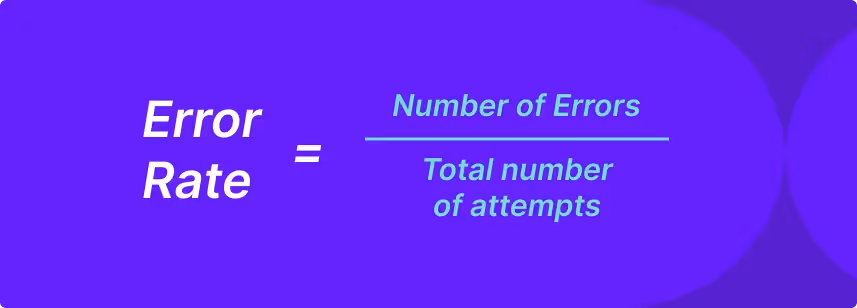
To calculate the UER, divide the total number of errors by all users by the total number of task attempts. To get a percentage, multiply this by 100.
Here are some reasons you might want to measure UER:
- Identify usability issues: UER can help you identify problem areas that can be confusing to users and cause them to make errors.
- Evaluate design effectiveness: By tracking your UER over time or comparing it across different designs, you can evaluate the effectiveness of design changes and iterations. A decrease in UER indicates that the modifications you made have improved user performance.
- Benchmark performance: You can also use UER as a benchmark to compare the usability of different products, systems, or interfaces to identify best practices and inform the design of future products.
- Inform training and documentation: A high UER might suggest that users need additional training or support materials to use your product effectively.
- Prioritize development resources: By measuring UER, you will identify and prioritize the areas where improvements are needed the most so you can allocate development resources more effectively.
Collect user insights with surveys
Great user experience is the cornerstone of any successful product, and measuring the six metrics and KPIs we presented in this article can help you cater to your users better.
Collecting user feedback via surveys is one of the easiest and most effective ways to find out what changes your users would like to see.
With Survicate, you can start for free: simply sign up for our 10-day free trial and select the survey you need from hundreds of templates. No more guesswork: start gathering user insights at every step of their journey.


.webp)
.webp)
.svg)

.svg)