
UX surveys are a crucial part of user experience research. They offer a line of communication between you and your users, providing insights into what's working well, what could be improved, and where opportunities for innovation lie.
In this blog post, we'll show you how to create effective UX surveys and explore their importance, benefits, and best practices.
Plus, we'll provide some UX survey templates so you can start collecting precious user feedback in no time at all.
What is a UX survey?
A UX survey is a research tool designed to gather feedback directly from users about their experiences with your product or service. It seeks to understand the user's experience—how easy or difficult it is for the user to interact with a product, whether it's a website, an app, or a particular feature.
UX surveys dive into the specifics of user interactions, asking questions about a wide range of usability factors, such as design, interface, or navigation. They're an essential tool for understanding how to provide better solutions. They enable the collection of data that is both qualitative (e.g., user opinions and suggestions) and quantitative (e.g., ratings for satisfaction or ease of use).
UX surveys are a crucial part of the broader UX research methods. They help you:
- Validate design decisions
- Identify pain points in user journeys.
- Gather feature-specific feedback to inform development priorities.

Why are UX surveys important?
A good UX can make or break a product, so the importance of UX surveys cannot be overstated. As a part of user research, they provide actionable insights that can drive product development.
Since they're easy to run, they're an incredibly cost-effective way to gather user feedback.
By understanding how users perceive and interact with a product or service, you can
- identify the pain points your users face
- prioritize design improvements based on the problems you identified
- stay user-centric by constantly collecting and incorporating user feedback
- reduce churn and increase user retention by proactively finding and fixing issues
- increase conversions and improve overall business performance by learning what stops your customers from making a purchase
- boost user engagement by understanding what captures your users' attention
To get the most out of your user experience surveys, it's always a good idea to use a tool that will automate the distribution process, helping you to reach a large number of users quickly and efficiently.
Survicate, for instance, allows you to set up surveys once and enjoy continuous feedback. Plus, you can run surveys at any point across the user journey.
UX survey templates
User experience surveys come in different forms, each with its specific purpose and application. By signing up for a survey tool such as Survicate, you can use such surveys straight away.
Usability Metric for User Experience (UMUX)
This standardized UMUX Lite survey template uses a 5-point scale to rate various aspects of user experience with your website or product, including ease of use, usefulness, and satisfaction.
The UMUX Lite consists of concise and easy-to-answer survey questions. It will give you a good idea of what's working and what's not so you can make the necessary tweaks and changes to make your users happier.
To interpret the results, start by calculating the average score for each statement. For instance, if 10 participants responded to the survey and rated a statement with scores of 4, 4, 5, 3, 5, 4, 5, 3, 4, and 5, then the average score would be 4.2.
Once you've worked out the average score for each statement, you can interpret the results based on the scale used. Usually, an average score of 4 or above indicates good usability and a positive user experience, while an average score below 4 indicates room for improvement.
Customer Effort Score (or User Effort Score)
A variation of the Customer Effort Score survey, the User Effort Score (UES), measures how easy or difficult it is for users to interact with your product or service.
It consists of a simple 5-point Likert scale and a follow-up question that asks the user to elaborate on their choice.
There is a strong correlation between user effort and loyalty. Users who can accomplish tasks easily are more likely to be satisfied and continue using your product or service, while those who have to exert high effort are more likely to switch to a competitor.
Net Promoter Score survey
A Net Promoter Score (NPS) survey measures customer loyalty by asking how likely they are to recommend your product or service to others on a scale of 0-10. Respondents are categorized as Promoters (9-10), Passives (7-8), or Detractors (0-6). Your NPS is calculated by subtracting the percentage of Detractors from the percentage of Promoters.
NPS surveys provide valuable insights into the strength of your customer relationships and overall user experience. They are short and simple, typically including the key question:
"How likely are you to recommend [product/service] to a friend or colleague?"
To interpret the results, first calculate your NPS by subtracting the percentage of detractors from the percentage of promoters. For example, if 60% are Promoters, 20% are Passives, and 20% are Detractors, your NPS would be 40 (60% - 20% = 40%).
An NPS above 0 is considered good, above 20 is favorable, above 50 is excellent, and above 80 is world-class. However, scores vary by industry, so it's best to benchmark your NPS against competitors. Tracking your NPS over time will help you gauge improvements in customer loyalty and identify areas of your user experience to optimize.

Customer satisfaction surveys
Customer satisfaction (CSAT) surveys measure user satisfaction with your product, service, or specific features. They typically ask users to rate their satisfaction on a scale of 1-5 or 1-10, with higher scores indicating greater satisfaction.
CSAT surveys are versatile and can be used at various customer journey touchpoints, such as after a purchase, during customer support interactions, or key product experiences. They provide actionable insights into what you're doing well and where you need to improve.
To interpret the results, calculate the percentage of satisfied customers (those who gave a rating above a certain threshold, such as 4 on a 5-point scale). For example, if 100 users completed the survey and 80 gave a rating of 4 or 5, your CSAT score would be 80%.
A good CSAT score varies by industry, but a score of 75% or higher is generally considered good. However, it's more important to track your CSAT score over time and aim for continuous improvement.
Standardized User Experience Percentile Rank Questionnaire (SUPR-Q UX)
SUPR-Q survey is used to measure the quality of users' experience with a website or app and identify key areas for improvement.
As a standardized survey, it allows you to compare your results to a database of scores from hundreds of other websites. This gives you an idea of how your website or app stacks up against others.
SUPR-Q has been academically validated, which means you can trust the results it produces.
Qualitative surveys with open-ended questions
Qualitative surveys allow users to provide detailed, open-ended responses about their experiences, opinions, and suggestions. Unlike closed-ended questions that limit responses to predefined options, open-ended questions give users the freedom to express themselves in their own words.
Open-ended questions are particularly useful in rich, qualitative research that can help you understand the "why" behind user behaviors and preferences. They can uncover user friction points, motivations, and ideas for improvement that you might not have discovered with closed-ended questions alone.
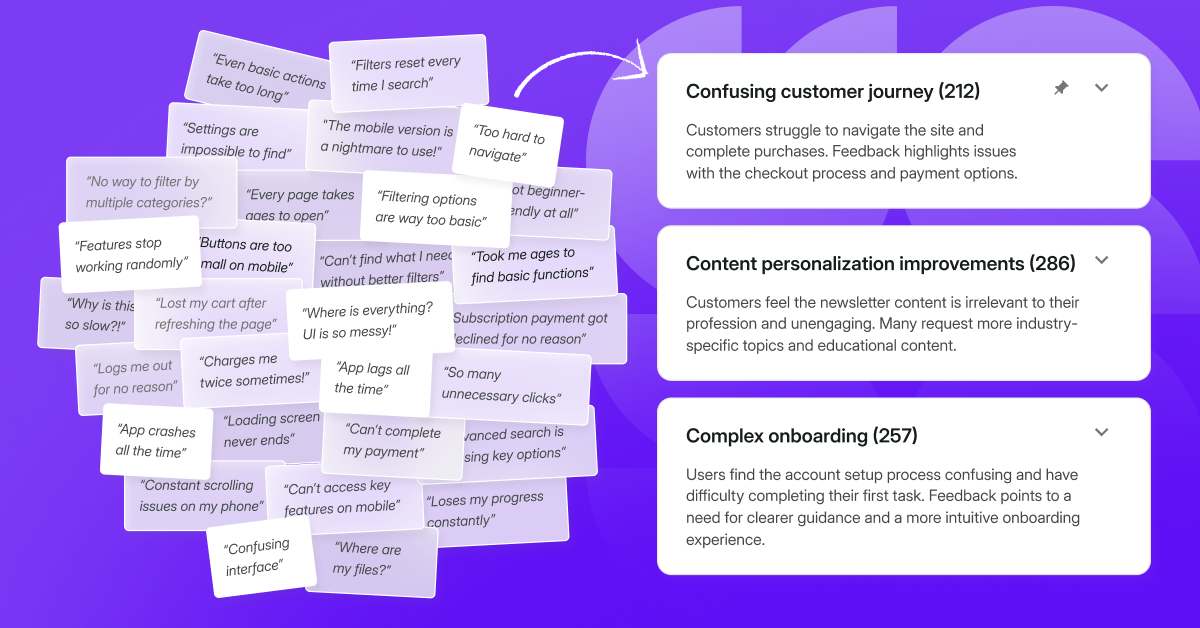
When analyzing the results of open-ended survey questions, look for common themes and patterns in the responses. Use tools that facilitate the analysis of qualitative data, for example Survicate. Its AI-powered customer analytics module, Research Hub, automatically categorizes your raw data into topics, allowing you to grasp the general feedback trends and sentiment quickly.
For additional feedback or more in-depth insights, you can use the Research Assistant, a chat-based tool that will answer all your questions regarding the data you collected.
🎁 Bonus: Why stop at surveys while conducting user research? Connect multiple sources of qualitative feedback to Research Hub, including online reviews, video calls, user interviews, users' interactions with customer support, and—of course—surveys.
Quantitative surveys with closed questions
Quantitative surveys with closed questions provide a structured way to collect data by asking users to select from a predefined set of answers. These questions can be in various formats, such as multiple-choice, rating scales, or Likert scales, and they allow you to collect accurate data that is easy to analyze and interpret.
Closed survey questions are best suited for gathering specific, measurable data about user behaviors, preferences, and satisfaction levels. They are ideal when you have a clear understanding of the potential responses and want to quantify the results.
One of the main advantages of closed questions is that they are quick and easy for users to answer, which can lead to higher response rates and more complete data sets. The standardized response options also make it easier to compare and analyze the results across different user segments or over time.
When designing such questions, it's important to ensure that the response options are clear, mutually exclusive, and exhaustive. You should also consider including an "Other" option with a text field for users to provide additional details if needed.
While closed questions are valuable for gathering quantitative data, they don't provide the same depth of insight as open-ended questions. Therefore, it's often best to use a combination of both question types in your UX surveys to gain a comprehensive understanding of the user experience.
When should you send UX surveys?
The timing of your UX surveys can be critical and it varies depending on your specific objectives. Here are some situations when you should consider sending a UX survey.
During product development
If you're in the process of developing a new product or feature, it might be beneficial to send out a UX survey to gather insights and feedback. This can help you ensure that the final product aligns with user expectations and needs.
After major updates
Whenever you release a significant update, redesign, or new features, it's a good idea to send out a survey. This will help you understand how users are responding to these changes and whether they're finding them beneficial.
Periodically for benchmarking
Sending out regular UX surveys can help you track how user satisfaction changes over time. This is particularly useful for identifying trends, gauging the impact of changes, and benchmarking your performance against industry standards.
After an interaction
Send a survey immediately after a user interacts with your product or service, for instance, following a purchase, an interaction with your customer service, or completing a specific task on your site or app. The feedback they will provide will often be more accurate and detailed because the experience is fresh in their mind.
When the churn rate increases
If you notice that your user churn rate is increasing or user engagement is decreasing, it's time to send out a UX survey. This can help identify any usability issues or areas of dissatisfaction that are driving users away.
Before a major update
If you're considering a significant change or decision related to your product or service, sending a UX survey can provide valuable insights that inform your decision-making process.
Whenever you decide to run a UX survey, remember to thank your users for taking the time to fill it in.
Best practices for creating effective UX surveys
Creating effective UX surveys is an art that involves striking a balance between asking the right questions and respecting the respondent's time and effort. Here are some best practices to consider when creating UX surveys.
Defining clear objectives
What exactly do you wish to learn from the responses? Are you trying to understand the user experience on your website, gauge user satisfaction with a product, or gain insights into why users are abandoning their shopping carts? Defining clear objectives at the onset ensures that your survey is aligned with your goals, and provides a roadmap for designing your survey questions.
Crafting relevant and concise questions
Once you've defined your objectives, it's time to craft your survey questions. The questions should be directly aligned with your objectives, and as specific as possible to yield actionable insights. Your respondents should be able to understand the questions easily without having to guess what's being asked.
To make sure your questions provide you with the data you need, it’s a good idea to use a survey tool that offers templates optimized for a satisfactory response rate, such as Survicate.
Mixing up question types
While crafting your survey, consider using a mix of question types to keep the survey engaging and collect different types of data. For instance, closed-ended questions such as multiple choice or Likert scale questions can provide quantitative data that's easy to analyze and compare. On the other hand, open-ended questions allow users to express their thoughts freely, providing valuable qualitative insights.
For instance, Survicate’s Voice of Customer survey template consists of a series of questions of different types, such as the standard NPS rating-scale question, a Likert scale, and an open-ended question that aims to collect qualitative responses. You can modify the template to suit your needs:
Prioritizing user anonymity
To get honest and unfiltered feedback, you need to assure your users that their responses will be anonymous and used solely for the purpose of improving user experience.
Keeping it short and simple
User time is precious, and long surveys can feel overwhelming or boring, leading to higher dropout rates and survey fatigue. Aim to keep your survey short and simple, preferably under 10 minutes to complete. Every question you include should serve a purpose. If it doesn't directly relate to your objectives, it's probably best to leave it out.
One way to ensure that all survey questions are relevant to the respondents is by using skip logic. This is a mechanism that allows for designing a survey in a way that previous answers impact what questions follow.
Ordering questions logically
The order of questions in your survey can impact the responses you get. It's usually best to start with general questions and gradually move to more specific ones.
Warm up respondents with simple and less personal questions before moving on to more complex or sensitive topics. This can help to build rapport and increase the completion rate of the survey.
Providing an incentive
Although not always necessary, providing a small survey incentive can boost survey completion rates. This could be a discount, access to premium content, or entry into a prize draw. It serves as a token of appreciation for the user's time and effort.
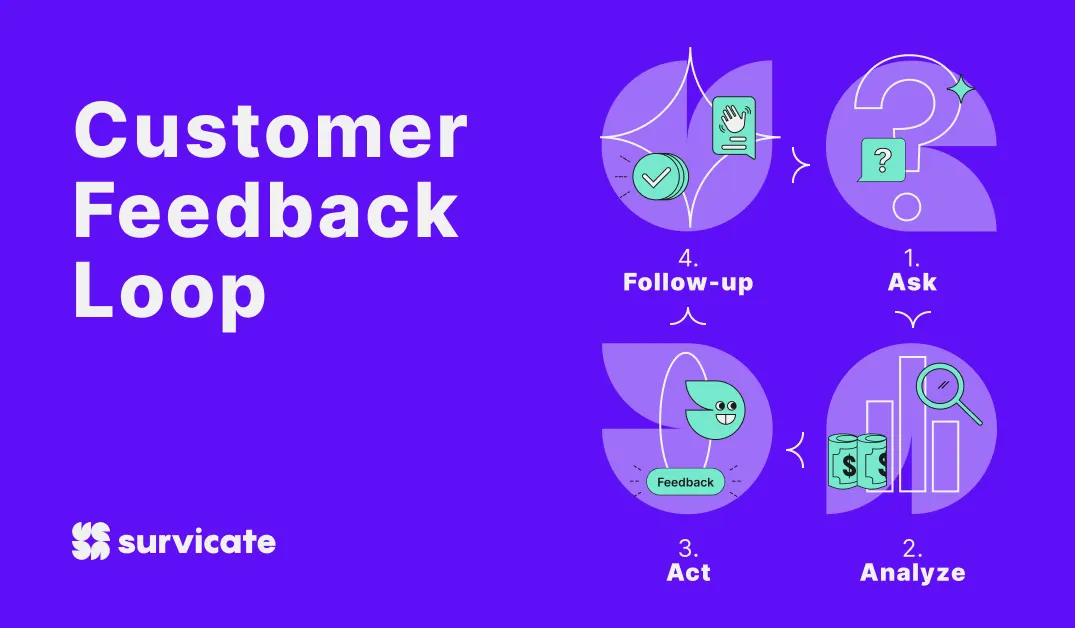
Analyzing and acting on the data
Now, the real work begins—analyzing the survey response data. Look for trends, patterns, and outliers in the responses. What are users saying about their experience? What areas of your product or service need improvement? This is the time to interpret the data and translate it into actionable insights.
However, the process doesn't end there. The real value of a UX survey lies in how you use the insights to improve the user experience. Share the results and your analysis with your team, and use the feedback to inform your decision-making process. It's also important to close the feedback loop with your respondents by letting them know that their feedback was valuable and is being used to make improvements.
How to use Survicate to send UX surveys
UX surveys open the door to understanding user behavior, identifying pain points, and gathering actionable insights that can shape your product or service.
To start exploring your user experience with UX surveys, simply sign up for a 10-day free trial account and pick from over 400 ready-to-use templates.
With Survicate, you can also connect with your favorite third-party tool to seamlessly share the data and analyze your results in one place. Keep testing, iterating, and delighting your users with Survicate!


.svg)

.svg)