Understanding your users is at the heart of an effective user experience (UX) design. To gather meaningful data, one of the best tools at your disposal is a well-crafted UX survey.
In this blog post, we'll show you 15 carefully designed survey questions proven to unlock valuable user feedback. Combined with ready-to-use templates, these surveys will help you uncover a wide range of insights, from website usability to feature requests.

What is a UX survey?
A user experience (UX) survey is one of the most popular UX research methods used to understand users' perceptions, preferences, and experiences while interacting with a product or service.
It typically consists of a set of questions designed to collect specific information related to the user experience.
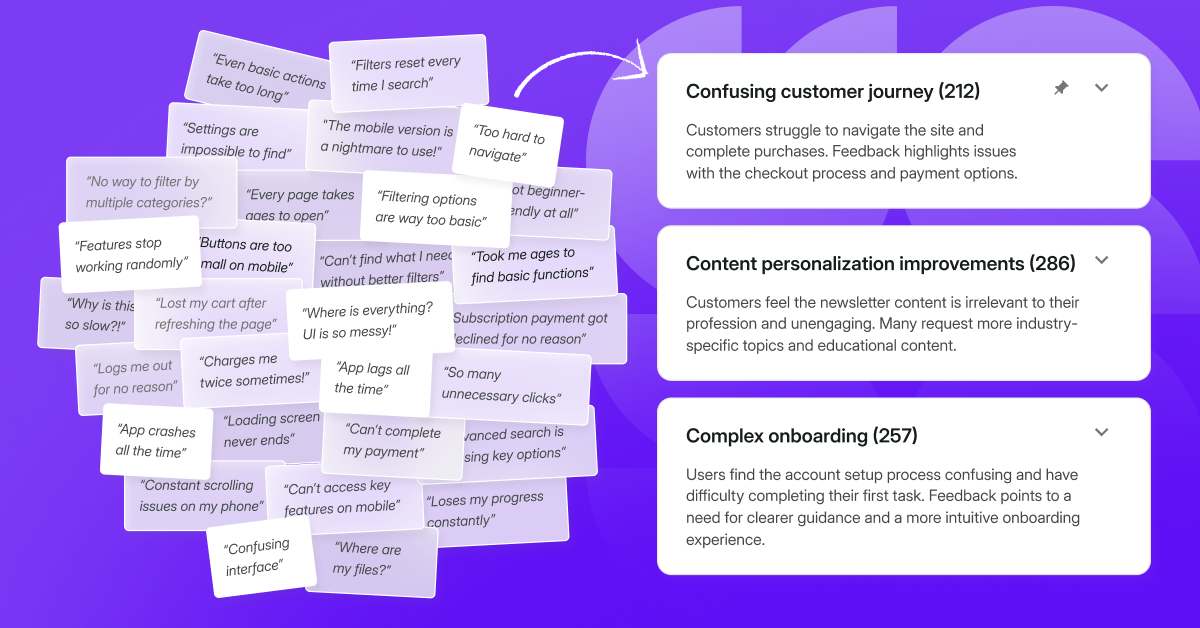
UX surveys can help you gather insights about a variety of factors, including the usability of a product, users' satisfaction levels, potential areas of improvement, and barriers users might be experiencing.
The questions can be qualitative (open-ended, allowing users to freely express their views) or quantitative (closed-ended, offering a range of preset answers for statistical analysis).
The primary goal of a UX survey is to enable designers and developers to improve the overall user experience by making data-driven decisions based on users' feedback. By understanding what works well and what doesn't, teams can make adjustments that make their products more intuitive, enjoyable, and effective for their users.
Top 15 UX survey templates
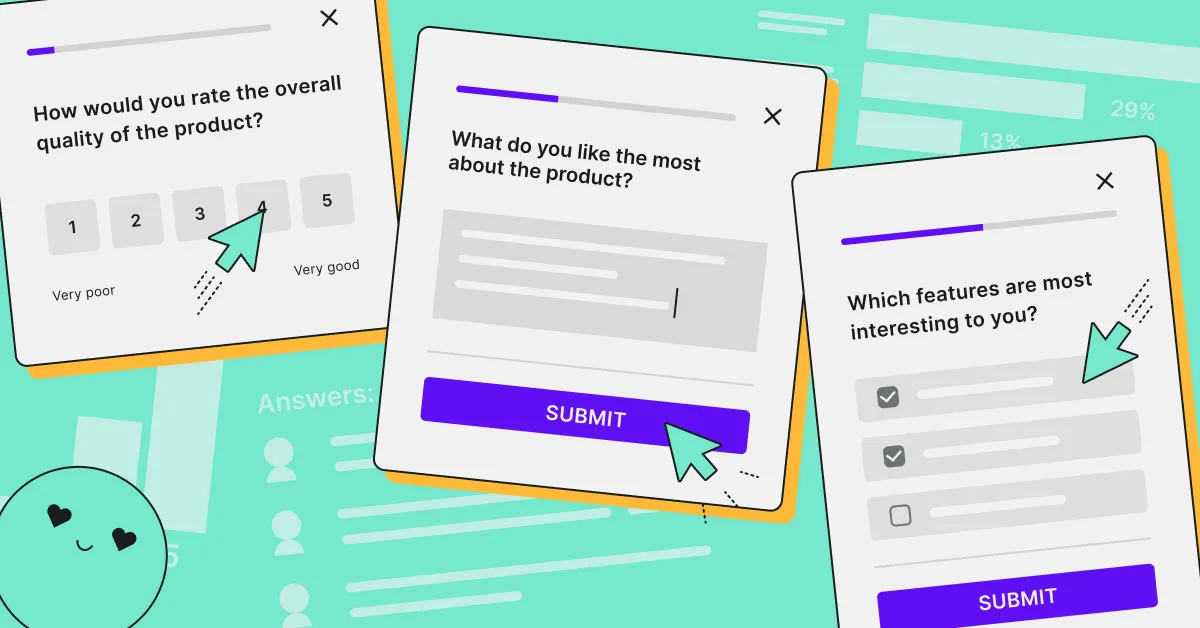
To help you gather actionable user insights, we’ve created this list of 15 UX survey templates, complete with templates that can be added to your UX research plan and deployed in minutes.
The templates cover a wide spectrum of user experience aspects, from overall satisfaction and usability to specific elements like navigation and content quality. Each template is designed to elicit clear, actionable responses, allowing you to pinpoint areas of success and opportunities for improvement.
Remember, the best UX surveys are those that are concise yet comprehensive, easy to understand, and sensitive to the user's time. The templates below are designed with these principles in mind, enabling you to gather meaningful data with minimal user effort.
This website's/product's/tool's capabilities meet my requirements (UMUX survey)
The Usability Metric for User Experience (UMUX) is a standardized qualitative survey that offers a shorter alternative to the 10-question SUS questionnaire.
The UMUX survey aims to measure how easy or difficult it is for users to interact with a website, app, or other digital product.
It typically consists of a series of questions about different aspects of the user experience, including navigation, design, and functionality. The questions are designed to be simple and straightforward, and they can be customized to suit your specific needs.
How easy was it to complete your task on our website/app? (CES survey)
The Customer Effort Score is a powerful and hugely popular UX metric that can help you measure how much effort your customers put into interactions with your company.
The CES survey is a transactional questionnaire, meaning you should deploy it after specific interactions or customer journey touchpoints. Your customer should see it right after, for instance, a conversation with customer support, the use of a new feature, or a finalized purchase.
To calculate your CES, divide the total sum of your CES scores by the total number of responses. For example, if you received 100 answers and got a total score of 400, your CES would be 8.
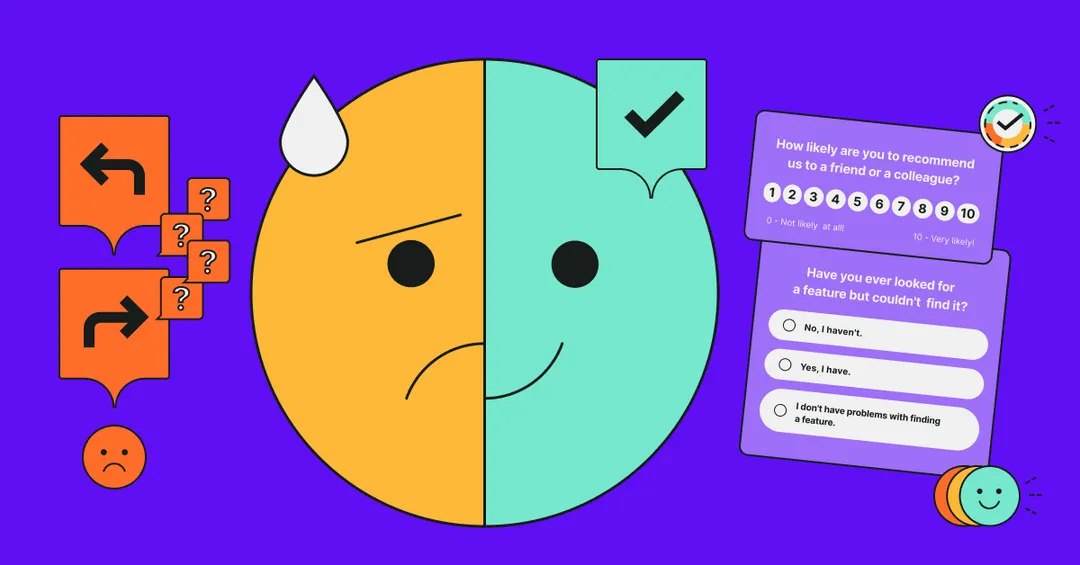
How likely are you to recommend our product/service to a friend or colleague? (NPS survey)
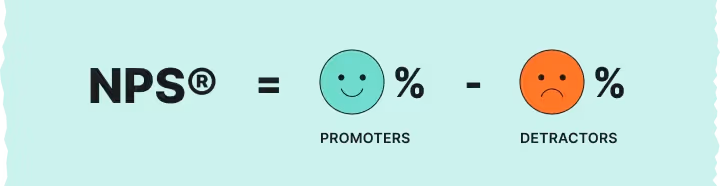
One of the most widely used surveys, the Net Promoter Score (NPS) measures how satisfied your customers are with your product or service and how likely they are to recommend it to others.
It consists of a simple question:
“How likely is it that you would recommend this company to a friend or colleague?”
Respondents are presented with a rating scale of 0 to 10, and based on their score, they’re classified as Promoters, Passives, or Detractors.
To calculate Net Promoter Score, you need to subtract the percentage of your NPS Detractors from the percentage of your Promoters.
However, NPS is more than a metric—it’s a way of doing business. It can inspire your company to adopt a customer-centric culture to guide the entire way you do business.
Is our pricing clear to you?
This simple survey can help you collect user feedback on how clear your pricing plans are.
Creating the right pricing model is an art that might take a few attempts. During this process, user insights play a crucial role in driving your decisions.
By making sure your pricing policy is transparent and understandable to your users, you’ll increase conversion rates and boost user acquisition and retention.
The SUPR-Q survey
The SUPR-Q is a standardized survey that consists of 8 short questions. Users respond to the first 7 questions using a 5-point Likert scale. The last question is a standard NPS question.
While some questions in a SUPR-Q survey measure usability, others refer to aspects such as loyalty or appearance. The survey looks at the holistic experiences of and attitudes toward your product and is not limited to usability:
- The website is easy to use.
- The website is easy to navigate.
- The information on the website is credible.
- The information on the website is trustworthy.
- I find the website to be attractive.
- The website has a clean and simple presentation.
- I will likely return to the website in the future.
- How likely are you to recommend this website to a friend or colleague?
How would you rate your most recent interaction with customer service?
Keeping track of your users’ interactions with your customer service will go a long way toward improving customer lifetime value, boosting sales, and building a positive brand image.
This customer service team evaluation survey should be sent to customers after they've interacted with your frontline teams to help you stay on top of the quality of service.
On top of measuring satisfaction with your customer support, the survey can also help you identify any problem areas and prevent any issues from escalating.
How satisfied are you with your subscription to [product name]?
Subscription plans require careful attention, as even slight changes to pricing can drive your users away.
With this survey, you can monitor your customers’ satisfaction with the pricing plan and gather their thoughts on any improvements they’d like to see. It’ll also help you prevent customer churn, build a loyal customer base, and tackle any issues that might lead your users to canceling their plans.
How satisfied are you with [product name]? (CSAT survey)
Another hugely popular metric, the Customer Satisfaction Score (CSAT) asks respondents to rate their satisfaction with your company or a particular product/service you offer on a 1-to-5 scale.
The first rating question is often followed by an additional open-ended question which usually asks the respondents to elaborate on their score.
To calculate your CSAT, simply divide the number of respondents who chose four or five on the scale by the total number of respondents.
Once you know your score, you can benchmark and track it over time as well as observe any patterns in the answers to the open-ended questions.
Rate product features in terms of importance
A product features matrix is a survey that allows you to collect data on the features that are most important to your users.
Asking your users to rank specific features in order of importance might help you to make data-driven decisions about improving your product and provide the best possible user experience.
Which of the features should we build first?
The feature prioritization survey aims to involve your users in building a product roadmap.
This short poll asks your respondents to pick the features they’d prioritize and justify why they are important to them.
Thanks to the survey, you’ll gain additional evidence to validate your product development choices and create alignment across your team.
What would you expect to be able to do with [...] feature?
At times, unclear in-product copy can lead to poor user experience and even churn. To make sure your development team and your users are on the same page, simply run a survey that validates the names of your new features with your users.
What is the goal of your visit to our website today?
The purpose of this survey is to understand why users are visiting your website and what they hope to achieve during their visit.
By knowing what users are looking for, you can ensure that the content on your website is relevant and aligns with the needs of your audience. It can also help you verify whether you attract the right traffic.
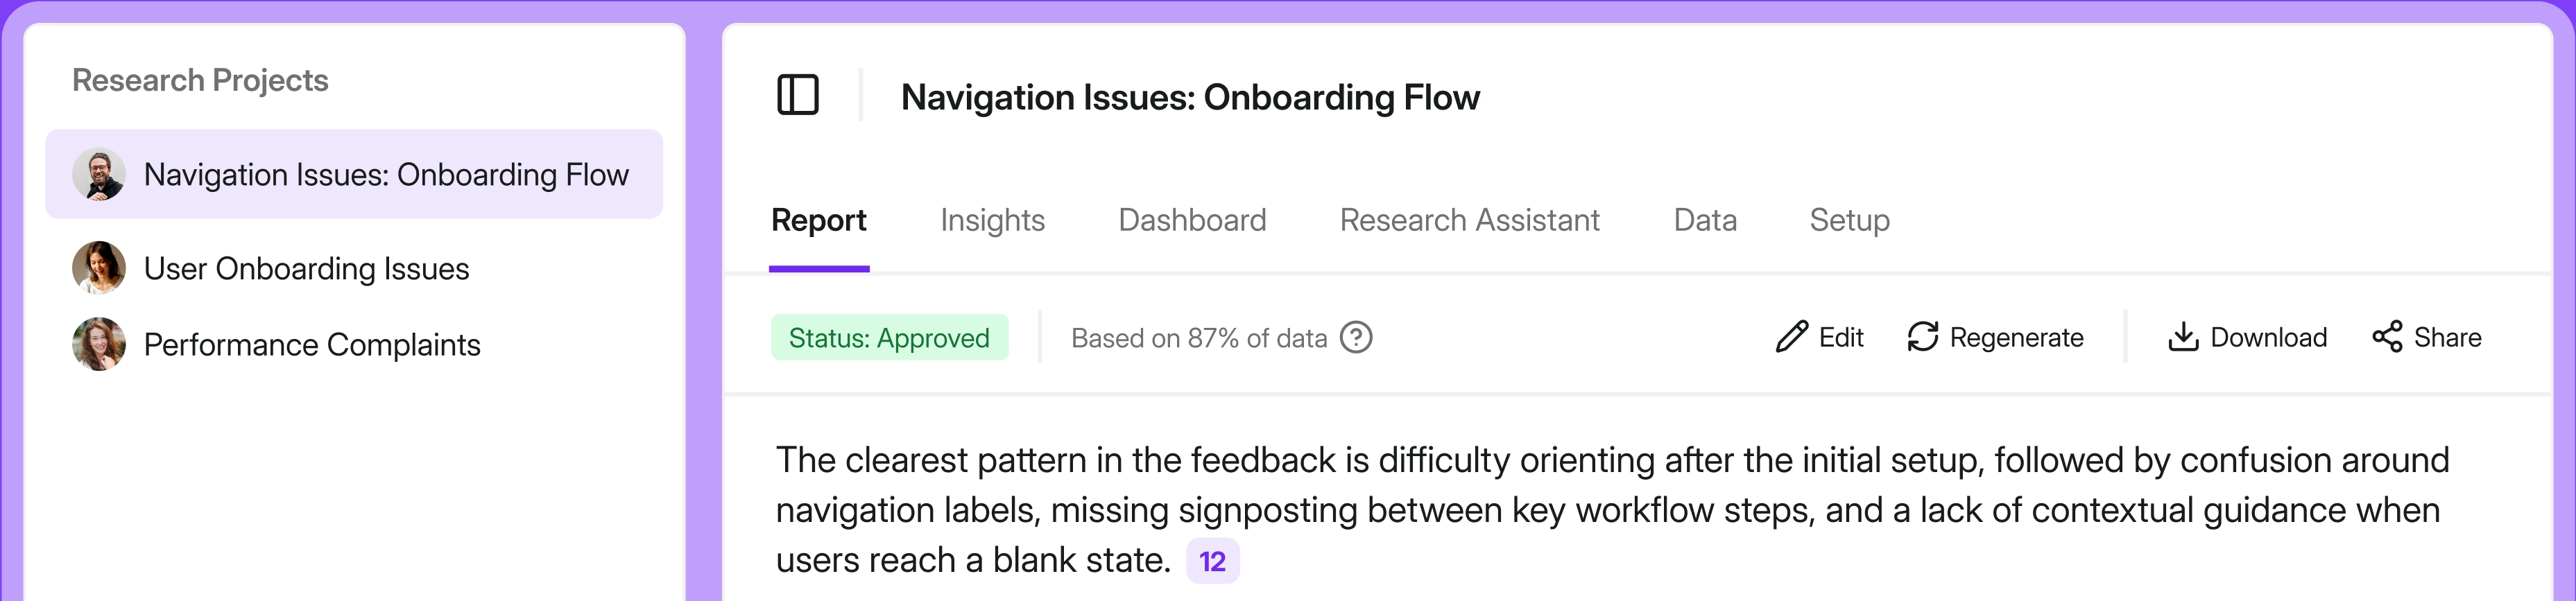
If many users are visiting with a specific goal but then leaving without completing their task, it may indicate that the website's design or navigation is not intuitive or user-friendly.
Responses to this question can guide website improvements, help prioritize new features or content, and improve overall user experience.
How happy are you with the search results?
Satisfaction with search results is a significant aspect of user experience. If users are consistently unsatisfied, it could result in a worse overall user experience, which might make users less likely to return to your website or application.
Users' dissatisfaction might not always stem from the search functionality itself; it could also be due to the lack of relevant content.
By asking this question, you can gain valuable insights to enhance the search functionality and the content on your platform.
It’s also helpful to follow up with an open-ended question such as "What can we do to improve your search experience?" to gain more specific feedback and actionable insights.
How easy or difficult was it for you to find the information you were looking for?
The goal of this survey is to understand the ease of navigation and the effectiveness of the site's design and information architecture.
By triggering this questionnaire at critical touchpoints on your website, you can discover how easy it is for visitors to find what they came for.
If users find it difficult to locate the information they need, it could be an indication that the website or app's navigation and overall design may need improvement. This can lead to frustration and reduced user satisfaction, which can in turn affect user retention and engagement.
Why did you decide to leave our site?
A website exit survey is a type of web survey that pops up when a visitor is about to leave your website.
By understanding why users are leaving your site, you can take steps to address the underlying issues and improve your site's overall performance and conversion rates.
However, not all exits are negative. Users might leave because they found exactly what they needed and completed their intended action.
This survey can be a great addition to other analytics tools as you dig into your bounce and conversion rates.
Automate your UX surveys with Survicate
Crafting impactful UX survey questions is a significant step towards understanding your users better and optimizing their experience.
However, the process doesn't stop there. To fully harness the power of your UX surveys, consider automating them with Survicate.
Our user-friendly, intuitive tool allows you to schedule and distribute your surveys seamlessly, analyze results in real time, and even integrate natively with other platforms you might be using. Sign up for free and take your UX research to the next level.


.webp)
.webp)
.svg)

.svg)