
Your NPS data has come in and you’re ready to get your teeth into the analysis. But how do you get started?
As you’ll soon find out, collecting NPS data is just half the success. Luckily, in this blog post you will find plenty of actionable tips to get started with creating your NPS report.
Read on for best practices for organizing, analyzing, and implementing your NPS report findings.
The benefits of creating an NPS report
One of the primary benefits of creating an NPS report is to showcase the customer insights you collected with your NPS survey and draw relevant conclusions to inform your strategies.
By analyzing customer feedback, you can identify trends and patterns in their responses, which will help you understand what they value most about your offerings, as well as areas that may require improvement.
.png)
An NPS report will also enable you to benchmark your performance against industry standards and particular competitors. By comparing your NPS to those of similar businesses, you can identify strengths and weaknesses, set realistic goals, and develop a roadmap for improvement.
What’s more, creating regular NPS reports encourages a culture of continuous improvement within your organization, fosters accountability, and encourages employees to take ownership of their impact on the customer experience.
Lastly, by presenting the findings of your NPS survey as a report and acting upon it you’ll be contributing to long-term, sustainable business growth.
Below, you will find some practical tips on how to create your NPS report step by step.
Collect data for your NPS report
To create an effective NPS report, you must first gather your NPS data.
You can send out the NPS survey via different channels, depending on the nature of your product or service, including email, text message, mobile app, or have it display as a website pop-up survey.
With Survicate, you can send your NPS survey using any of those channels. Simply click on the “Use this template” button below this NPS template to start the process.
Analyze and organize your NPS data
Once you’ve collected the results, calculate your NPS score. You can find more information on how to do so in our blog posts:
- Net Promoter Score: What Is It and How to Calculate It
- How to Create a Net Promoter Score (NPS) Survey?
- Measure NPS Right: 10 Common Mistakes People Make When Measuring NPS
- NPS Analysis: Comprehensive Walkthrough of NPS Data
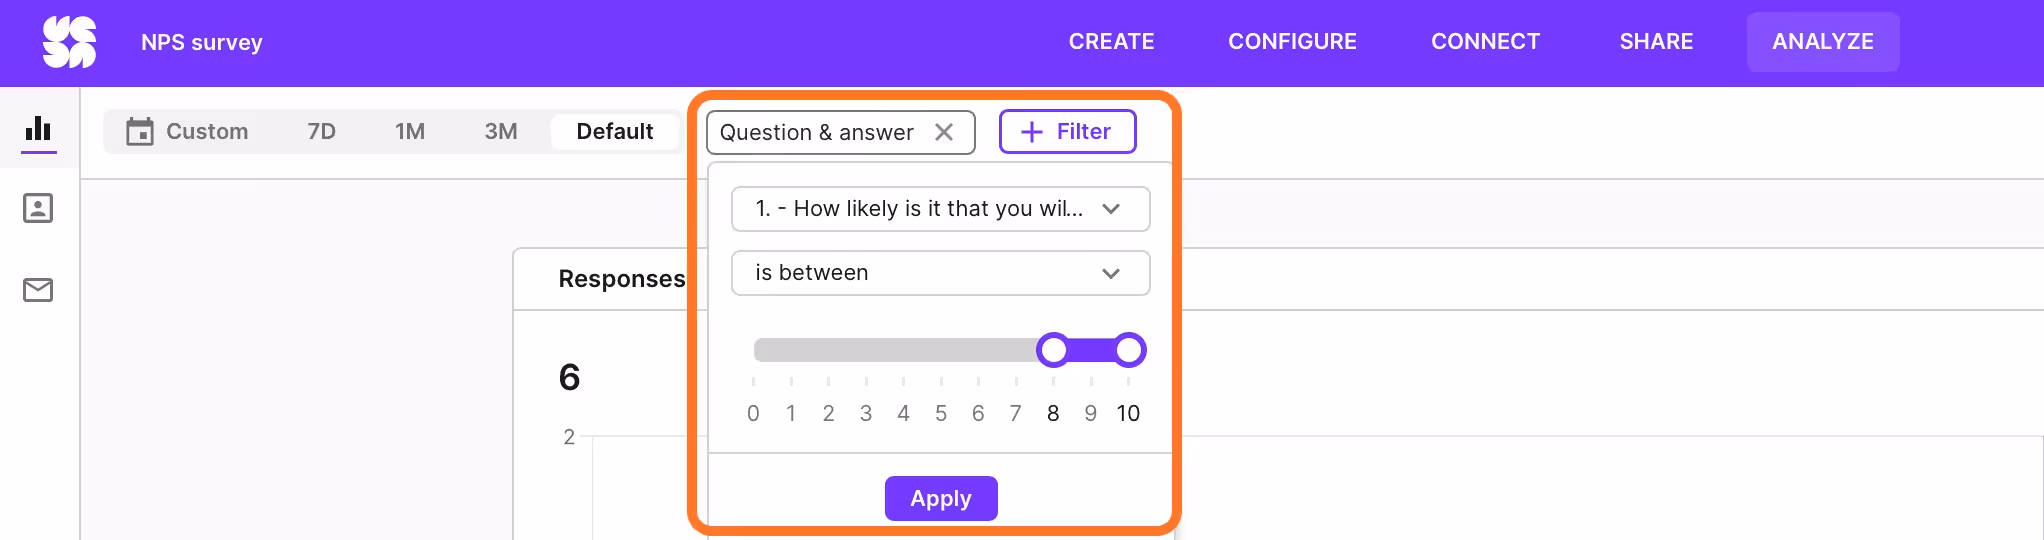
Segment your customer responses based on relevant criteria, such as demographics, purchase history, or customer lifecycle stage. This will allow you to analyze the data more effectively and identify trends or patterns.
In the next step, you can analyze the responses to identify key drivers of customer satisfaction and dissatisfaction.
This can be done through open-ended follow-up questions or by correlating NPS scores with other customer data.
Remember that with Survicate you can also add a follow-up question to the original NPS survey. Simply use the template below to get your respondents to elaborate on their scores:
Make sure the survey tool you are using can also track your NPS score over time to compare it to previous periods and measure the impact of your improvement efforts.
Visualize data for the NPS report
An effective NPS report should present the data in a clear, concise, and visually appealing way. Below you’ll find some popular data visualization options.
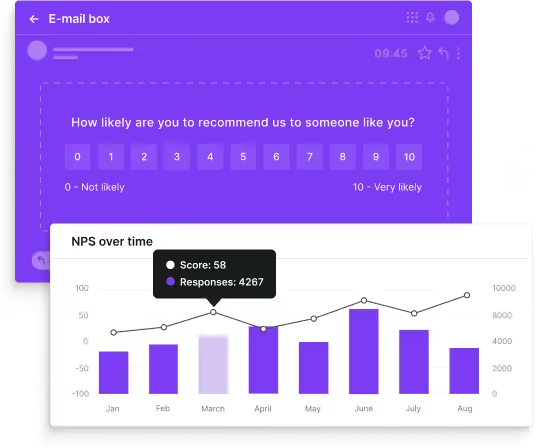
Bar charts
Create a horizontal or vertical bar chart with scores on the x-axis (0 to 10) and the number or percentage of respondents on the y-axis. Each bar represents the number or percentage of respondents who gave that particular score.
You can also use the chart to display the overall distribution of scores among Promoters, Pasives, and Detractors as well as to display NPS data over time.
Heatmaps
Heatmaps can provide a visually appealing and easily interpretable representation of customer sentiment across various dimensions, such as time, segments, or even individual customer interactions.
Word clouds
The word cloud feature is a great way to display the most commonly mentioned words in the answers.
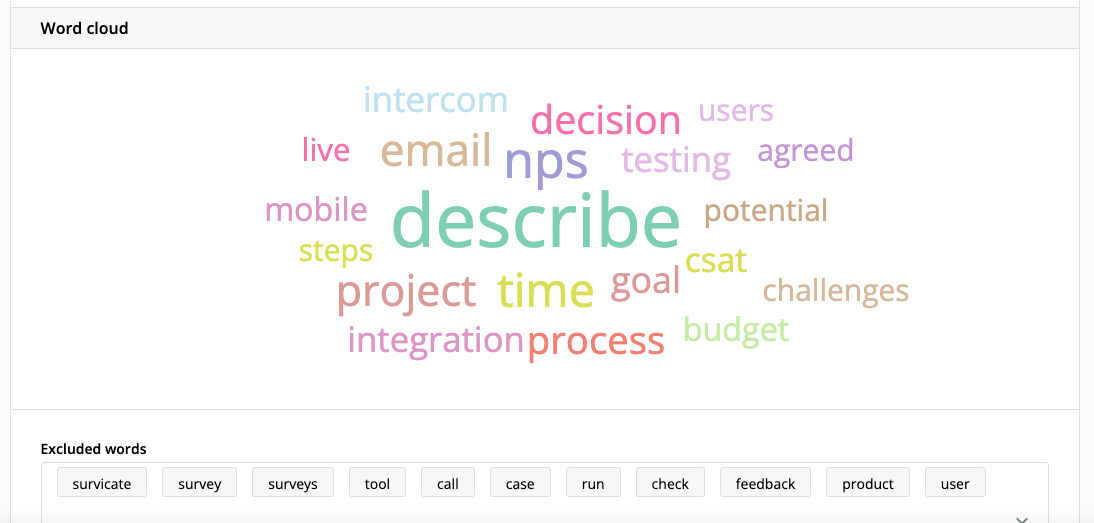
The more often a word appears in the text answers, the bigger it will be in the cloud.
With Survicate, you can easily see who submitted a particular response and filter the results to see a word cloud relevant for a selected group, for instance, your NPS Promoters:
Writing the NPS Report
Once you have analyzed and visualized the data, it's time to compile the information into a comprehensive NPS report.
How to structure your NPS report
Consider including the following sections in your report:
- Executive summary: Provide a high-level overview of the NPS findings, including the overall score, trends, and key insights.
- Methodology: Explain the methodology used for collecting and analyzing the data, including the survey tool, audience, distribution methods, and timeframe.
- Detailed findings: Present detailed findings of the report, including the distribution of promoters, passives, and detractors, segmented data, key drivers, and NPS trends over time. Use visuals to support your findings and make them easy to understand.
- Recommendations: Based on your analysis, provide recommendations for improvement. These recommendations should be specific, actionable, and supported by the data.
- Conclusion: Summarize the key findings and recommendations of the report, and reiterate the importance of the NPS as a valuable metric for tracking customer satisfaction and loyalty.
Pick NPS reporting frequency and time frame
You can create NPS reports at different frequencies, for instance weekly, monthly, or quarterly, depending on your organization's needs and resources.
Remember to choose a realistic time frame that allows you to monitor your progress effectively and provides enough data to make informed decisions.
As too much data often leads to analysis paralysis, while too little data might not give you the insights you need. You also need to take into account that, for NPS reports to fulfill their purpose, they need to acted upon, not merely generated.
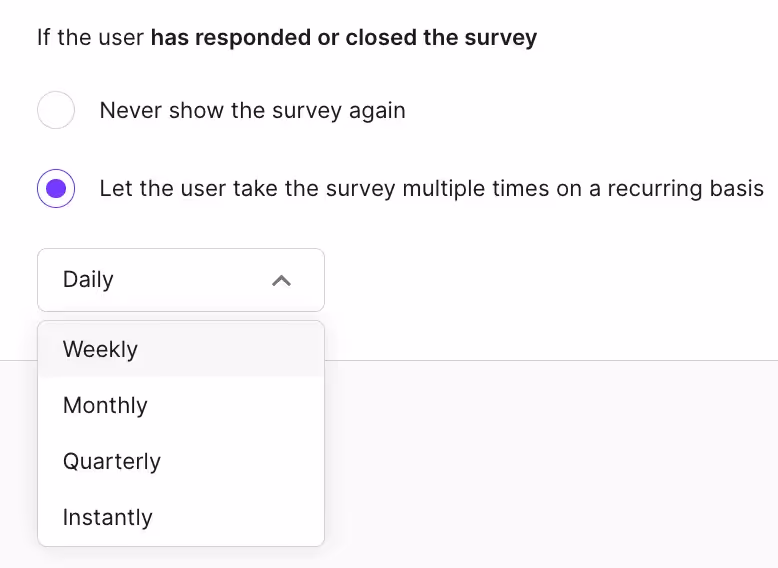
The frequency of reporting will also largely depend on how often you run your NPS surveys.
Survicate allows you to set up recurring NPS surveys to track your NPS data over time at regular intervals. This means you will be able to automate a huge chunk of the process and save plenty of time.
Implementing NPS report recommendations
An NPS report is only as valuable as the actions you take based on its findings. To maximize the impact of your NPS report, follow these steps:
- Prioritize recommendations: Based on the findings of your NPS report, prioritize the recommendations for improvement. Consider factors such as potential impact, cost, feasibility, and the availability of resources.
- Develop an action plan: Create a detailed action plan outlining the steps needed to implement each recommendation, along with timelines and resources required.
- Assign responsibility: Assign specific individuals or teams to be responsible for implementing each recommendation, ensuring accountability and ownership. For instance, if you find that your respondents cited poor customer service as the reason for their scores, you could invest in extra training for your reps.
- Monitor progress: Regularly track the progress of the action plan, and adjust as needed based on new insights or changing circumstances.
- Measure impact: Continuously measure the impact of your improvement efforts on your NPS, as well as other relevant customer satisfaction and business metrics. Remember that to see a sustained improvement in your score, you need to measure NPS regularly as one-off initiatives will not yield satisfactory results.
You might find that running NPS surveys alone is not enough to get a full picture of your customers’ satisfaction. That is why at Survicate we offer a wide range of ready-to-use surveys that will provide you with all the feedback you need to grow your business.
One of the most popular ways to measure customer satisfaction is to use the Customer Satisfaction Score (CSAT) survey:
Create an NPS report with Survicate
A good survey tool will help you not only run your NPS survey but also create a digestible and visually attractive report.
With Survicate, you can see the most common topics mentioned in the NPS survey on the automatically generated word cloud as well as filter your NPS survey data based on questions, date, and custom properties, to name a few factors.
With these and plenty more automation features, you’ll be able to create your NPS reports in no time and focus on taking action instead.
Ready to get started? Sign up to launch your Survicate account.


.svg)

.svg)