
It is notoriously difficult to compare NPS across global markets. Is a lower score in Germany a sign of poor service, or just a reflection of a more critical culture?
This report answers that (and other questions) by analyzing hundreds of survey-language records from over 100 companies to reveal how language and culture shape customer feedback.
By treating each language as its own unique benchmark, you stop comparing apples to oranges. Understanding these regional "fingerprints" allows for a more nuanced look at global performance, ensuring that teams are measured against realistic, culturally-aware standards rather than a single, skewed global average.
Methodology
In this report, we analyzed 504 multi-lingual records, from 264 unique surveys conducted by 108 companies. Each record represents a survey in a specific language version, meaning that one survey can appear multiple times if it was shown in multiple languages. This approach enables a more accurate comparison of NPS across language groups.
The term “language” that we use throughout refers to the language in which the survey was presented to the respondent, not the respondent’s geographic location.
Here’s exactly how we approached the analysis to keep the data both reliable and comparable across languages:
- We limited the dataset to surveys conducted throughout the full 2025 calendar year. This keeps the benchmarks current and avoids mixing in outdated response patterns.
- We only analyzed surveys using the Net Promoter Score (NPS) question type. NPS is a standardized metric, and keeping the format consistent removes a major source of variation when comparing results across languages.
- The dataset used for the analysis was limited to multilingual surveys, meaning, we included only surveys that had the translations feature enabled in the settings. To see a much larger dataset without language, check out our complete 2025 NPS benchmark report.
- We set a minimum threshold of 50 or more responses per survey. This was not an arbitrary choice. At lower thresholds (especially below 30), results became volatile. A small number of responses could disproportionately shift the NPS, making comparisons unreliable. At higher thresholds (100+), the data becomes more stable, but far less representative, because we’d start losing voices from smaller companies, niche industries, and less common language groups. With 50 or more responses, we found a middle ground – high enough to make sure the data is credible, and low enough to ensure survey diversity across the analyzed database.
- We treated each survey-language pair as a single unit and gave it equal weight. In practice, that means a survey with 50 responses counts the same as one with 5,000. This was intentional. Weighting by response volume would overrepresent larger companies and distort the relationship we’re trying to measure between language and NPS.
We report median NPS and percentiles (25th and 75th) instead of averages. Averages are easy to skew, while medians are harder to move and better at reflecting typical performance.
We drew overall NPS benchmarks for 18 primary languages, as well as several relationships between languages and other coexisting factors, like device type or industry. Where the data allows, we also break results down into regional variants (for example, Brazilian Portuguese). This helps surface differences that would otherwise disappear in broader language-level averages.
Key findings
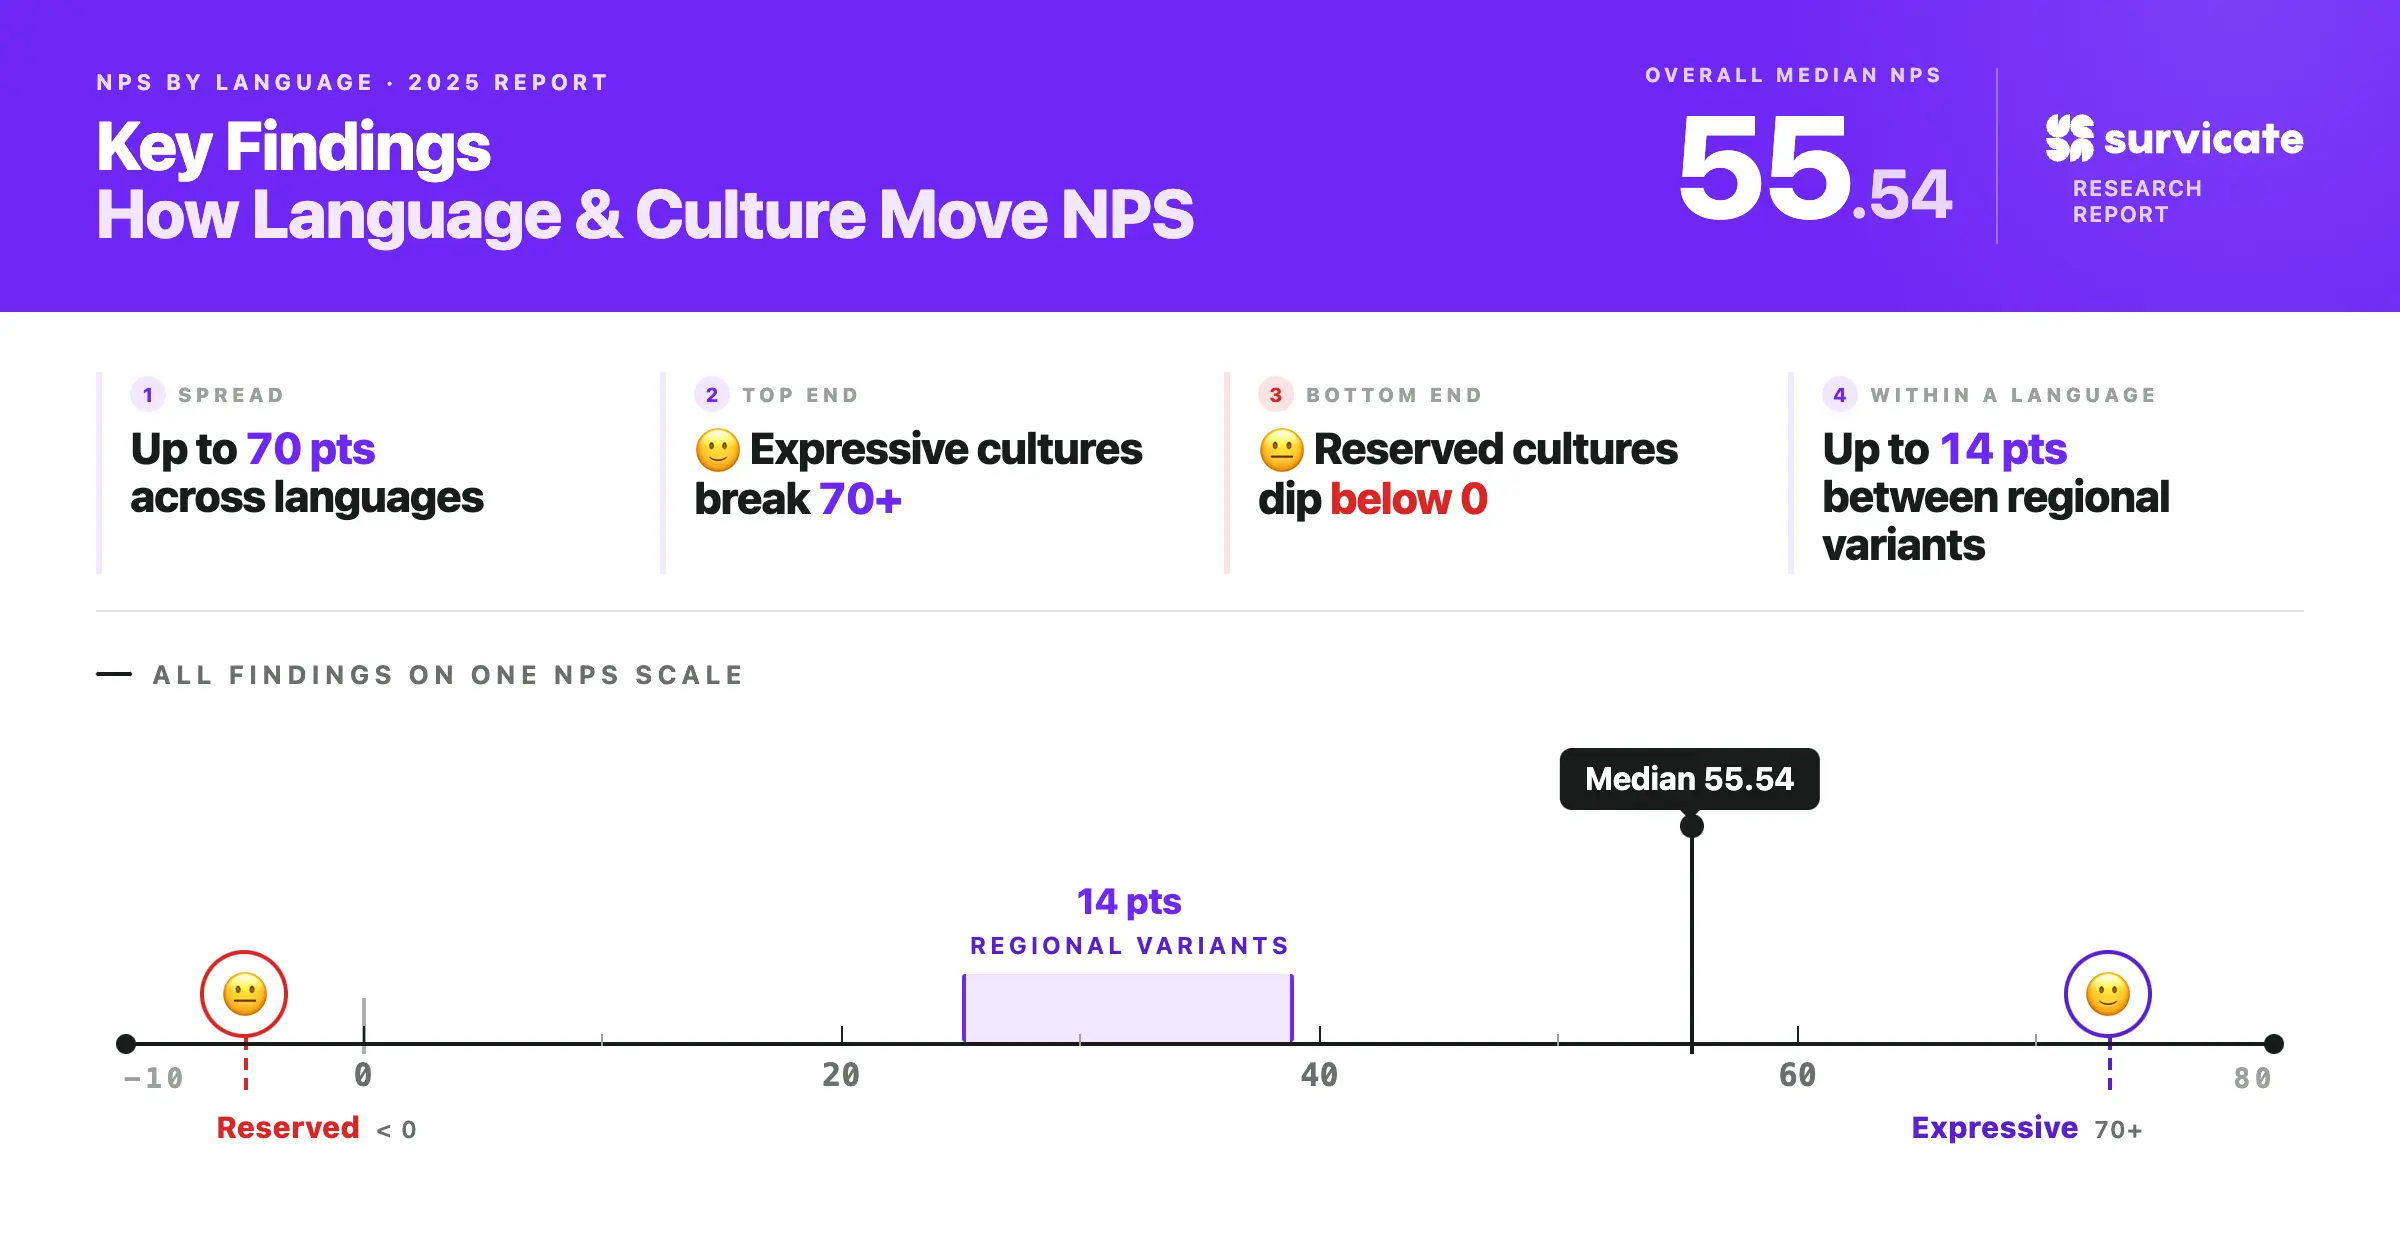
- The overall median NPS across the benchmark is 55.54
Half of all observations achieved an NPS of 55.54 or higher. The middle 50% fell between 27.50 to 71.34, which shows that if your score is around 55, your results fall broadly in line with most companies.
- NPS medians vary by up to 70 points across language groups
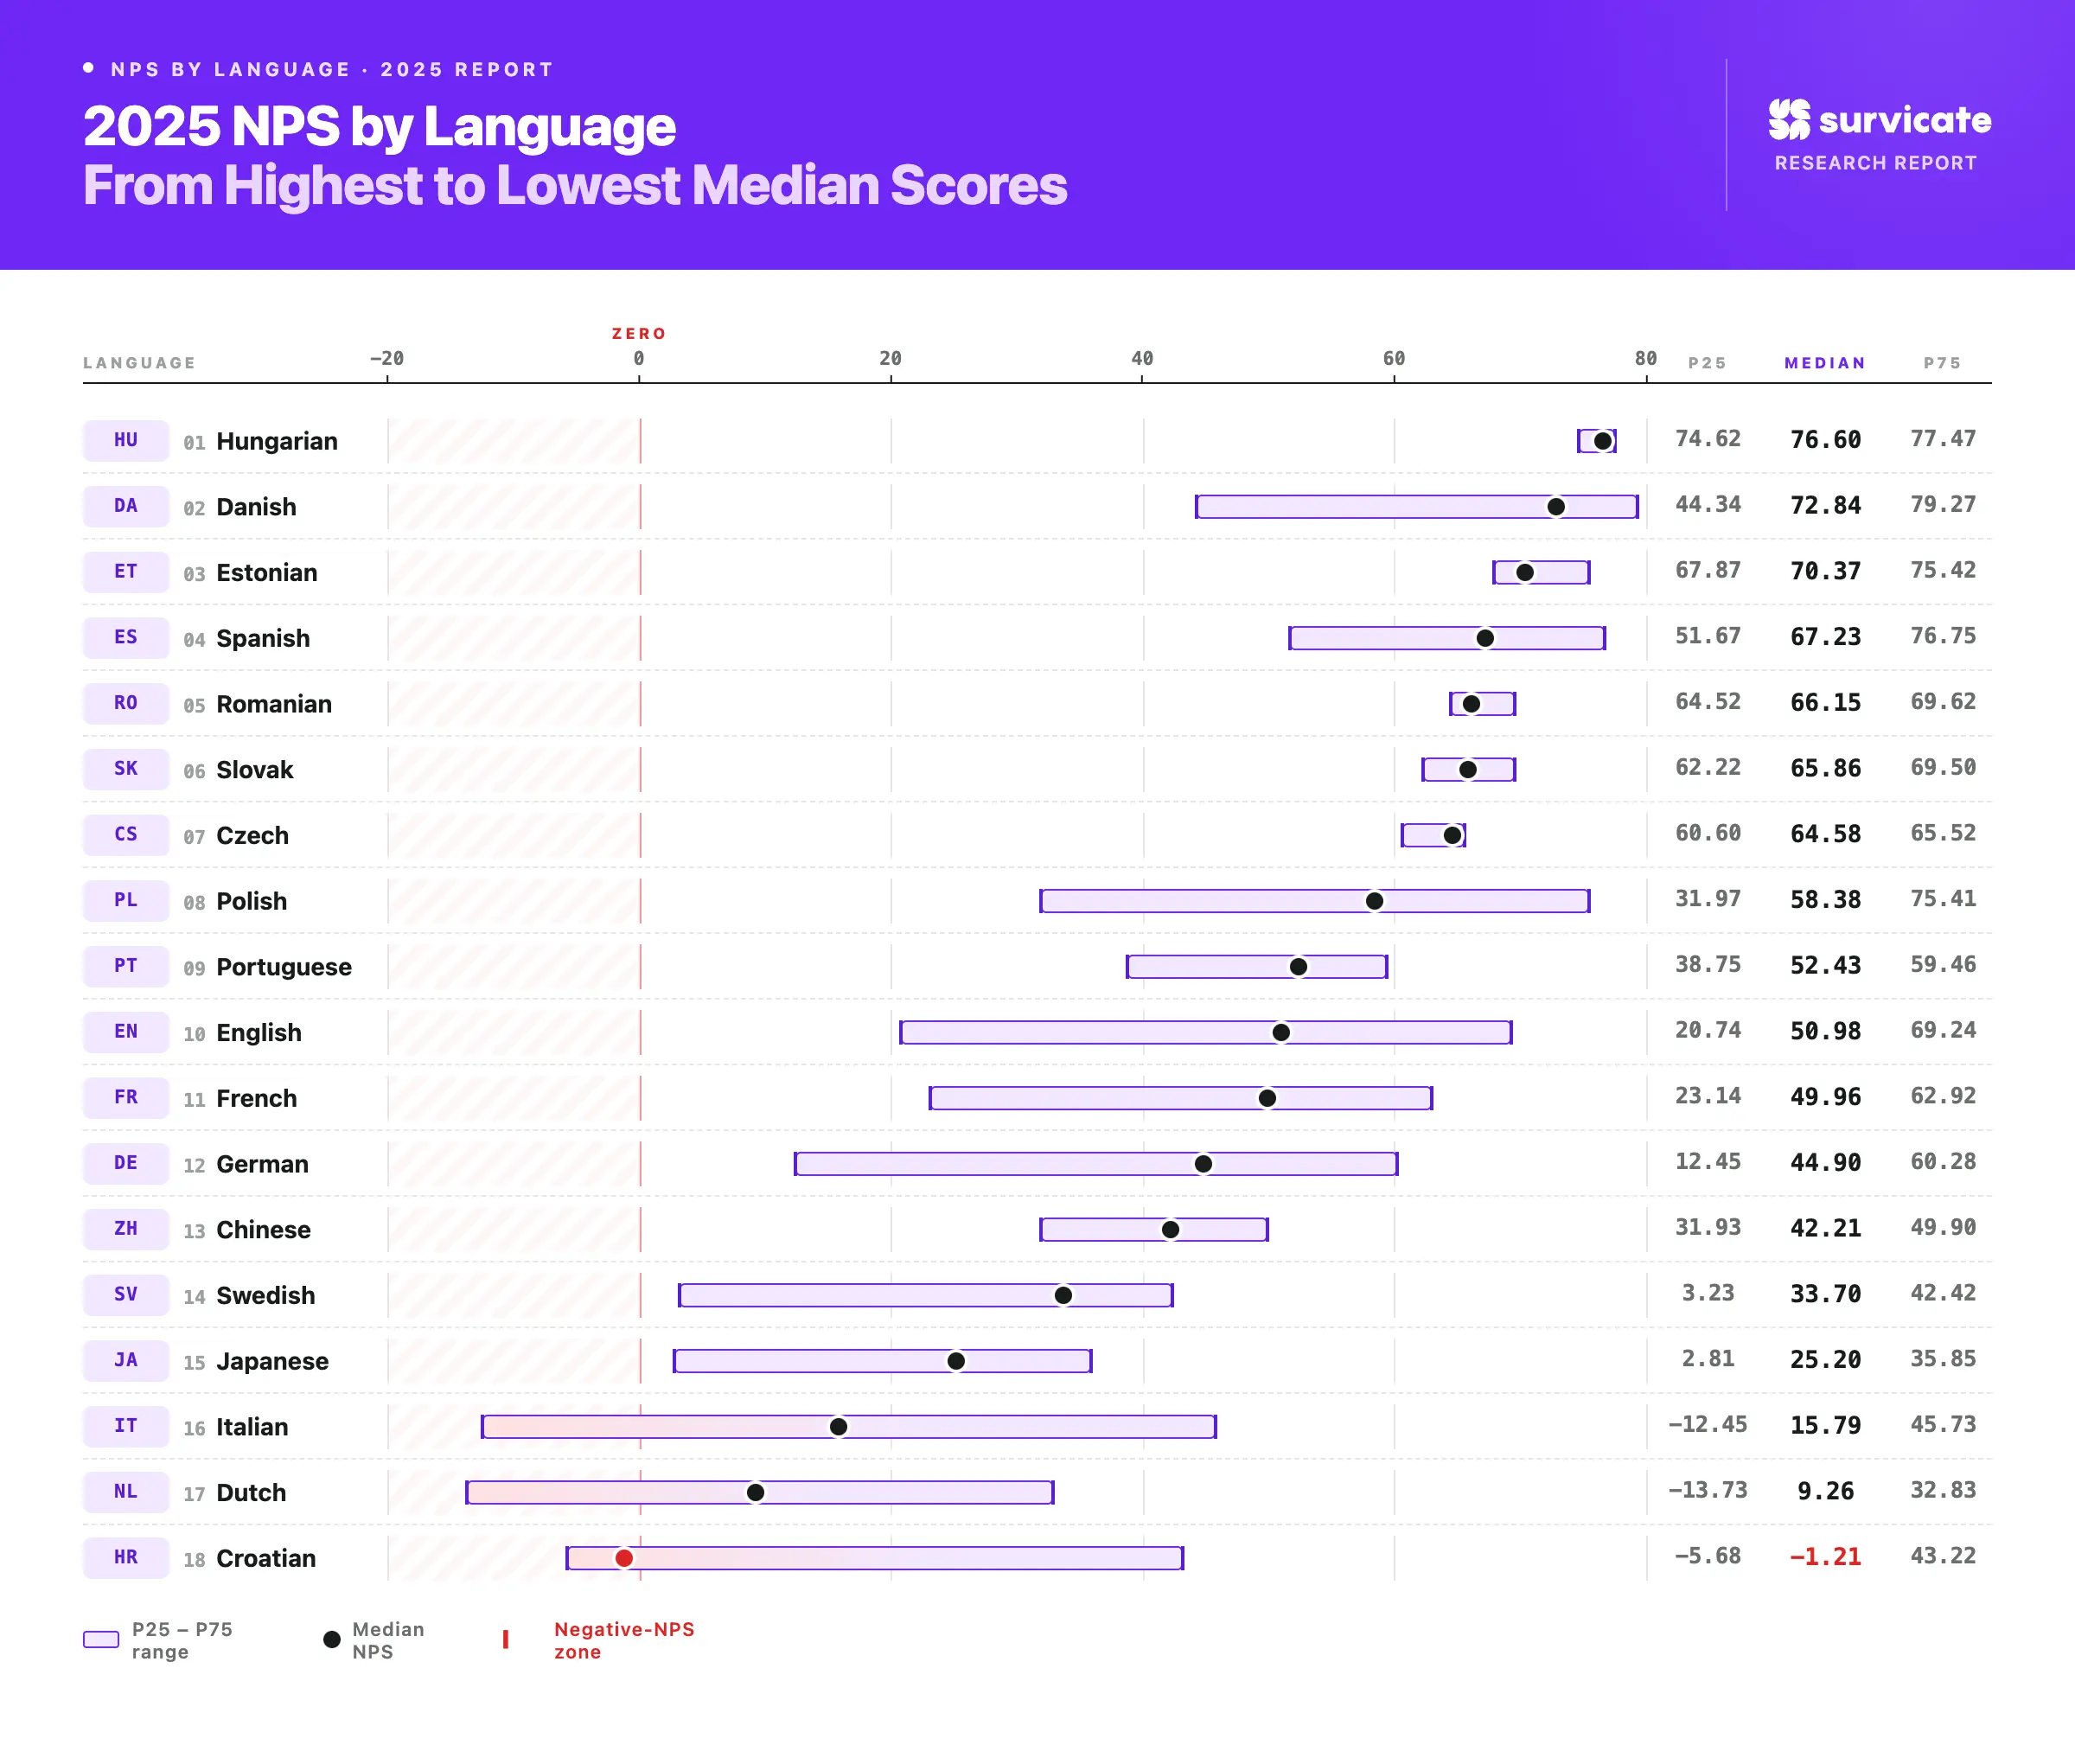
The data shows a wide spread in median NPS between language groups - from Hungarian at 76.60 to Croatian at −1.21. While this gap is partly explained by cultural response styles, it also reflects differences in the companies and industries represented within each language group.
- Cultures with expressive positivity or courtesy bias score highest - some exceeding 70 NPS
Languages such as Hungarian, Danish, Estonian, Spanish, and Romanian cluster at the top of the benchmark, with Hungarian leading at a median of 76.60. What they share isn't simply "high trust" but a cultural comfort with using the top end of the scale - whether through expressive enthusiasm (Spanish, Romanian) or decisive satisfaction with services that meet expectations (Hungarian, Danish, Estonian).
- Reserved and critical cultures anchor the lower end - some hitting negative NPS
Languages such as Dutch, Italian, Croatian, and Swedish tend toward conservative or critical scoring. For example, Croatian scores a median NPS of −1.21 and Dutch just 9.26 - not because of poor service, but because of cultural tendencies toward skepticism, precision, and understatement.
- Regional language variants can differ by as much as 14 NPS points
When looking at localized versions of the same language, meaningful gaps emerge. Brazilian Portuguese (52.94) scores noticeably higher than European Portuguese (38.75), reflecting the expressive tendencies of Latin American markets. By contrast, American and British English variants show near-identical medians (63.78 vs. 62.86).
- Cultural response styles influence NPS across all contexts
Research shows that respondents in different cultural contexts use rating scales differently – some are more likely to give high or positive scores, while others are more critical. This means that NPS reflects both actual experience and how customers express it, and should always be interpreted within context.
- Our NPS language data has a few limitations you must be aware of
Here are our main observations:
- Language is a proxy, not a perfect representation of culture or location.
- Major languages (like English) are not always fully localized across devices, and are often used as default language settings in software or on-site settings. This matters if your goal is to analyze local variations of such languages.
- Response styles can be influenced by additional factors, such as education level, survey mode, number of questions, or question wording.
- Industry and company-level factors still matter, and can create meaningful variation within the same language group.
Global NPS scores – a high-tier, cross-industry benchmark
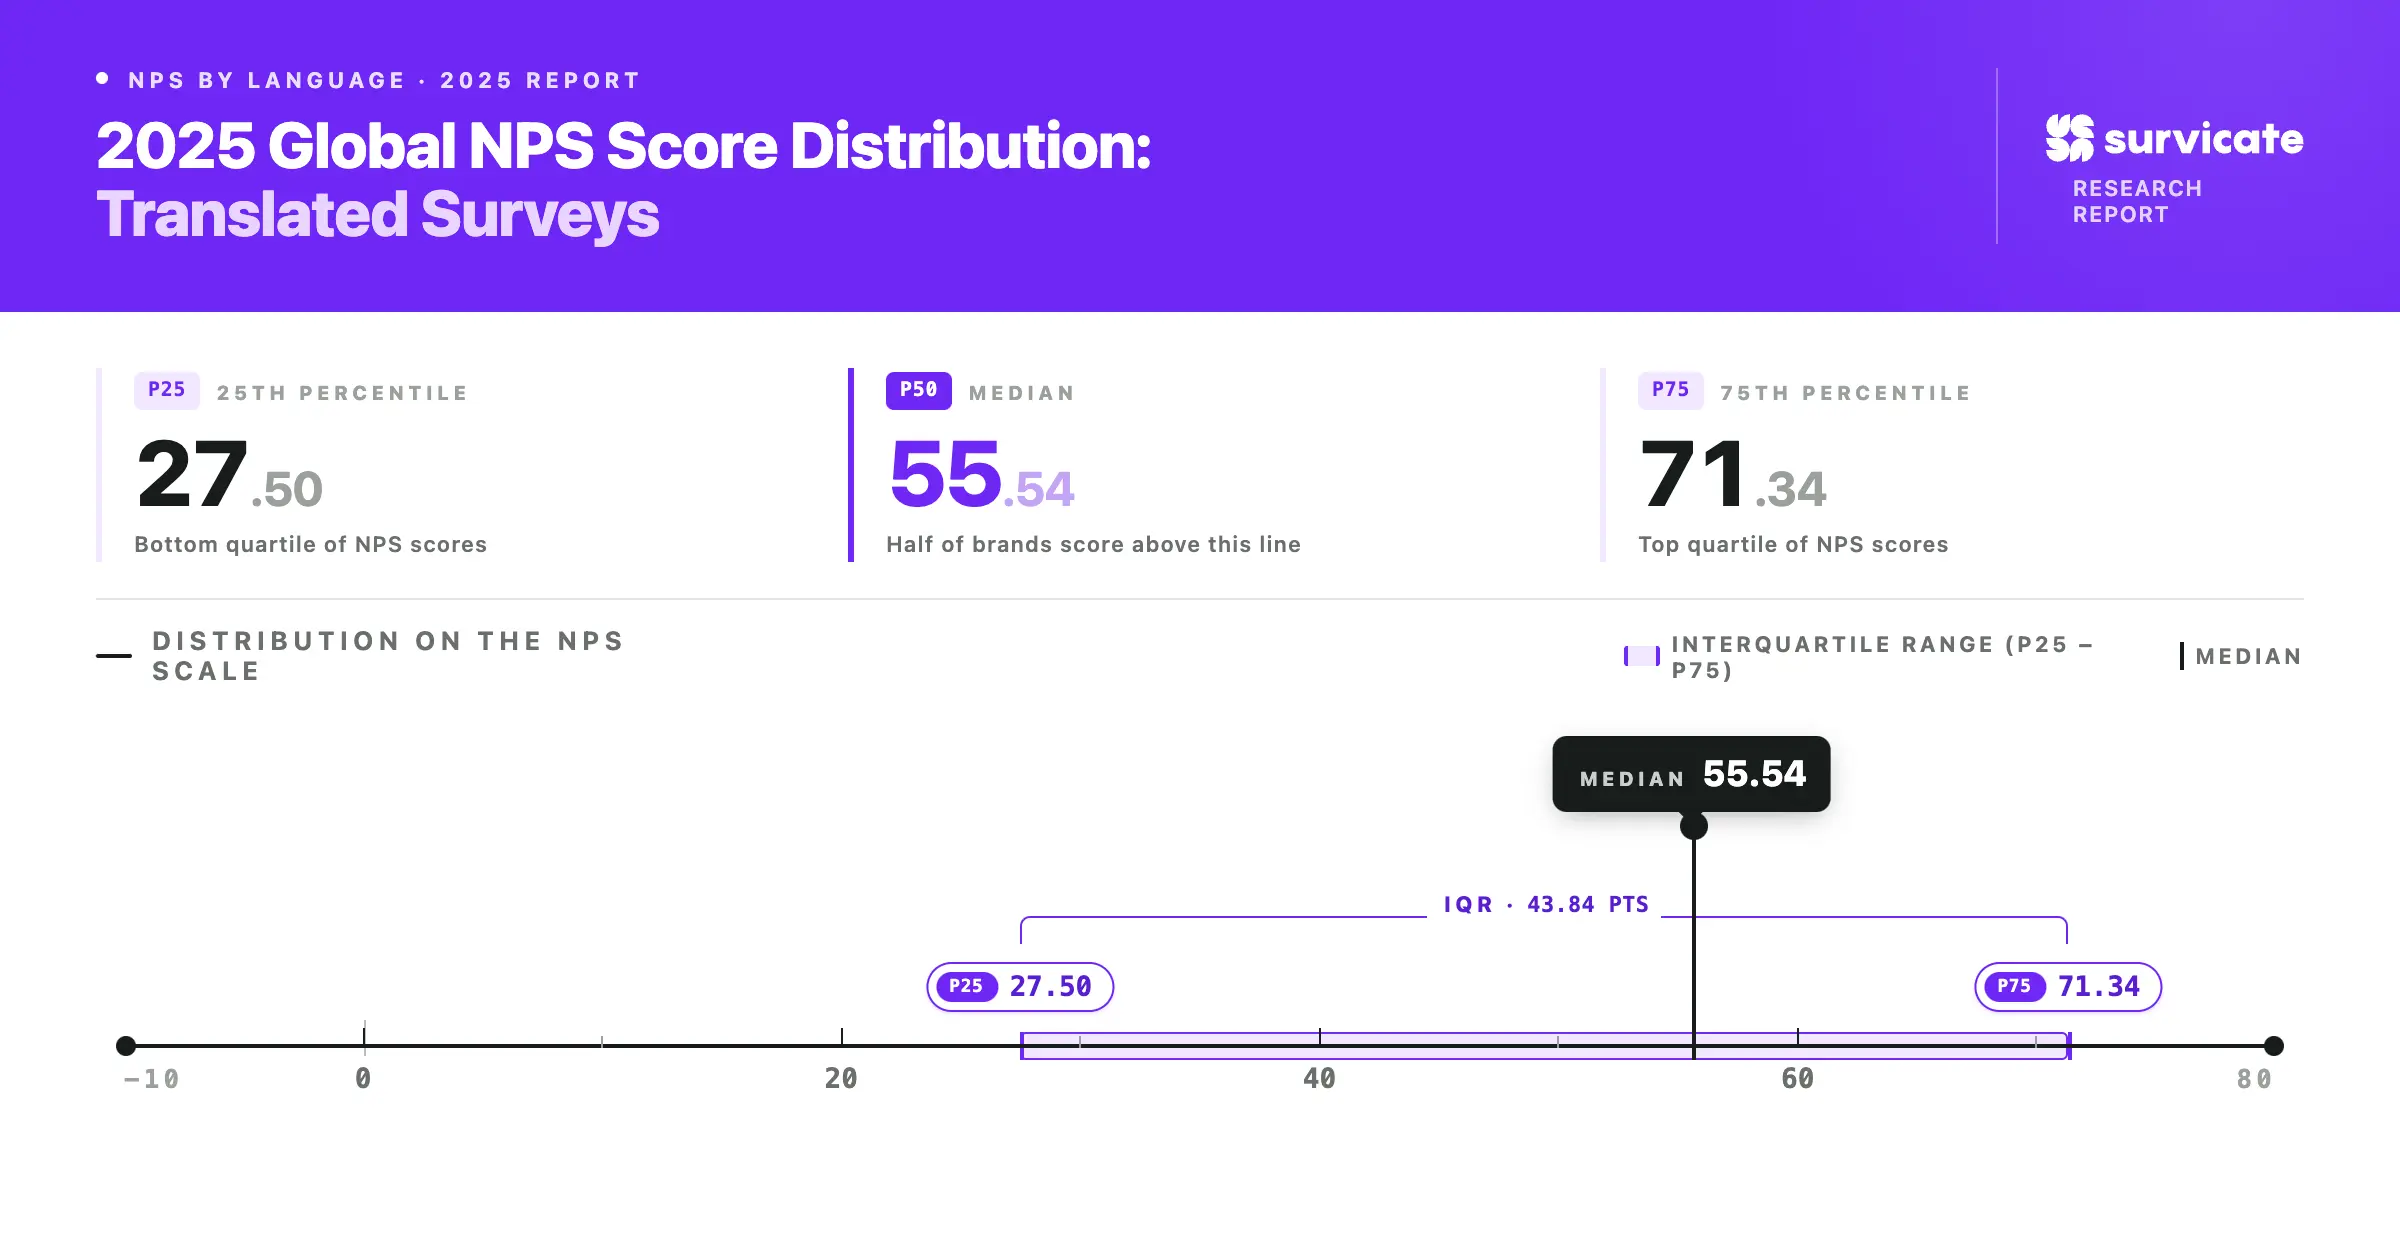
Across the full dataset, the median NPS is 55.54, with the middle 50% of results ranging from 27.50 to 71.34.
This can serve as a global reference point for surveys that are translated into multiple languages. However, as the results for individual major languages show, NPS varies significantly across groups, so comparing performance to a global average alone may be misleading.
More meaningful insights come from benchmarking within comparable language or cultural contexts.
The cultural gap – Why language can swing NPS scores by 70 points
The data shows a massive gap of 50–70 points between the highest-scoring languages, like Turkish and Spanish, and the more conservative scores seen in Dutch or Croatian groups.
Is one group actually more satisfied? Not necessarily. This spread often stems from cultural "fingerprints" on the rating scale rather than the service itself. Understanding these nuances helps avoid comparing apples to oranges when looking at global performance.
The three drivers of response bias
When a respondent looks at a survey, their cultural background often dictates how they use the numbers. The analysis points to three primary behaviors:
A "7" in a reserved culture might represent the same level of loyalty as a "9" in an expressive one. Research from Ipsos and CustomerGauge confirms that these variations are a natural part of the global survey landscape.
Tip: Benchmark languages against their own historical medians rather than chasing a single, global average that doesn't account for these cultural fingerprints.
Spanish (ES): High enthusiasm drives market-leading medians
With a median score of 67.23, this group reflects a cultural tendency toward expressive positivity. Whether the feedback comes from Spain or Latin America, these respondents are far more likely to reward a good experience with a glowing score compared to their global peers.
Why the scores lean positive
The high median highlights two specific cultural drivers:
- Expressive positivity. In many Spanish-speaking markets, consumers use the top end of the scale to signal genuine satisfaction. A "9" or "10" is the standard way to say a job was well done.
- The harmony factor. A "courtesy bias" often exists where respondents prefer to maintain a positive tone. While this results in excellent scores, it can sometimes mask minor frustrations that a more reserved culture might point out.
Seeing a median near 70 is fantastic, but it sets a high bar for excellence. Because Spanish-speaking respondents are more comfortable using the "10," a sudden dip in these scores is often a much stronger signal of trouble than it would be in a more conservative market. When monitoring this group, look for a high proportion of Promoters as the "normal" baseline.
German (DE): Precision over praise leads to conservative scores
German respondents prioritize accuracy over enthusiasm. A median of 44.90 reflects a cultural standard where an "8" is considered a job well done, and a "10" is reserved for the truly extraordinary. This results in a much lower baseline compared to more expressive regions.
This "modesty bias" is a hallmark of Northern European markets. German scores aren't a sign of dissatisfaction, but rather a preference for precision and a rejection of exaggeration. When analyzing these results, remember that a "Passive" score here often carries the weight of a "Promoter" elsewhere.
English (EN): The middle ground of global benchmarking
English-language scores sit right in the center of the global landscape. With a median of 50.98, this group represents a "balanced" baseline. The results likely reflect a blend of styles – combining the slightly more enthusiastic feedback common in the US with the more reserved, understated tone typical of the UK and Australia.
While English speakers are more likely to award high marks than their Northern European neighbors, they remain more conservative than Latin American respondents. This makes the English benchmark an excellent "anchor" for global comparisons, as it avoids the extremes of both high-positivity and high-reserve cultural biases.
Portuguese (PT): Moderate positivity with a steady baseline
Portuguese-language scores show a healthy, positive trend with a median of 52.43. This group tends to lean toward the higher end of the scale, often influenced by the enthusiastic response patterns seen in Brazilian markets. Unlike other regions with wild swings, the gap between the 25th and 75th percentiles is relatively tight, suggesting more consistent scoring behavior across this group.
The steady scores here indicate a reliable customer base that is comfortable being expressive but maintains a realistic middle ground.
French (FR): A balanced median with a critical edge
French-language scores land almost exactly in the center of the global average, with a median of 49.96. However, the wide spread between the 25th and 75th percentiles tells a more complex story. French respondents are often noted for their discernment; they aren't afraid to be critical, leading to more neutral or "Passive" scores compared to the enthusiastic patterns seen in Spanish-speaking markets.
This "discerning" style means a high score from a French speaker is truly earned. Cultural norms here value objective analysis, so "10s" are rarely handed out lightly. When viewing these results, the broad range suggests that while the average is stable, individual experiences can lead to highly varied (and often very honest) feedback.
Polish (PL): Strong scores within a varied landscape
With a median NPS of 58.38, Polish-language responses show a surprisingly strong positive lean. While there is less specific academic research on Polish survey behavior compared to Western European markets, the data places this group comfortably above the global average. The wide spread – from a 25th percentile of 31.97 to a 75th of 75.41 – suggests that Polish respondents are quite reactive to the specific quality of the experience.
Without a dominant cultural bias like the "modesty" found in Germany or the "expressiveness" of Spain, Polish scores likely reflect a more direct, experience-based assessment. This makes the Polish benchmark a reliable indicator of actual service quality rather than just cultural habit.
Italian (IT): Critical responding leads to a conservative floor
Italian-language responses show some of the lowest scores in this dataset, with a median of 15.79. These results suggest a highly critical response style. The 25th percentile even dips into negative territory (-12.45), indicating that Italian speakers are far more comfortable using the "Detractor" end of the scale than many other groups.
In the context of European benchmarks, Italian scores often align with more demanding consumer expectations. Unlike cultures that lean toward "courtesy bias," this group likely prizes high standards, making a "Passive" or "Promoter" score a significant achievement. When managing these results, it is essential to focus on the trend over time rather than comparing the raw median directly against more expressive languages like Spanish.
Dutch (NL): The "Dutch effect" and the power of understatement
The data reveals a median of 9.26, one of the lowest in the study. This is a textbook example of the "Dutch effect" – a cultural phenomenon where respondents are famously direct and reluctant to award a "10." In this context, a low score doesn't necessarily signal a service failure; it reflects a cultural preference for honesty and precision over high-energy praise.
As noted in CustomerGauge research, Dutch consumers value equality and modesty. An "8" is often the highest score a satisfied customer will give, viewing anything higher as hyperbolic. While the 25th percentile sits at -13.73, this simply means the bar for entry into the "Promoter" category is much higher. For this group, a positive NPS – no matter how small – is a clear win.
Danish (DA): Market-leading scores in high-trust societies
Danish-language responses stand out with an impressive median of 72.84, the highest in this report. This peak reflects a broader trend researchers identified in Danish society: high levels of social trust and general satisfaction with institutional services. When a system works well in Denmark, respondents aren't shy about awarding top-tier scores, resulting in a 75th percentile that nearly reaches 80.
In these high-trust environments, "Promoter" status is the standard expectation rather than a rare exception. However, with a 25th percentile at 44.34, even the lower-performing segments in this group would be considered top-tier in many other markets. A possible reason is that Danish speakers don’t just rate higher in comparison to other Nordic countries – they rate more decisively overall. So, when something doesn’t work, they’re also more likely to drop into detractor scores.
Swedish (SV): Reserved feedback from a conservative market
Swedish-language scores follow the characteristically reserved patterns of Northern Europe. With a median of 33.70, this group is less likely to use the top end of the scale compared to their Southern European or American counterparts. Similar to the German and Dutch markets, a "Passive" response here often indicates a perfectly satisfied customer who simply avoids exaggeration.
With a 25th percentile sitting just above zero at 3.23, it's clear that Swedish respondents lean toward a more critical, "show me" attitude. Compared to other low NPS groups, the critical voices here stand out and only compare to Japanese. Data suggests that reaching the 75th percentile requires a high level of precision and consistency to break through the cultural preference for modesty.
Japanese (JA): Lower median with more critical scoring patterns
The data for Japanese-language surveys shows a lower median NPS of 25.20, placing them below the overall benchmark.
The wide spread between the 25th percentile (2.81) and 75th percentile (35.85) indicates meaningful variation across companies, but within a generally more critical scoring range. In many customer experience studies, Japanese respondents tend to be more reserved in giving top scores and more likely to choose moderate ratings. This can result in lower overall NPS despite comparable underlying satisfaction.
Chinese (ZH): Consistent mid-range scores across the sample
Chinese-language results sit slightly below the overall benchmark, with a median NPS of 42.21. What stands out here is the consistency across the 25th and 75th percentile, too, as most scores fall within a relatively narrow range, from 31.93 to 49.90.
This kind of distribution usually signals stable performance across companies, rather than a few outliers pulling the average up or down. It also aligns with broader survey patterns, where respondents tend to avoid extreme ratings and stick closer to the middle of the scale.
In practice, this means scores in this range are less about isolated highs or lows, and more about consistent, moderate customer sentiment across the board.
Czech (CS): High scores with low variability and a more neutral response style
Czech-language results show a relatively high median NPS of 64.58, placing them above the overall benchmark. There are tight distribution scores, with 25th and 75th percentiles standing at 60.60 and 65.52, respectively.
This pattern fits broader cultural observations. Some studies suggest that Czech respondents tend to avoid extremes and favor more neutral or moderate responses, often combined with a tendency to avoid conflict in communication. This can lead to less volatile scores compared to markets where respondents use the full scale more freely.
Estonian (ET): Strong performance clustered at the top end
Looking at a median NPS of 70.37, Estonian-language results fall well above the overall benchmark. Scores are tightly clustered here, because the middle 50% ranges from 67.87 to 75.42. This indicates consistently strong results across Estonian-language surveys run in 2025.
Where do these high scores come from? We can partially contextualize them with broader findings on sentiment in Estonia. OECD data shows that Estonians report higher-than-average satisfaction with administrative services (e.g. 75% vs 63% OECD average). This suggests generally positive evaluations of service quality and interactions.
Croatian (HR): Skepticism but also high contrast in score distribution
Croatian-language survey results show a different profile compared to Estonia, as it’s characterized by a median NPS of -1.21. While the median sits near the zero mark, an interesting finding is that distribution is highly polarized.
Namely, the 25th percentile is at -5.68, while the 75th percentile jumps to 43.22. This wide spread (a 48.9-point difference between the middle quartiles) indicates that sentiment is not clustered but is split between a larger Detractor and a smaller, highly satisfied Promoter group.
Croatian-speaking consumers tend to be reluctant towards services or products that they find unproven or ambiguous. Researchers call this uncertainty avoidance, a trait that remains in some post-transition economies even decades after transformation.
This could explain the tendency to give low or reserved scores – as well as the jump to 9 or 10 NPS scores quickly, once a client’s worries are resolved.
Hungarian (HU): Stability and high consensus among respondents
The Hungarian results show a remarkably high median NPS of 76.60, which indicates a strong and unified level of customer satisfaction. What stands out most is the density of the scores, as there’s only a 2.85-point spread between the 25th and 75th percentiles.
This level of stability indicates that the services respondents were ranking were consistently meeting their specific and well-defined set of expectations. For example, in sectors like FMCG, Hungarian consumers tend to reward quality and "doing a job properly" with decisive loyalty.
Romanian (RO): Pragmatic loyalty and the maturing consumer
Romanian-language results show a median NPS of 66.15, signaling consistent satisfaction. There’s also a narrow 5.1-point spread between the 25th percentile (64.52) and the 75th percentile (69.62), so the sentiment in our data is remarkably stable.
This lack of volatility suggests that the service is successfully meeting the specific, functional needs of consumers. Assuming most respondents reside in Romania, this could be explained by a study by EY. They found that Romanian-speaking respondents have become more pragmatic, rewarding brands that remove ambiguity and deliver on their core promises.
In this context, a high and tight NPS cluster acts as a "reliability seal," showing that the brand has overcome local skepticism by providing a predictable and high-value experience.
Slovak (SK): Stable consensus and quality-centric loyalty
The Slovak data shows a robust median NPS of 65.86, signaling a healthy and positive relationship between the service and its users. The results are characterized by a steady "middle ground," with the 25th percentile (62.22) and 75th percentile (69.50) sitting just 7.28 points apart.
A core ranking factor that could have affected these higher-end scores is brand vision alignment with customers’ own values. Studies found that Slovak consumers are increasingly rewarding companies that demonstrate transparency and fulfill their promises without hidden catches.
Key pattern – cultural differences matter just as much as experience quality
Looking at the data across all of the above languages, the most striking takeaway is how strongly culture can drive perception – right next to experience, which is not a surprising factor.
We’re seeing a massive NPS score spread between groups like Spanish speakers at the top and Dutch or Italian speakers at the bottom. This gap can be explained not only by economical and even historical factors, but also how different cultures perceive a 0-10 scale.
Language variants (Localized)
English variants: High consistency across regional dialects
When looking at localized English, the difference between American (63.78) and British (62.86) medians is negligible. This 1-point gap confirms that while the US often leans toward higher enthusiasm, both markets respond to quality in a nearly identical way.
Notably, most respondents use the generic "en" setting. These specific regional variants represent a smaller subset of users, yet they provide a clear signal: for English speakers, the experience itself matters far more than the specific dialect.
Portuguese variants: Expressive Brazil vs. reserved Portugal
When comparing localized Portuguese, we can see a notable gap between Brazilian (52.94) and European (38.75) medians. Brazilian Portuguese exhibits higher positivity, which aligns with Latin American expressive response styles where users are more likely to award top-tier scores.
In contrast, European Portuguese appears more reserved, mirroring the conservative feedback patterns typically seen across European markets.
In this example, we can assume we’re looking at a textbook example of how "enthusiasm bias" can elevate scores without necessarily reflecting a different level of service quality than that received in Portugal.
Language vs. format: Cultural patterns dominate the delivery method
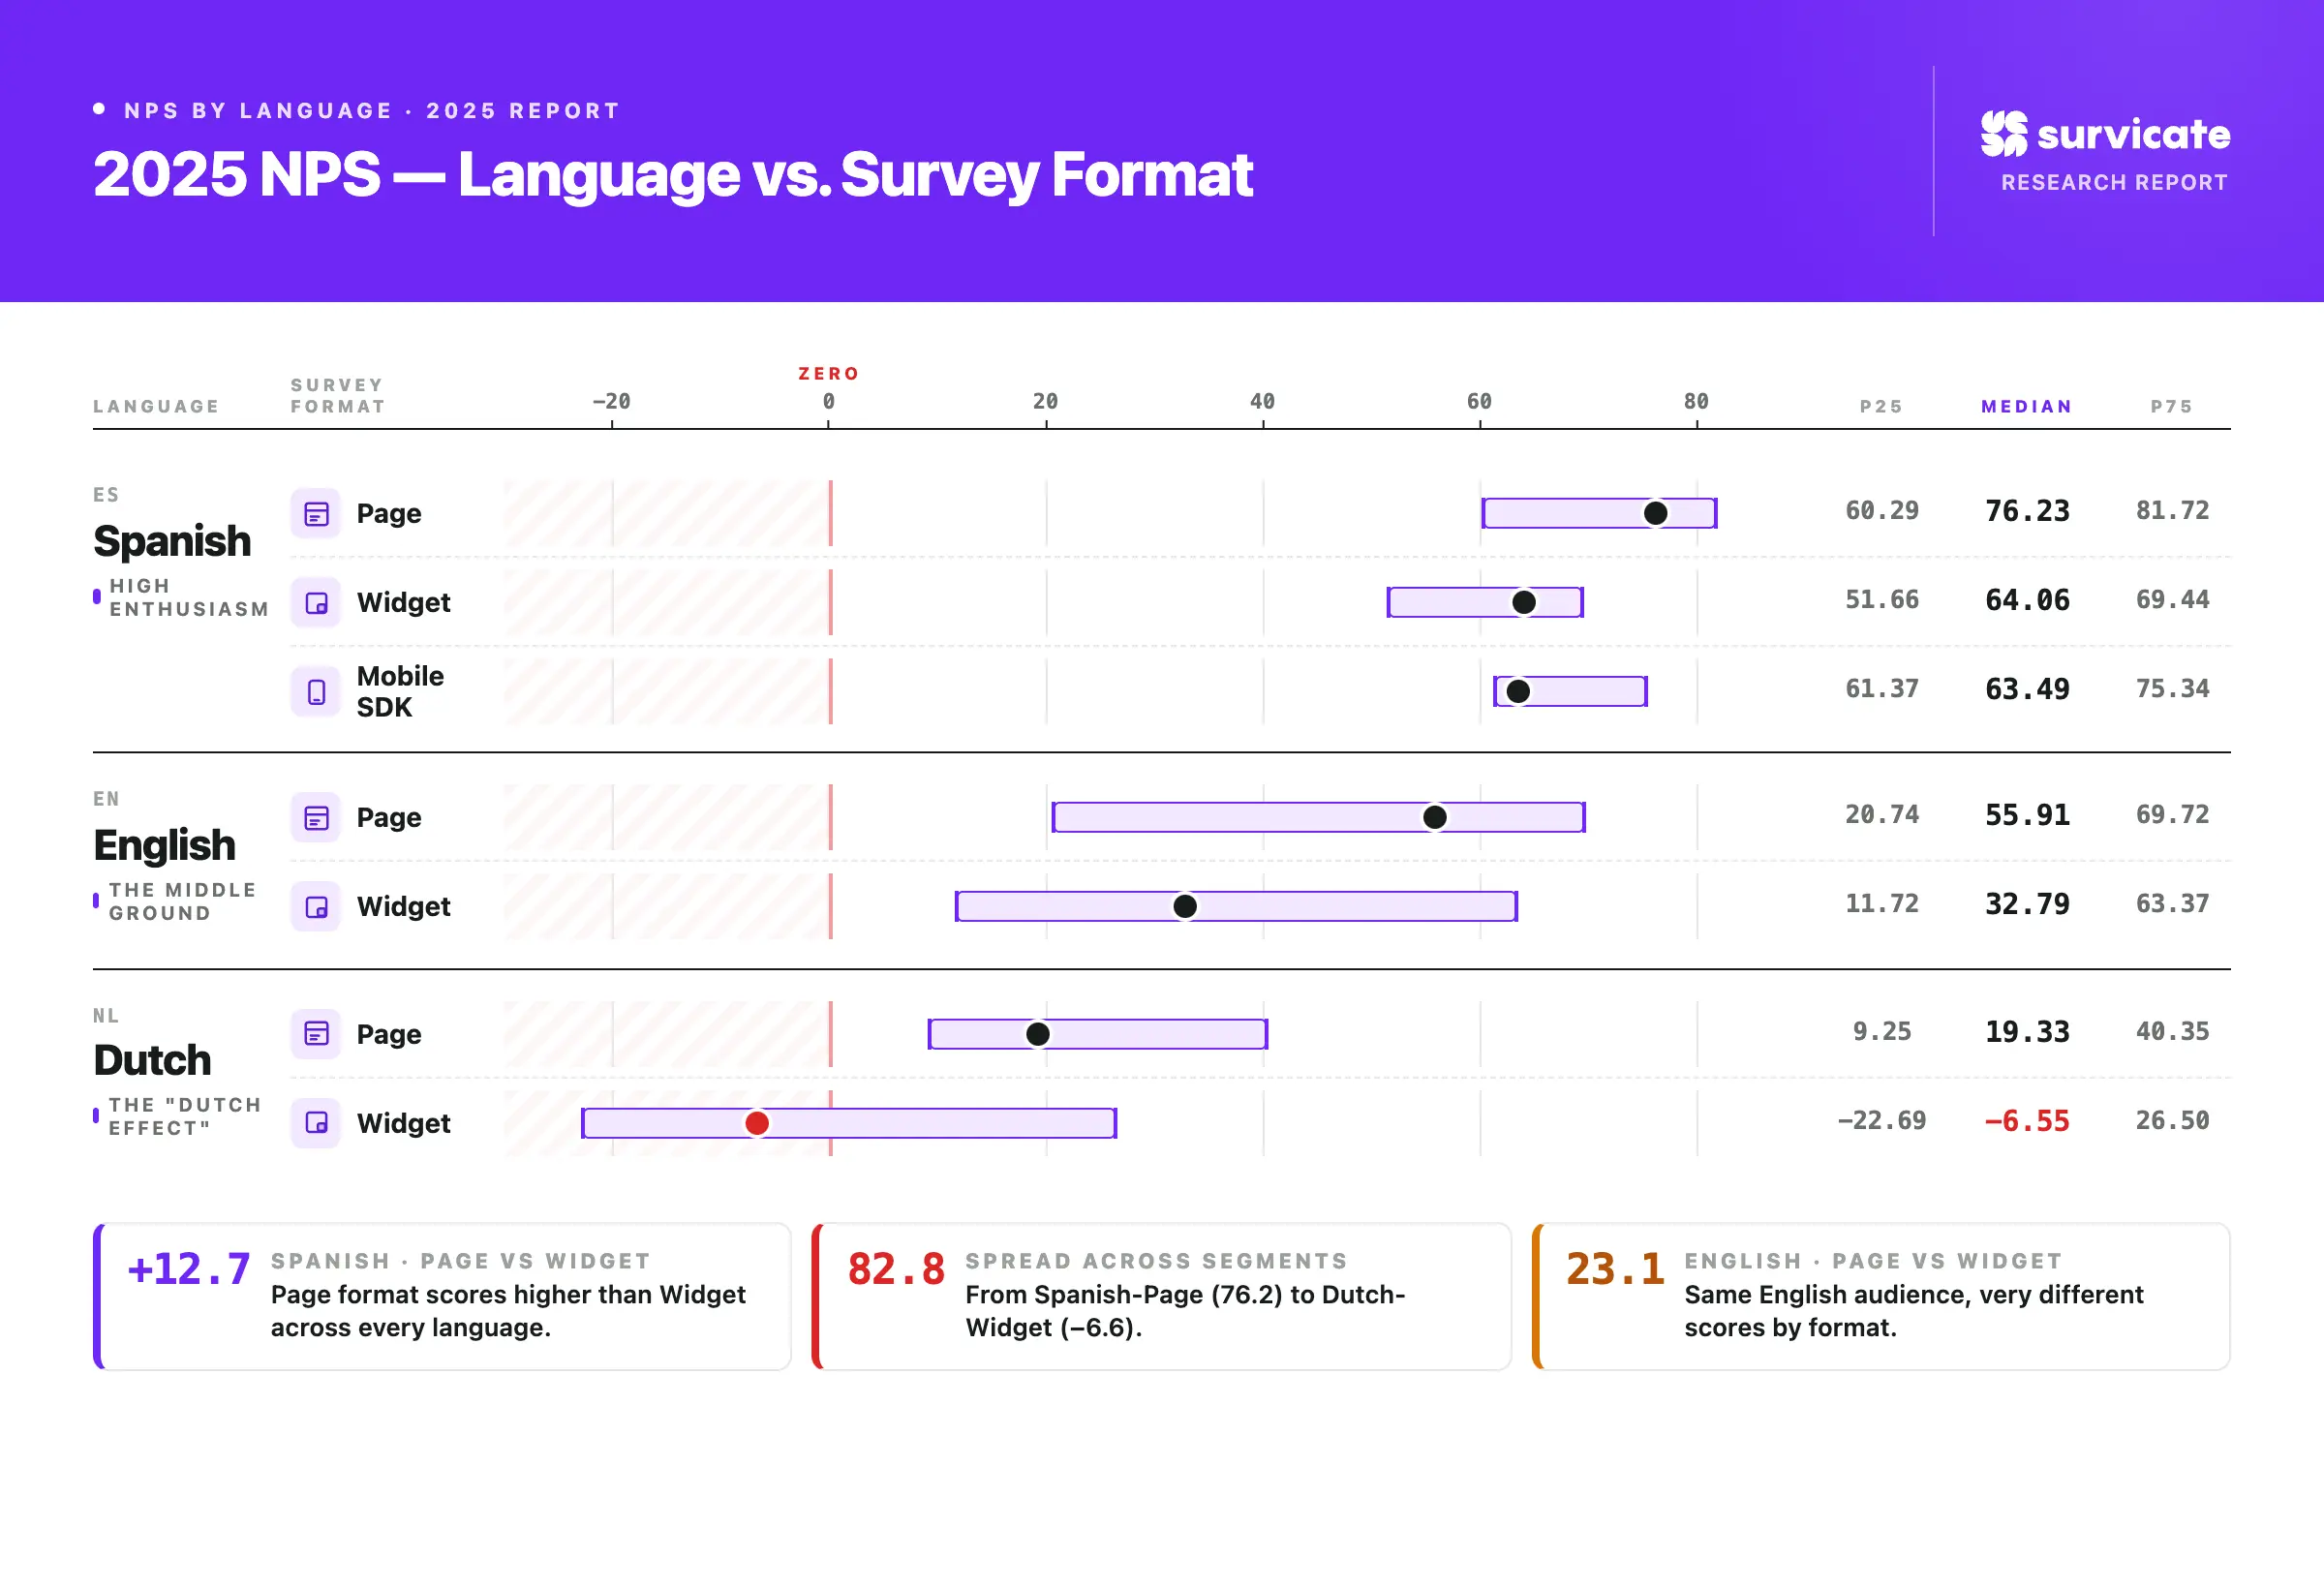
You might assume that switching from a widget to a dedicated page for your survey would fix a low NPS. Or that mobile surveys perform worse because people rush through them. These are logical assumptions, but findings from our data tell a different story.
We’ve found that the biggest driver of NPS in the language-format relationship isn't how you deliver your survey, but who’s filling it out.
Spanish speakers score 64.06 on a widget while Dutch speakers score -6.55 on the exact same tool – a ~70-point gap that no format change can explain. Format can shift scores within a culture, but it doesn't erase the cross-cultural divide.
Important note: A low score on a specific survey format (like a web widget) might not signal a technical failure. In more reserved cultures, certain formats simply invite a more precise (and more conservative) evaluation.
So, the "cultural fingerprint" remains the strongest predictor of NPS. We find this is true even when the delivery method is identical.
Final takeaway: Why raw NPS benchmarks are not universally comparable
Raw scores are misleading without cultural context. Differences in NPS often come from systematic response biases – like extreme response styles or a preference for the midpoint – rather than pure satisfaction levels. Essentially, a "7" in one language can represent the same loyalty as a "9" in another.
The two-track driver of scores
- Language culture as a baseline. Expressive cultures (like Spanish) often show higher scores due to "courtesy bias." Meanwhile, reserved cultures (like Dutch or German) provide more critical, "precise" feedback.
- Industry and company variation. Culture isn't the only factor. Market expectations and actual service quality still create significant swings within the same language group.
NPS is a hybrid metric. It reflects both what customers feel and how their culture allows them to express it. To get the full picture, always benchmark against historical regional medians rather than a single, global average.
Strategic advice: Benchmark within language
Comparing a score from Berlin to one from Madrid is a recipe for a headache. To get a clear picture of performance, comparisons must happen within the same context. A score of "55" only holds meaning when measured against how people in that specific culture tend to use the scale.
Compare Spanish vs. Spanish or German vs. German. This controls for how strict or lenient a specific culture is with the 0-10 range.
Practical steps for global teams
- Calibration over raw data. Stop comparing global regions without adjusting for known biases.
- Build language-aware targets. Set internal benchmarks based on regional medians rather than a one-size-fits-all goal.
Layer the insights. Use verbatim feedback to supplement raw scores. The "why" in the comments often reveals the true sentiment that the cultural bias in the "number" might hide.


.svg)

.svg)