
I’d bet you $100 that if asked whether short or long surveys perform better, you’d say "shorter" without blinking.
But we just analyzed tens of thousands of surveys by our customers on the Survicate platform, and the data caught us off guard. In many scenarios, long surveys see surprisingly strong response and completion rates.
You probably have a lot of questions (pun intended). Why do longer, time-consuming surveys often perform better than expected? For whom do they work?
We’re breaking down the data – and the strategies – to help you set up your next survey for actual success.
Over 21,000 surveys analyzed, covering 50+ industries
To find out what actually makes a survey work, we dug into a massive, global dataset of 21,863 surveys collected throughout 2025. This wasn't just a narrow slice of the market, because it covered over 50 industries (as self-reported by our customers).
Education (1,505 surveys), Software (1,196), and IT (938) provided the most data, followed by Media, Food & Beverages, Healthcare, Finance, Retail, and Professional Services.
We cut any survey with fewer than 10 responses (how we count responses). We also manually cleaned the data for smaller sectors like Aviation, Legal, and Agriculture to make sure a few weird entries didn't skew the whole picture.
We also broke the surveys down into "length buckets" so they were easier to compare:
Please note that we included both standard survey questions always presented to respondents, as well as questions part of survey branch logic, which may or may not be visible to all respondents. Surveys using custom branch logic can impact the total amount of questions for some surveys in our dataset.
From there, we went for a few key metrics: the percentage of people who actually responded, how many finished the whole thing, and exactly how many seconds they spent doing it. We even did a specific deep-dive into the micro-survey range (1-5 questions) to see if every single extra question changes the outcome.
By using classic averages and stripping out invalid entries, we’re able to show how survey length impacts both response and completion rates in unexpected ways.
Now, onto the results. You’re in for a few genuine shocks.
Shorter is not necessarily better
For years, the golden rule of surveys was keep it short or kiss your response rates goodbye. We believed it, and you probably thought it too. But as it turns out, the data has some notes.
We looked at the numbers, and "shorter is better" isn't always true. Longer surveys often see higher response rates.
Check out how the response rates climb as the question count goes up:
But what about the 1-question surveys?
Micro-surveys with one question only have an average completion rate of 85.7% – the highest of any question-count group in the entire dataset (n=1,793 surveys).
Why is the 1-question completion rate so high?
- There is no "mid-survey abandonment" moment. The psychological mechanism behind survey drop-off is respondent fatigue and regret. People start a survey, see more questions than expected, and leave. With a single question, that moment never happens. By the time a respondent registers what they're looking at, they've already answered it.
- The completion time is short. 61.5% of 1-question surveys are completed in around 30 seconds. The cognitive cost is effectively zero. Abandoning such a short task requires more effort than finishing it.
This works in favor of all industries, even government and insurance. In this context, the golden rule of "shorter is better" does hold true.
Response rates peak at the 101-150 question bucket
You might be thinking, “Who on earth is sitting through 150 questions?” The answer is people who truly seem to care. This is what we call the self-selection logic. When you send a 3-question survey, you’re usually blasting it to a broad, generic audience who doesn’t have much skin in the game. They’re "flaky" because the topic is generic. But there are also other explanations:
- When a survey hits 100+ questions, it’s usually because it’s highly targeted. It’s sent to a motivated group – employees, die-hard customers, or specialized professionals – who have a genuine stake in the topic. They’re sharing their expertise, instead of just clicking buttons.
- As we've noted earlier, surveys using branch logic can extend the survey length way beyond the standard questions always visible to all respondents. And if it's something we know about personalized surveys, it is that they tend to lead to far better results.
- Some of the surveys we look at here may more closely resemble market research surveys.
- Respondents for some surveys could be motivated by various nuggets, such as direct payment rewards.
Lastly, we do need to point out that the obvious: the sample size in our dataset for this bucket is (quite naturally for Survicate, we're not primarily a market research tool) very small. We're merely observing a pattern - we're not saying longer surveys are generally preferable to shorter ones.
The 151-question dip
You’ll notice the momentum breaks once you cross the 150-question mark and a curious peak for response rates can be observed at 57.7%. Even the most motivated person has a limit. At 151 to 227 questions, the "fatigue factor" finally outweighs the "motivation factor," and you see that 43.5% dip.

So, what’s the "ideal" number?
If you’re looking for a single magic number, I’ve got bad news: it doesn't exist. Instead, it’s a strategic choice:
- Want the highest completion rate for a quick pulse? Stick to 1 question.
- Want deep, statistically significant engagement? Don’t be afraid of the long-form.
The "ideal survey" isn't about the length alone but about matching the length to how much your audience cares.
The completion rate paradox for survey completion rates
Conventional survey wisdom says that as surveys get longer, fewer people finish them. Our data shows that isn't true. Instead of a straight line, we see a U-shaped curve.
Micro-surveys (1-5 questions), as expected, perform very well with a 77.2% completion rate. However, the Ultra-long bucket (101–150 questions) reaches a curious peak of 83%!
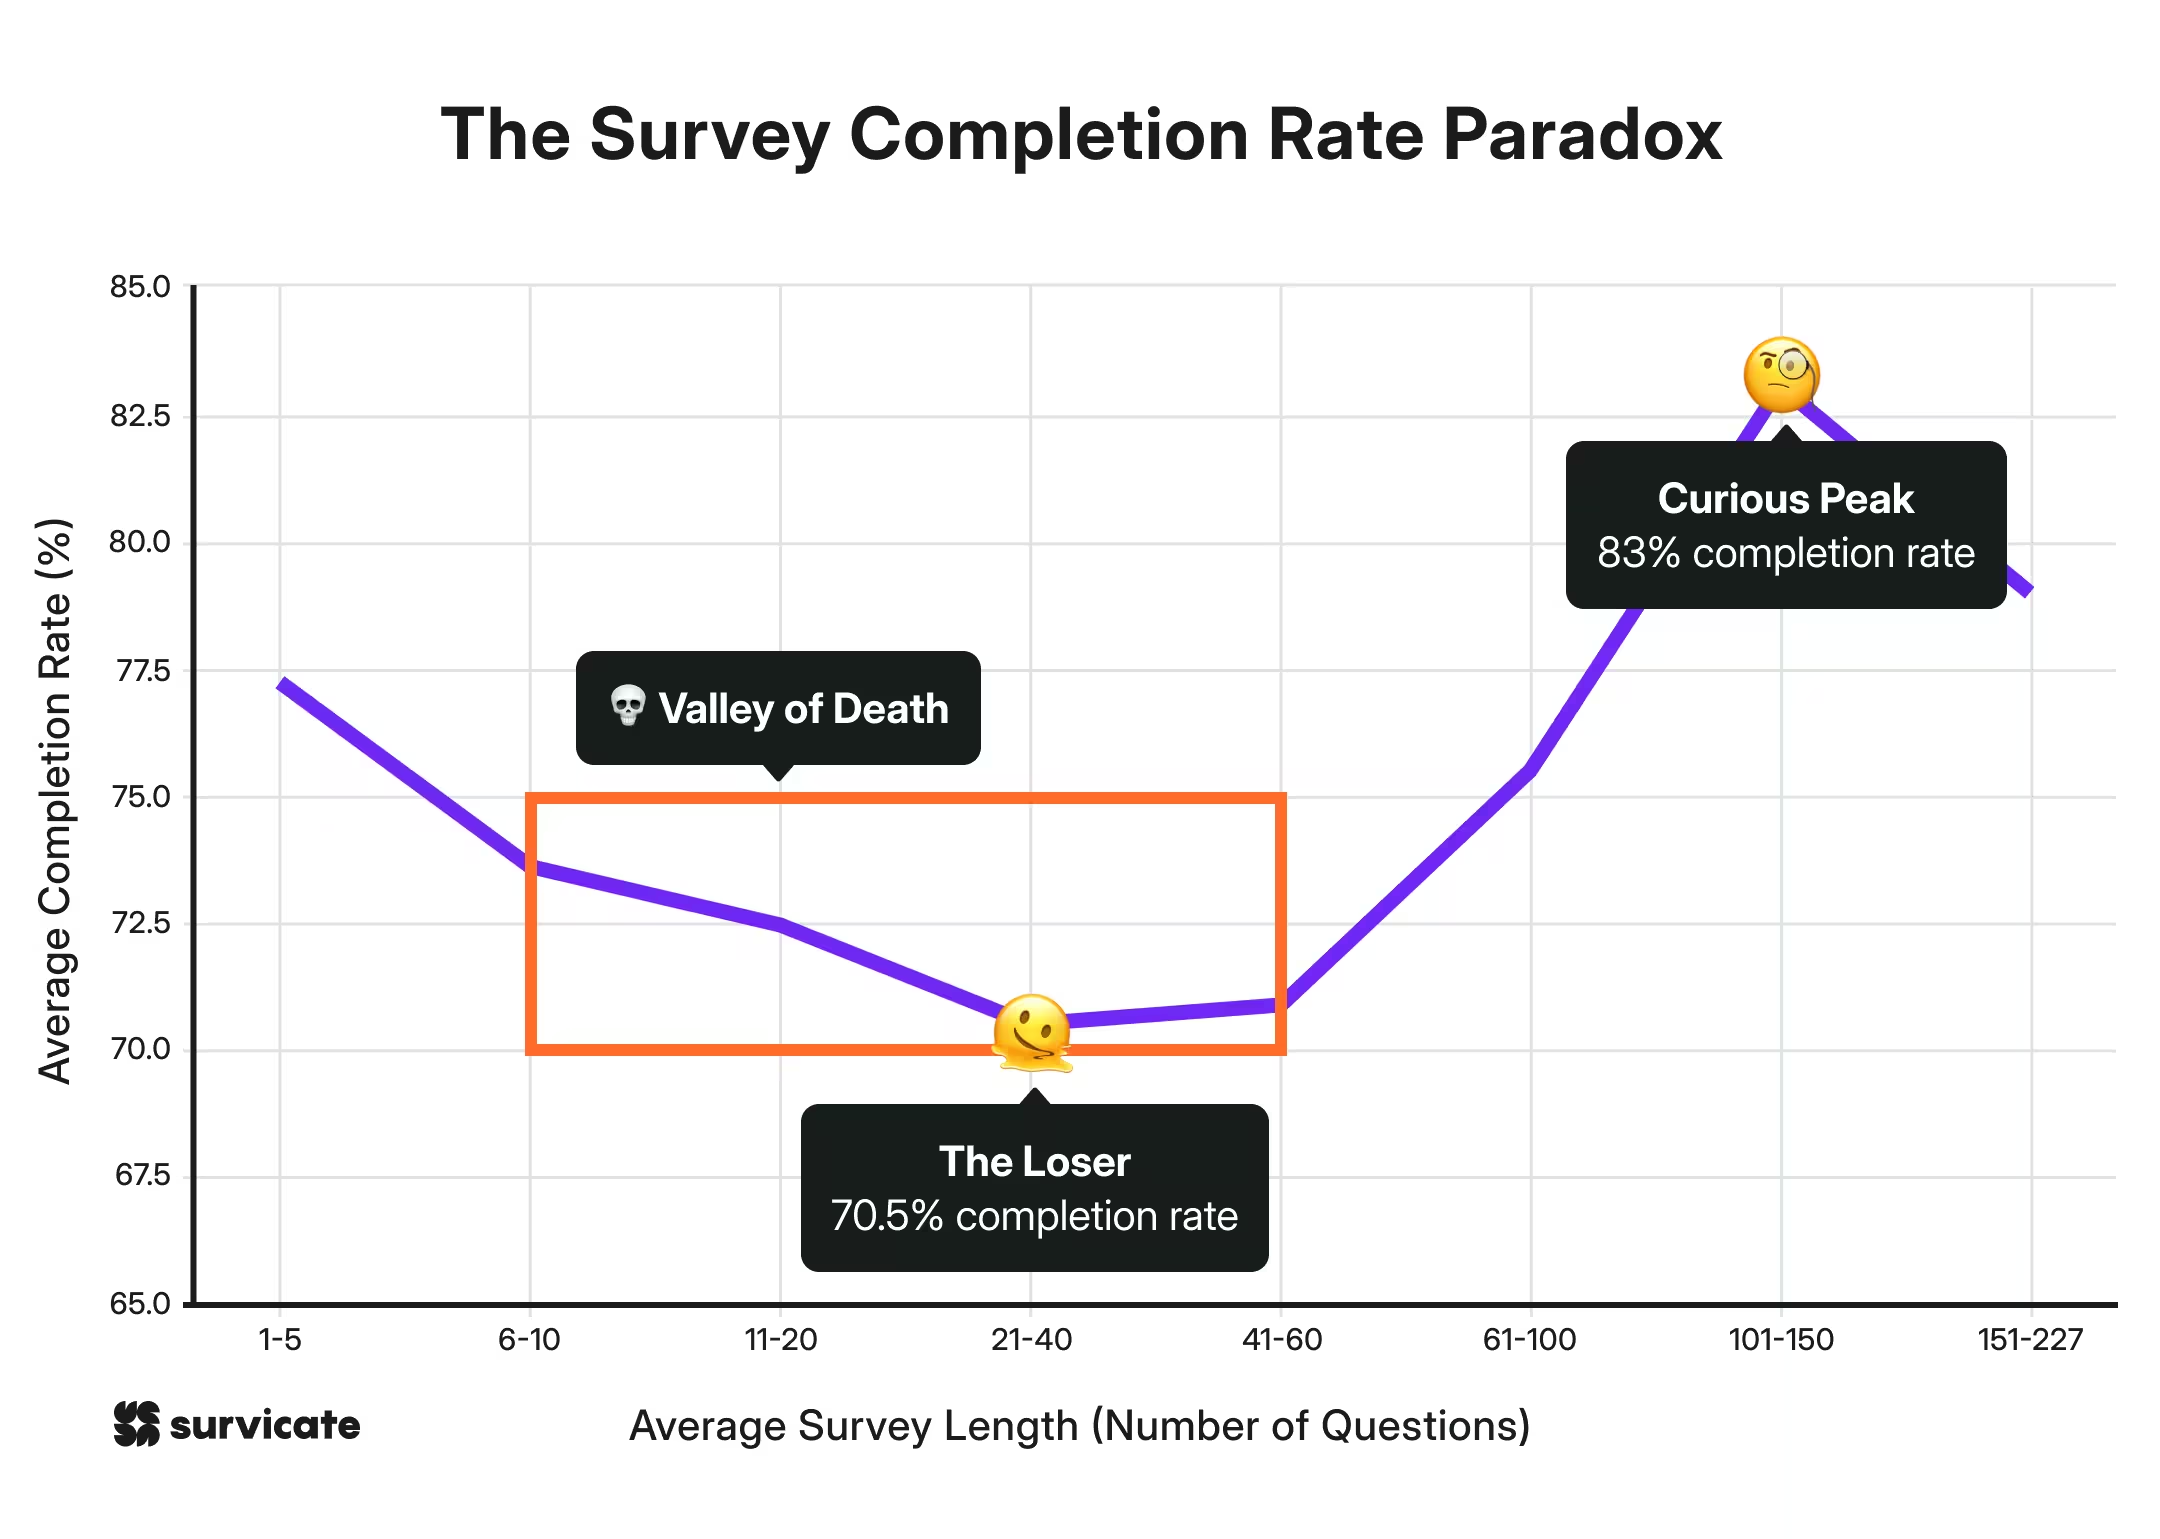
The real danger is the middle ground. Surveys between 6 and 60 questions suffer the most significant drop-off, creating a Valley of Death for engagement, where questions 21-40 mark the biggest drop at 70.5%.
It's surprising to see the 101-150 question bucket reaching both the highest survey response and completion rate, given the time dedication (even if it’s all closed-ended questions).
Surely, your mind is now in the “I need explanations, fast” phase. Let’s break this down.
Why do the extremes, i.e., 1-question & 101-150-question surveys win?
These two winners succeed for opposite reasons. Micro-surveys are successful because they are trivial to finish – there is almost no friction. No surprises here.
Meanwhile, the 101-150 question bucket wins because of respondent commitment.
By the time someone starts a survey of this length, they are already deeply invested. Why? Our data shows this is especially true in industries where people have a high emotional stake, such as Healthcare, Insurance, and even Dating Services.
In these sectors, respondents want to provide detail because they see the value in the final result (if you’ve ever had an OkCupid or eHarmony account, you’re probably nodding in agreement).
Another nifty trick? Giving respondents a heads up
Outside of emotional investment, two practical tactics help these long surveys succeed: pre-notifications and reminders.
Telling respondents that a long survey is coming their way increases the completion rate and the volume of information gathered. Now, even if they ignored the survey, then following up with a reminder could do the trick for completions.
Neither tactic appears to hurt the initial response rate, making them safe bets especially for researchers handling complex questionnaires.
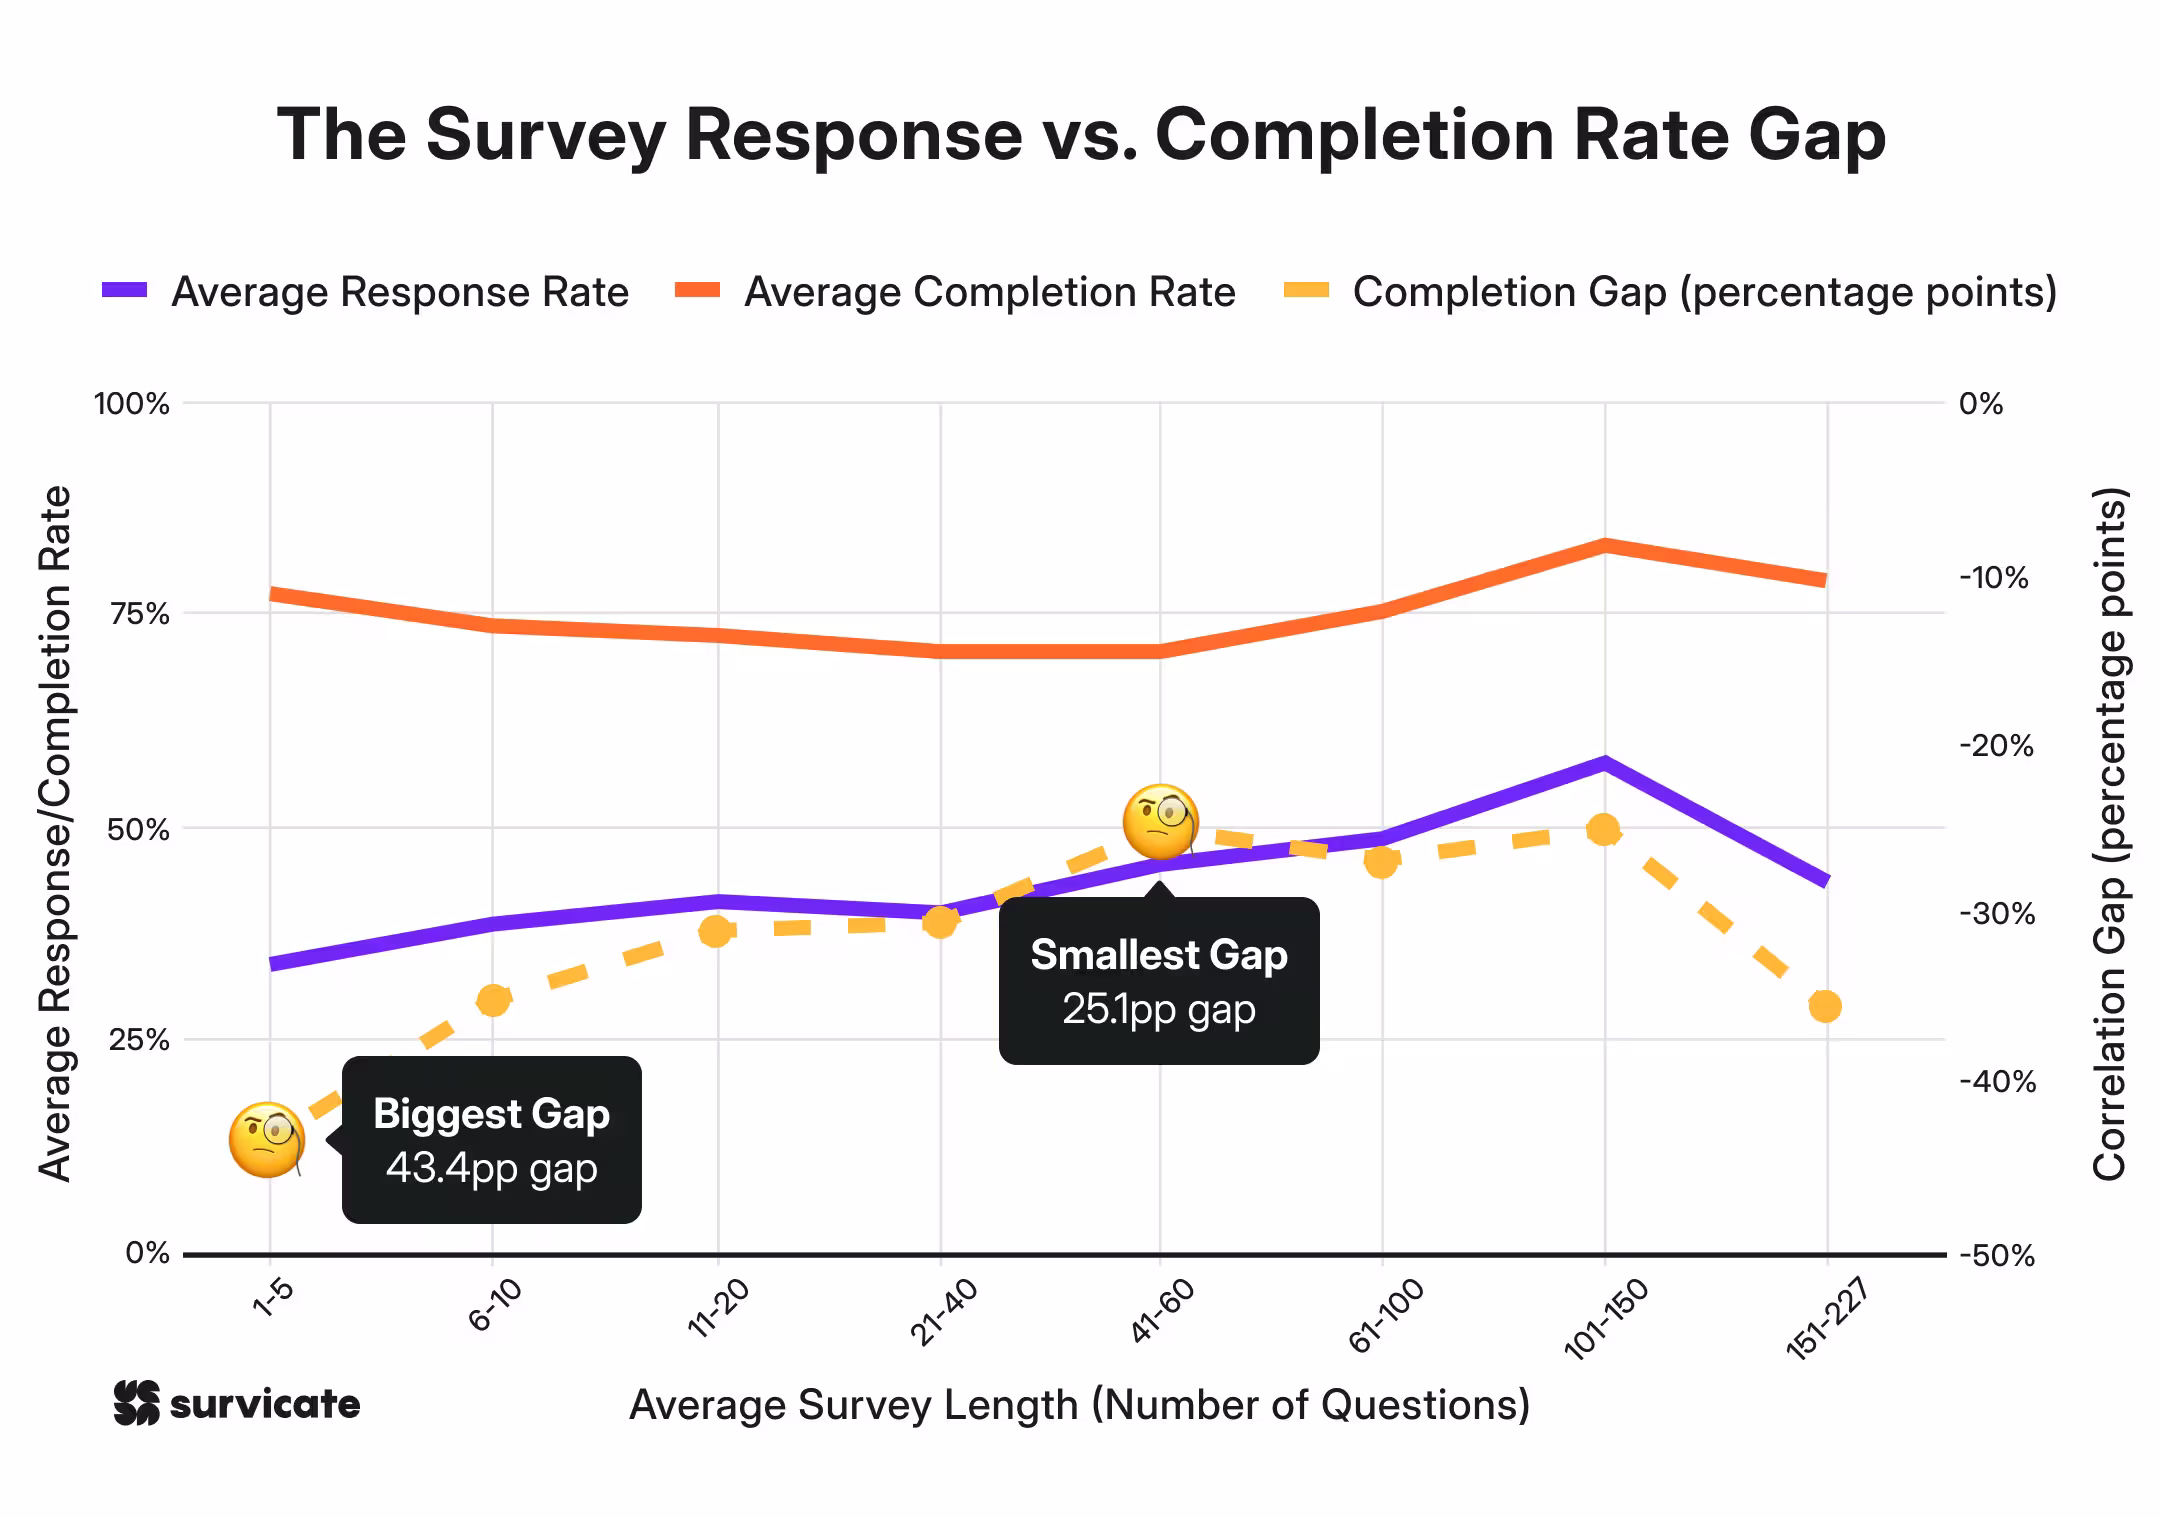
The response rate vs. completion rate gap – and what it reveals
If you’ve ever started a Netflix show only to turn it off five minutes later, you’ve contributed to a low completion rate. Surveys work the same way.
There is a massive difference between getting someone to click (response rate) and getting them to the thank you page (completion rate). When we looked at the numbers, the most shocking discovery wasn't in the long surveys – it was in the short ones.
The "casual clicker" problem
In the 1–5 question bucket, we found a staggering 43 percentage point gap between response and completion. That is the widest gap in our entire dataset.
Think about that for a second. It means that while a lot of people are willing to open a 3-question survey, a huge chunk of them bail before they even finish those three questions.
Why the high abandonment?
- Zero stakes. Short surveys are often generic. If a respondent doesn't feel a connection to the topic, they have no problem ghosting you mid-sentence.
- The "accidental" click. Because they’re short and low-effort, they attract "casual" responders who aren't actually committed to giving feedback. Such accidents frequently happen across industries, which have low emotional investment.
There is a correlation between responses and completion rates
Across the 21,863 surveys we analyzed, there is a moderate positive correlation (around 0.35–0.45) between response and completion. Generally speaking, if you can get people to show up, they tend to finish.
But that logic falls apart in the micro-survey category (1–5 questions). Here, you might have a decent response rate of 33.9%, but the completion rate swings wildly, averaging around 77.2%.
Don't be deceived by a high response rate
A high response rate on a short survey can be a "vanity metric." It feels good to see people clicking, but if 23% of them are dropping out before Question #4, your data is being skewed by the very people who care the least.
In contrast, those 100‑question marathons draw fewer "starters," but the ones who do show up often stick with it — possibly giving you enough committed responses to work with.
Industry benchmarks: why some people can’t wait to answer (and others ghost you)
Ever reflected why a survey about your last pizza delivery gets an immediate response, but a government census sits on your counter for a month?
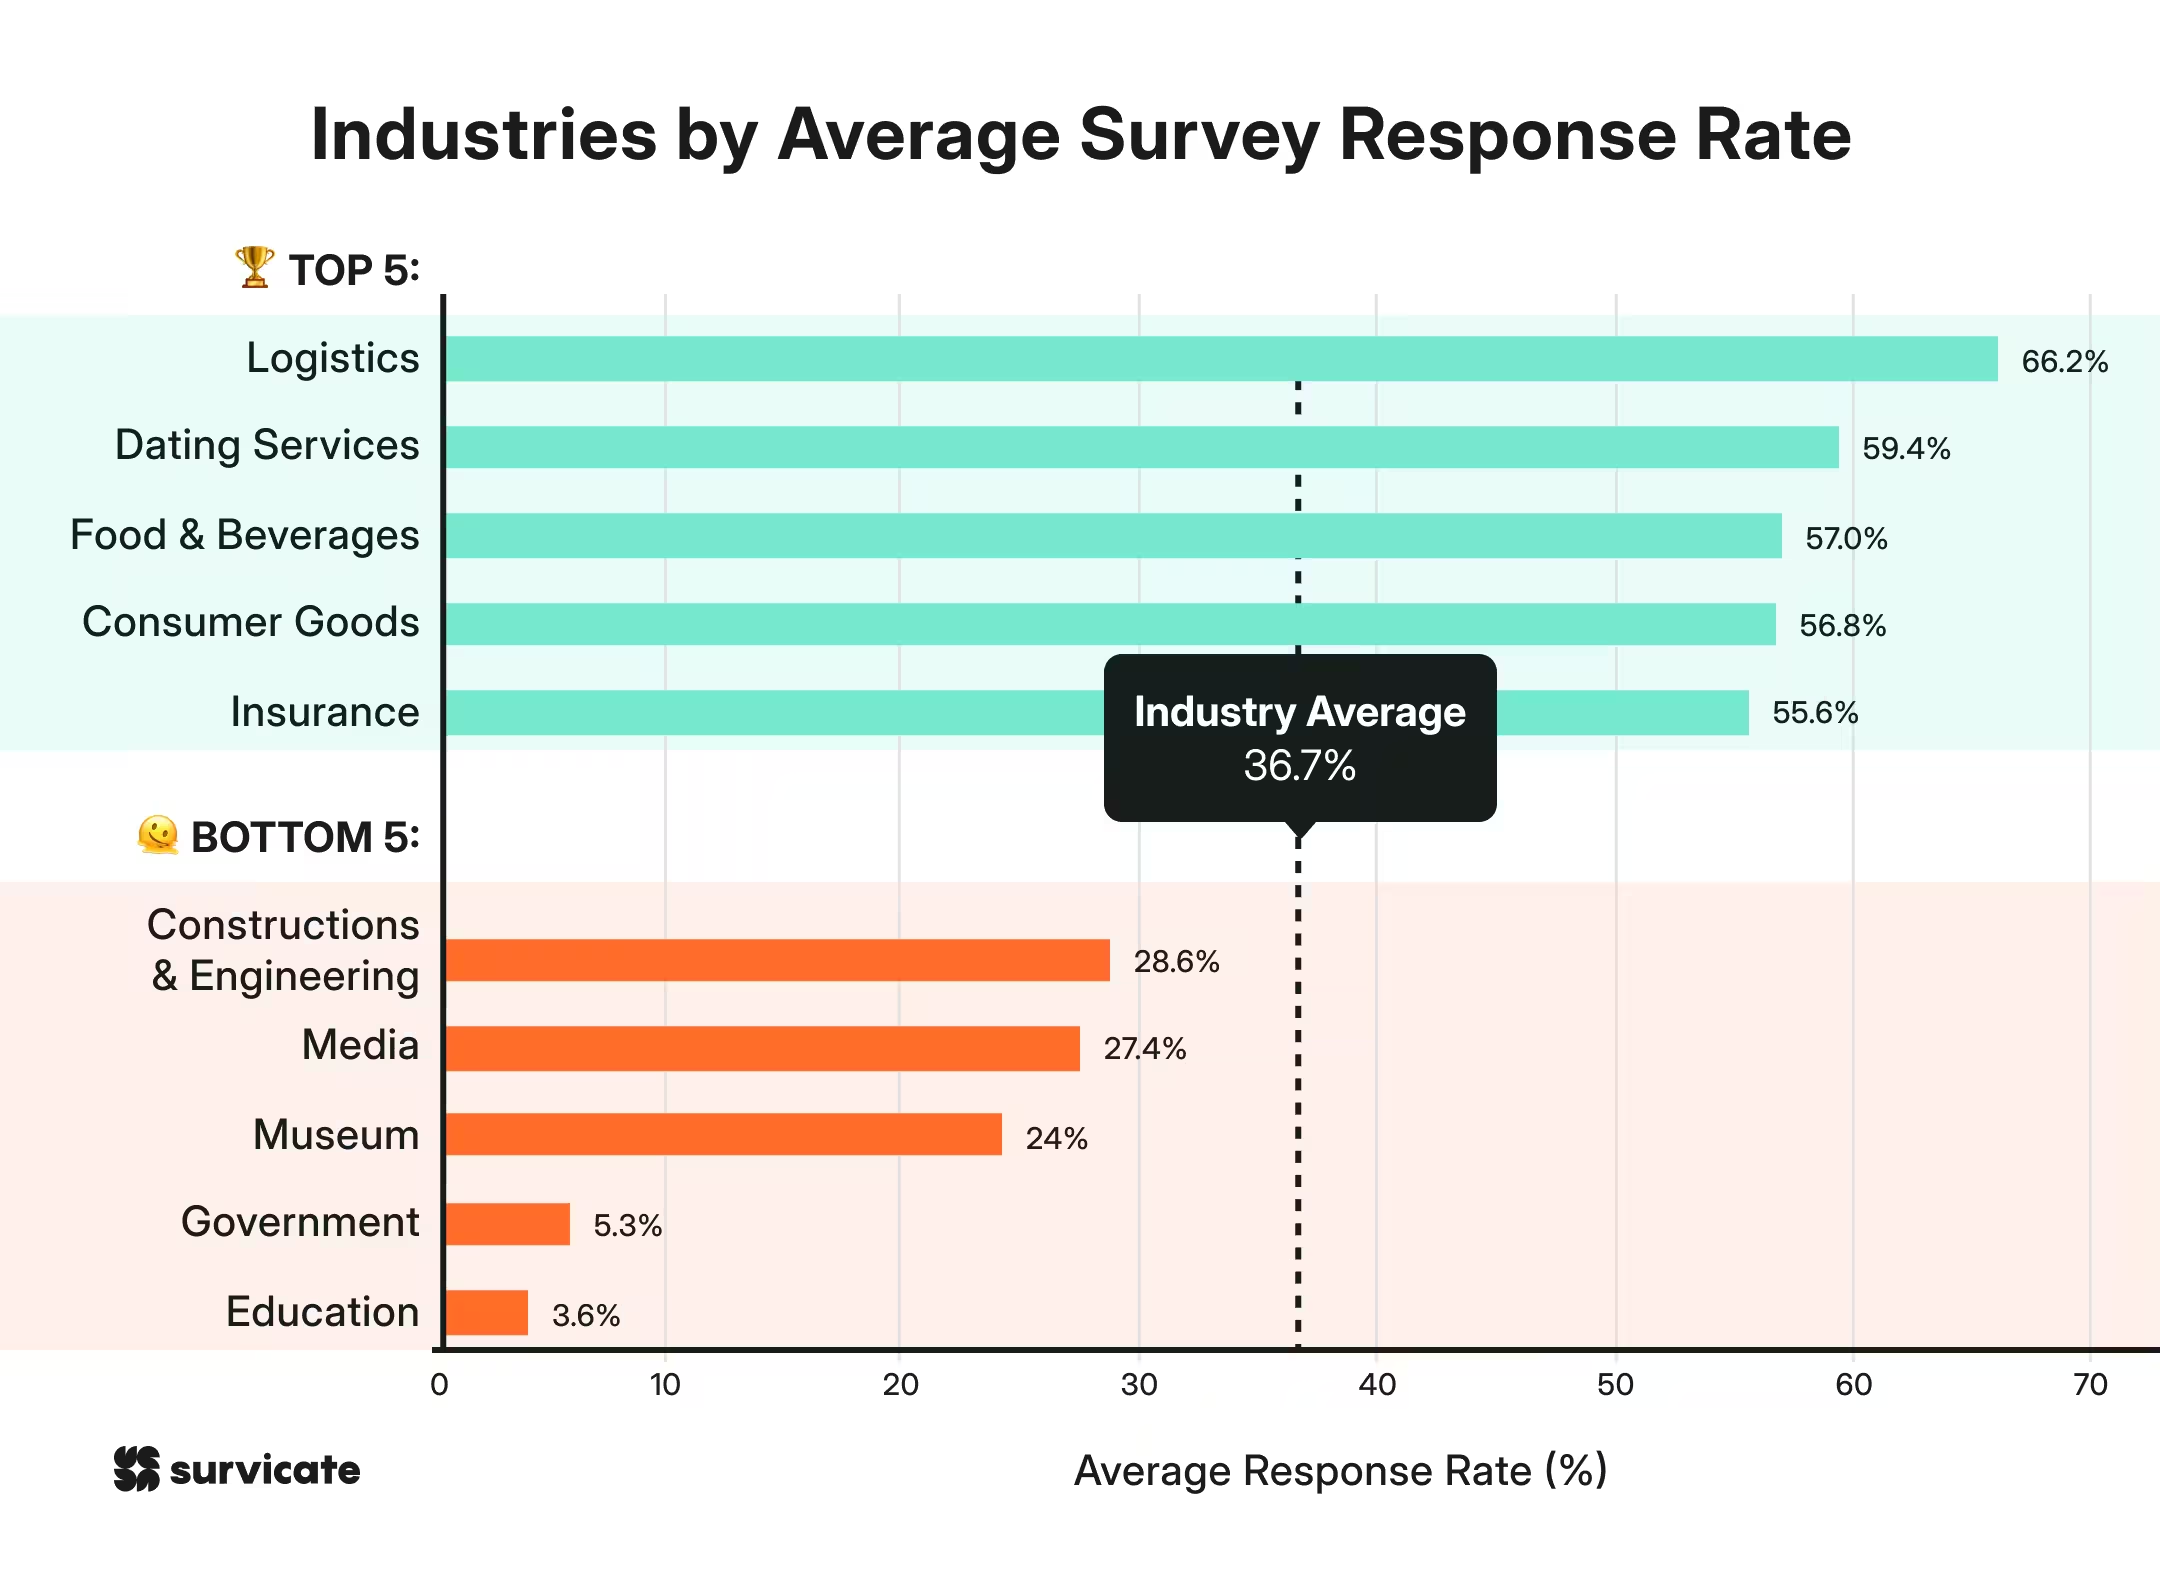
Across the board, the average industry response rate hovers around 36.7%. But that average hides a massive gulf between the "high-emotion" industries and the "bureaucratic" ones.
The heavy hitters: emotional investment wins
The top-performing industries all share a common thread, which is direct consumer impact. These include Logistics (66.2%) & Insurance (55.6%). These are high-stakes. If your package is missing or your car is totaled, you have a massive incentive to talk.
Others are:
- Dating services (59.4%). It doesn't get more personal than your love life. People have opinions on their matches.
- Food & beverages (57.0%). We are a culture of foodies. If the fries were cold or the burger delicious, we want the world (and the manager) to know.
The bottom tier: the trust & interest gap
On the flip side, industries like Government (5.3%) and Education (3.6%) struggle to break double digits. Why?
- Low stakes. Does the average person believe their feedback will actually change a local zoning law? Usually, no.
- The "homework" feel. Government and education surveys often feel like chores – dry, technical, and high-effort.
- Low trust. If you don't think your voice matters, you aren't going to spend five minutes (let alone fifty) sharing it.
Top 5 and bottom 5 industries by avg. survey response rates
The lesson for your survey
If you’re in a "low-trust" industry like Government or Media, you can’t afford to be boring. You have to work twice as hard to explain why the respondent’s time matters. Meanwhile, if you’re in Food or Dating, you’re already starting with an audience that's leaning in – don’t ruin it with 200 questions unless they are really motivated.
Industry benchmarks: why some sectors get great completion rates
We noticed that there are three distinct audience profiles in our data.
Profile 1: The Motivated Minority (low responses, high completions)
Honestly, this is the most interesting group in our opinion. They’re the people in sectors, where it is incredibly hard to get someone to open the survey, but once they do, they almost always finish it.
This group is defined by transactional or experience-based surveys. In sectors like Museums and eCommerce, the hurdle is getting past the inbox.
But why the low response rates?
A motivated minority suggests a majority may not be overtly enthusiastic - which may be true, for instance for a lot of museum visitors.
But while we do need to do a bit of guesswork here, we feel that low response rates could partly stem from technical barriers. Stricter spam filters from providers like Gmail and Yahoo often dump these invites into "Promotions" or "Spam" tabs. Even if they make it through, they have to compete with discount codes and newsletters.
If they do get past that barrier and a respondent clicks "start," the survey feels tied to a specific, recent experience – like a product they just bought or a gallery they just visited. This creates a high level of personal relevance that keeps them engaged until the end.
So, if you are in a "Motivated Minority" sector, your problem isn't necessarily your survey length. It could be your delivery method. Focus on surviving the spam filter, because your audience is already primed to give you the data once they find you.
Profile 2: High buy-in sectors
These are the over-performers where both opening and finishing the survey are high. This usually happens in industries with deep emotional investment or out of necessity of sorts.
Logistics is closely related to private or professional necessity, while Dating Service, Food & Beverages, and Consumer Goods all evoke emotional connection. Insurance carries great emotional and private weight, which is why Google classifies it as part of YMYL, i.e., Your Money, Your Life.
Profile 3: Low engagement sectors
At the other end of the scale, some sectors struggle across the board. Education surveys are the clearest example of this, seeing a 3.6% response rate (ouch) and a 54.9% completion rate - the lowest rates recorded in our global dataset. This suggests a "double friction" where respondents are both hard to reach and unmotivated to finish once they see the questions.
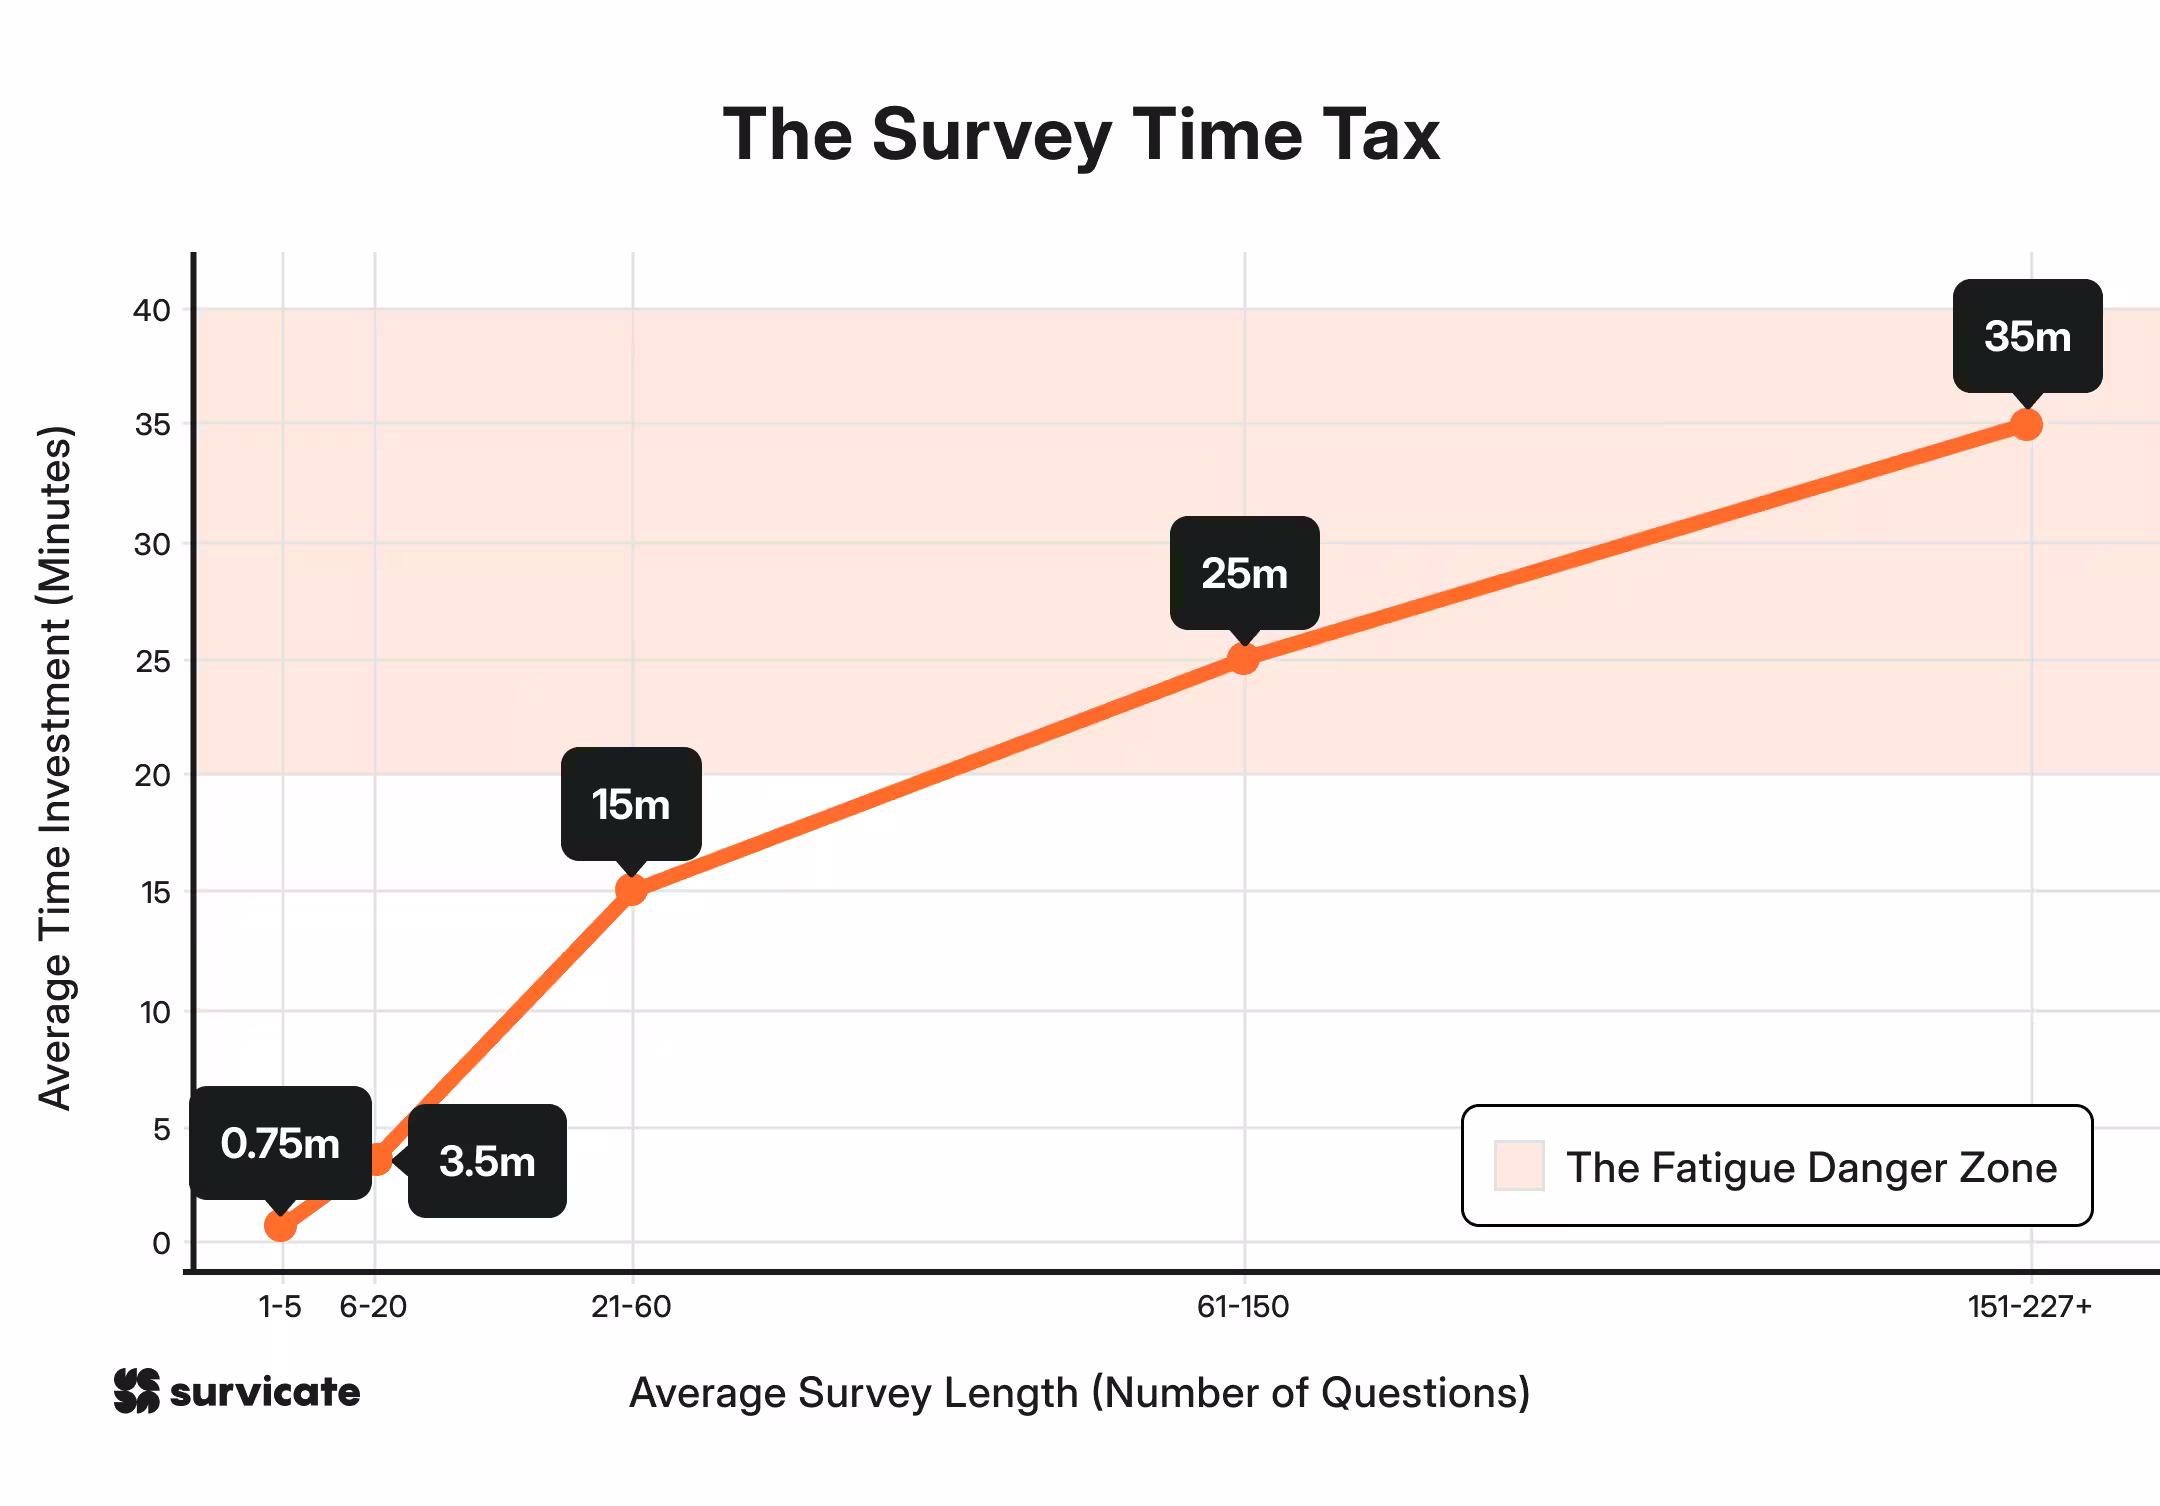
Respondent fatigue is the silent killer of good data
There is a point in every long survey where the respondent stops being a helpful participant and starts being a hostage. We call this the fatigue danger zone.
As your survey grows, the time commitment compounds. Once you cross that 60-question mark, you aren't asking for a "quick favor" anymore but for a 20-minute chunk of someone's life.
Before you hit "send," you need to know which bucket your survey falls into. If you don't set expectations, your respondents will set them for you (usually by closing the tab).
Survival tactics for the "extreme" bucket
If your research requires you to be in that 30+ minute "Extreme" zone, you have to get strategic. You can't just throw 200 questions at someone and expect quality. If you do, you’ll fall victim to "straight-lining" where the respondent just picks "option B" for every single answer just to see the finish line.
To protect your data, try chunking:
- The split-session approach. Don't send one marathon link. Send two. Do the core demographics on Monday (15 mins) and the deep-dive technical stuff on Thursday (15 mins).
- The "save and continue" lifeline: This is non-negotiable for long surveys. Let people turn a 30-minute chore into three 10-minute "micro-tasks" they can finish on their own schedule. Tools like Survicate record every single answer the moment it’s given. If a user fills out 2 out of 5 steps and then gets distracted by a cat video, you still have those first 2 steps.
- Matrix sampling (the modular trick). If you have a large enough audience, why are you sending the same 100 questions to everyone? Give Respondent A questions 1–100 and Respondent B questions 50–150. You can "stitch" the data together later using the overlapping questions. Survicate’s matrix questions allow you to group related questions into a clean, easy-to-read grid.
- Conditional Logic: Use "Skip Logic." If a respondent’s first ten answers show they don't use a specific feature, don't bore them with the next thirty questions about it! With Survicate’s skip logic, your survey adapts in real-time. If a user tells you they don't use your mobile app, they’ll never see the 15 questions about the app’s interface. The survey "prunes" itself as they go, keeping the experience lean and respectful of their time.
Pro tip: Government agencies and museums take note! Most "low-trust" industries are still sending static, 100-question PDFs or rigid forms. Moving to a custom, logic-based survey could save your response rates (and your sanity).
Sector-specific ideal survey length exists
One of the most important takeaways from our data is that there is no "universal" rule for survey length. Instead, the industry you are in dictates how much time your audience is willing to give you.
Average lengths vary wildly: Insurance surveys average just 3.8 questions, while Education and Government sit at 17.8.
Unsurprisingly, our data shows that this isn’t random. Sectors split into three distinct strategic “archetypes”.
Archetype 1: The "keep it short" sectors
In these industries, brevity is the only way to win. These audiences are high-volume and low-commitment. They will answer, but only if it’s fast. Here are five sectors that fit this definition:
What stands out for us is how tiny the median is for Insurance and Logistics – just 2 to 4 questions. The sunny side up is that these micro-surveys also get some of the highest response rates in the entire dataset.
Archetype 2: The "dare longer" sectors
These industries defy conventional wisdom. In these sectors, longer surveys actually correlate with higher response rates.
- Healthcare: A 41-60 question survey hits a 69.9% response rate – that’s nearly double the sector average.
- Retail: 41-60 questions see a 58.6% response rate (compared to just 28.9% for short versions).
- Software: The 11–20 question bucket outperforms the 1–5 bucket by 10.1 percentage points.
The Healthcare finding is the most striking. It suggests that when these audiences receive a longer survey, the context (likely clinical or compliance-driven) is so relevant to their professional life that they are pre-motivated to finish it.
Archetype 3: The "length doesn’t save you" sectors
For some industries, the relationship between the organization and the audience is the problem, not the number of questions.
- Government: Averages a sad 5.3% response rate. Even at its "optimal" length, it only peaks at 8.8%.
- Media: Stays relatively flat (19–33%) regardless of how many questions are asked.
For “Government” specifically, no question-count strategy can rescue the response rate. The issue is structural.
There’s no subtle way to say this: if you don't customize the experience, through testing formats or "chunking" your questions, you will lose these respondents entirely.
The under-surveying trap
Most companies default only to short surveys because they’re afraid of annoying their customers. But our data shows a massive gap between what industries are actually doing and what actually works.
In sectors like Retail and Healthcare, "short and sweet" isn't always delivering optimal results.
- Retail – 42% of retail surveys are only 1–5 questions long, yielding a mediocre 28.9% response rate. But when Retailers go deeper (41–60 questions), that rate skyrockets to 58.6%.
- Healthcare – 45% are micro-surveys, yet the peak performance doesn't happen until the 41–60 question mark.
- Software – 27% of software surveys stick to the 1–5 question bucket (30.2% response rate), but for 6–10 question surveys, the response rates jump to 36.7%.
The gold stars: perfectly calibrated
On the flip side, some industries have found their "Goldilocks" zone and stayed there:
- Insurance – 86% of their surveys are 1–5 questions, which perfectly matches their peak response rate of 57.9%.
- Logistics – They’ve nailed it. 80% of their surveys are in the 1–5 question bucket, which earns them a massive 73.1% response rate.
Don't just follow the "short is better" trend blindly. Look at your industry.
If you're in Retail or Healthcare, your audience might actually be more willing to talk than you think – if you give them the right platform.
Very important – completion time adds another layer
It turns out, some questions are "heavier" than others. While a Fintech or IT user breezes through questions in about 3–4 seconds, the Education and Government sectors are seeing a massive 100 seconds per question.
This isn't apples-to-apples. Government surveys often involve complex, multi-part institutional questions, while tech users fly through low-friction, closed formats. Complexity matters as much as count, so don't just count your questions – weigh them.
Length matters far less than your target audience
The "perfect" survey length is a ghost – it doesn’t exist. Instead of hunting for a magic number, focus on your audience. Based on our data, these are the 5 key survey challenges to be mindful of when creating a survey:
- The Valley of Death: Surveys between 6 and 60 questions suffer the most significant drop-offs in completion rates.
- The Casual Clicker Problem: Surveys between 1–5 questions see the highest percentage point gap between response and completion rates.
- Low engagement sectors: Education, Manufacturing, and Government typically struggle with both response and completion rates.
- The Survey Fatigue Danger Zone: Surveys with more than 60 questions lead to an average completion time of over 20 minutes.
- The Keep it Short Sectors: Sectors like Insurance, Food & Beverages, and Logistics tend to create too long surveys with suboptimal completion rates.
When you cut a retail conversation too short or make a delivery check-in a marathon, you lose. Instead, take advantage of smart survey logic, respect the "time tax," and align your questions with your industry’s unique pulse. Happy surveying!


.svg)

.svg)


