
You don’t need another vague post about “delighting customers.”
You need to know how to measure customer satisfaction—reliably, efficiently, and without wasting your time.
Why? Because customer satisfaction isn’t just about making people happy.
It’s about retention, revenue, referrals, and product decisions you won’t regret later.
Most teams ask for feedback and stop there.
This guide shows you how to:
- Ask the right questions in the right channels,
- Use CSAT, NPS, CES, and open-text feedback the way they were meant to be used,
- Then, analyze responses without drowning in spreadsheets,
- And most importantly, turn feedback into action and improve customer satisfaction as a result (automatically, if you’re smart about it).
If you’ve ever wondered whether your users are one bug away from churning or one nudge away from becoming promoters—you’re in the right place.
Let’s get into it.
Article overview: frequently asked questions
What is customer satisfaction?
Customer satisfaction is the degree to which a product or service meets (or exceeds) customers’ expectations. Since it’s a mix of emotion and logic—how easy, fast, and pleasant customers feel about the experience—understanding customer satisfaction may be difficult at first.
Why is customer satisfaction important?
Because it directly impacts retention, revenue, and referrals. Happy customers stick around, spend more, and recommend you. Unhappy ones churn quietly or complain loudly.
What affects customer satisfaction?
Customer satisfaction is influenced by both standard experiences and subtle perceptions. On the surface, it’s shaped by how easy something is to use, how quickly users get value, how responsive the customer service team is, and whether the product meets their expectations.
But satisfaction also hinges on more indirect factors—like your public reputation, how you communicate changes, and how customers see you treat others.
Which customer satisfaction metrics should you track?
Focus on the four essentials:
- CSAT – How satisfied users are with a specific interaction
- NPS – How likely they are to recommend you
- CES – How easy it was to complete a task
- Open-ended feedback – Why they feel the way they do
How to measure customer satisfaction?
Ask the right questions (CSAT, NPS, CES) at the right time—in-product, via email, mobile, or chat. Pair scores with open feedback, segment responses, and track trends over time.
How to close the feedback loop?
Act on what you learn. Thank promoters, follow up with detractors, share insights across teams, and automate campaigns or workflows based on feedback. The goal: show customers their voice actually drives change.

Key customer satisfaction metrics overview
TL;DR score cheat sheet
What is customer satisfaction? A quick dive into theory
Customer satisfaction seems like a simple concept—until you try to define it. As researcher Richard Oliver once put it, “Everyone knows what [satisfaction] is until asked to give a definition. Then it seems, nobody knows.” Source
Over the years, academics have debated whether satisfaction is primarily a cognitive judgment (based on expectations and logic) or an emotional reaction (based on how the experience felt). In reality, it’s both.
Marketing researcher Joan L. Giese summed it up neatly in her study, identifying three overlapping elements among different definitions:
👉 a response,
👉 tied to a specific focus (like a product or service),
👉 evaluated at a particular time.
Later in 2015, Professor Gianluigi Guido expanded on this with what’s now the leading interpretation: the disconfirmation paradigm. In short:
Satisfaction = the gap between what customers expected and what they experienced.
If the product meets or exceeds expectations, satisfaction is high. If there’s a mismatch—disappointment follows.
Most modern marketing definitions now align with this:
Customer satisfaction is how well your product or service meets—or surpasses—customer expectations. Source
It’s part rational, part emotional. And while that complexity can make it feel hard to measure, it’s absolutely possible to track. We’ll show you exactly how.
Why customer satisfaction really matters?
According to the definitions set above, good customer satisfaction means we’ve either met customer’s expectations or even better, exceeded them.
Which is going to affect our business in a positive way (or negative if we didn’t meet the set expectations).
This means:
- Customers leaving positive (or negative) reviews on our listings, whether G2, Google Business Profile, App Store, Trust Pilot, and more,
- Customers recommending our products or services (or not recommending) to others via word of mouth,
- Customers raving (or not) about our business, products or services, on social media and web forums, whether it’s deep in LinkedIn comments, Reddit threads, Quora, or Facebook,
- And most importantly, those same customers either remaining in the business, making further purchases, or worse, churning if they’re not satisfied directly impacting our revenue.
Therefore, customer satisfaction is not a feel-good metric. It’s a direct line to three things that matter most to any business: retention, revenue, and referrals.
1. Retention: satisfied customers stick around
Happiness doesn't drive customer churn. That’s because happy customers keep using your product, renew their subscriptions, and cost you far less to retain than to replace. Dissatisfied users? They vanish silently—or worse, leave negative reviews without a warning.
💡According to research by Harvard Business Review, increasing customer retention by just 5% can boost profits anywhere from 25% to even 95%.
2. Revenue: it costs less to sell to happy users
Satisfied customers are easier to upsell and cross-sell to. You’ve already earned their trust. They’re more likely to try new features, adopt premium plans, or expand their usage without a lengthy sales cycle.
💡U.S. companies could save over $35 billion per year by focusing on keeping their existing customers happy.
3. Referrals: happy customers market your product for you
Every promoter is a potential brand advocate. They share your product in Slack channels, mention you on social media, recommend it to their peers, or leave glowing reviews that influence new buyers. Word of mouth doesn’t just happen—it’s earned through high satisfaction.
Customer satisfaction isn’t just a metric, though—it’s a decision-making tool. When you measure it right, it becomes your internal compass.
- Not sure which feature to build next? Let feedback guide your priorities.
- Wondering if onboarding is working? Ask your users directly.
- Debating a risky roadmap move? Gut instinct ≠ evidence.
Track satisfaction early, and you stop guessing across product, support, marketing, and beyond.
What affects customer satisfaction?
Customer satisfaction usually comes down to three things: how easy something was to do, how fast customers got what they needed, and how they felt while doing it.
If your product is confusing, support is slow, or the experience feels frustrating, satisfaction drops fast. On the flip side, clarity, speed, and a little human touch go a long way.
Does dissatisfaction spread to other users?
Yes—and fast. Even if someone’s personal experience with your brand is great, seeing public backlash can erode their trust.
Besides just poor customer service or poor customer experience, negative reviews, social media outrage, or bad press can influence how others feel before they’ve had a single issue themselves.
Take Duolingo. Known for its wildly successful TikTok presence and loyal user base, the brand recently faced backlash after an internal email announcing a shift toward AI-driven content creation. One line in particular—“We'll gradually stop using contractors to do work that AI can handle”—sparked widespread criticism.
Despite clarifying that this wouldn’t replace employees, users weren’t convinced.
The fallout hit fast: LinkedIn posts flooded with angry comments, users calling out hypocrisy under employee-friendly posts, and even creators ending years-long learning streaks in protest.
Like recently under a post Duolingo made about how they care about their employees and are all for them taking time off when they need to, without having to justify it, all tied with a hashtag #onlyatduolingo.
The comments on that post? As you can imagine, everyone’s bringing up replacing contractors with AI, not having the sudden image bettering post.
You can read the whole post here, but don’t forget to grab some popcorn while you’re at it. 🍿
The lesson? Dissatisfaction doesn’t just affect one user—it can ripple through your entire community and damage brand perception overnight.
Which customer satisfaction metrics to track?
Focusing back on measuring customer satisfaction, besides bad PR or viral moments like Duolingo’s one, it’s mostly about tracking standard metrics and improving the regular factors that impact satisfaction we mentioned earlier.
Mainly: the customer’s experience with your product or service and their expectations towards it.
So which standard metrics can you track and how to not lose yourself in the data?
We’re here to tell you.
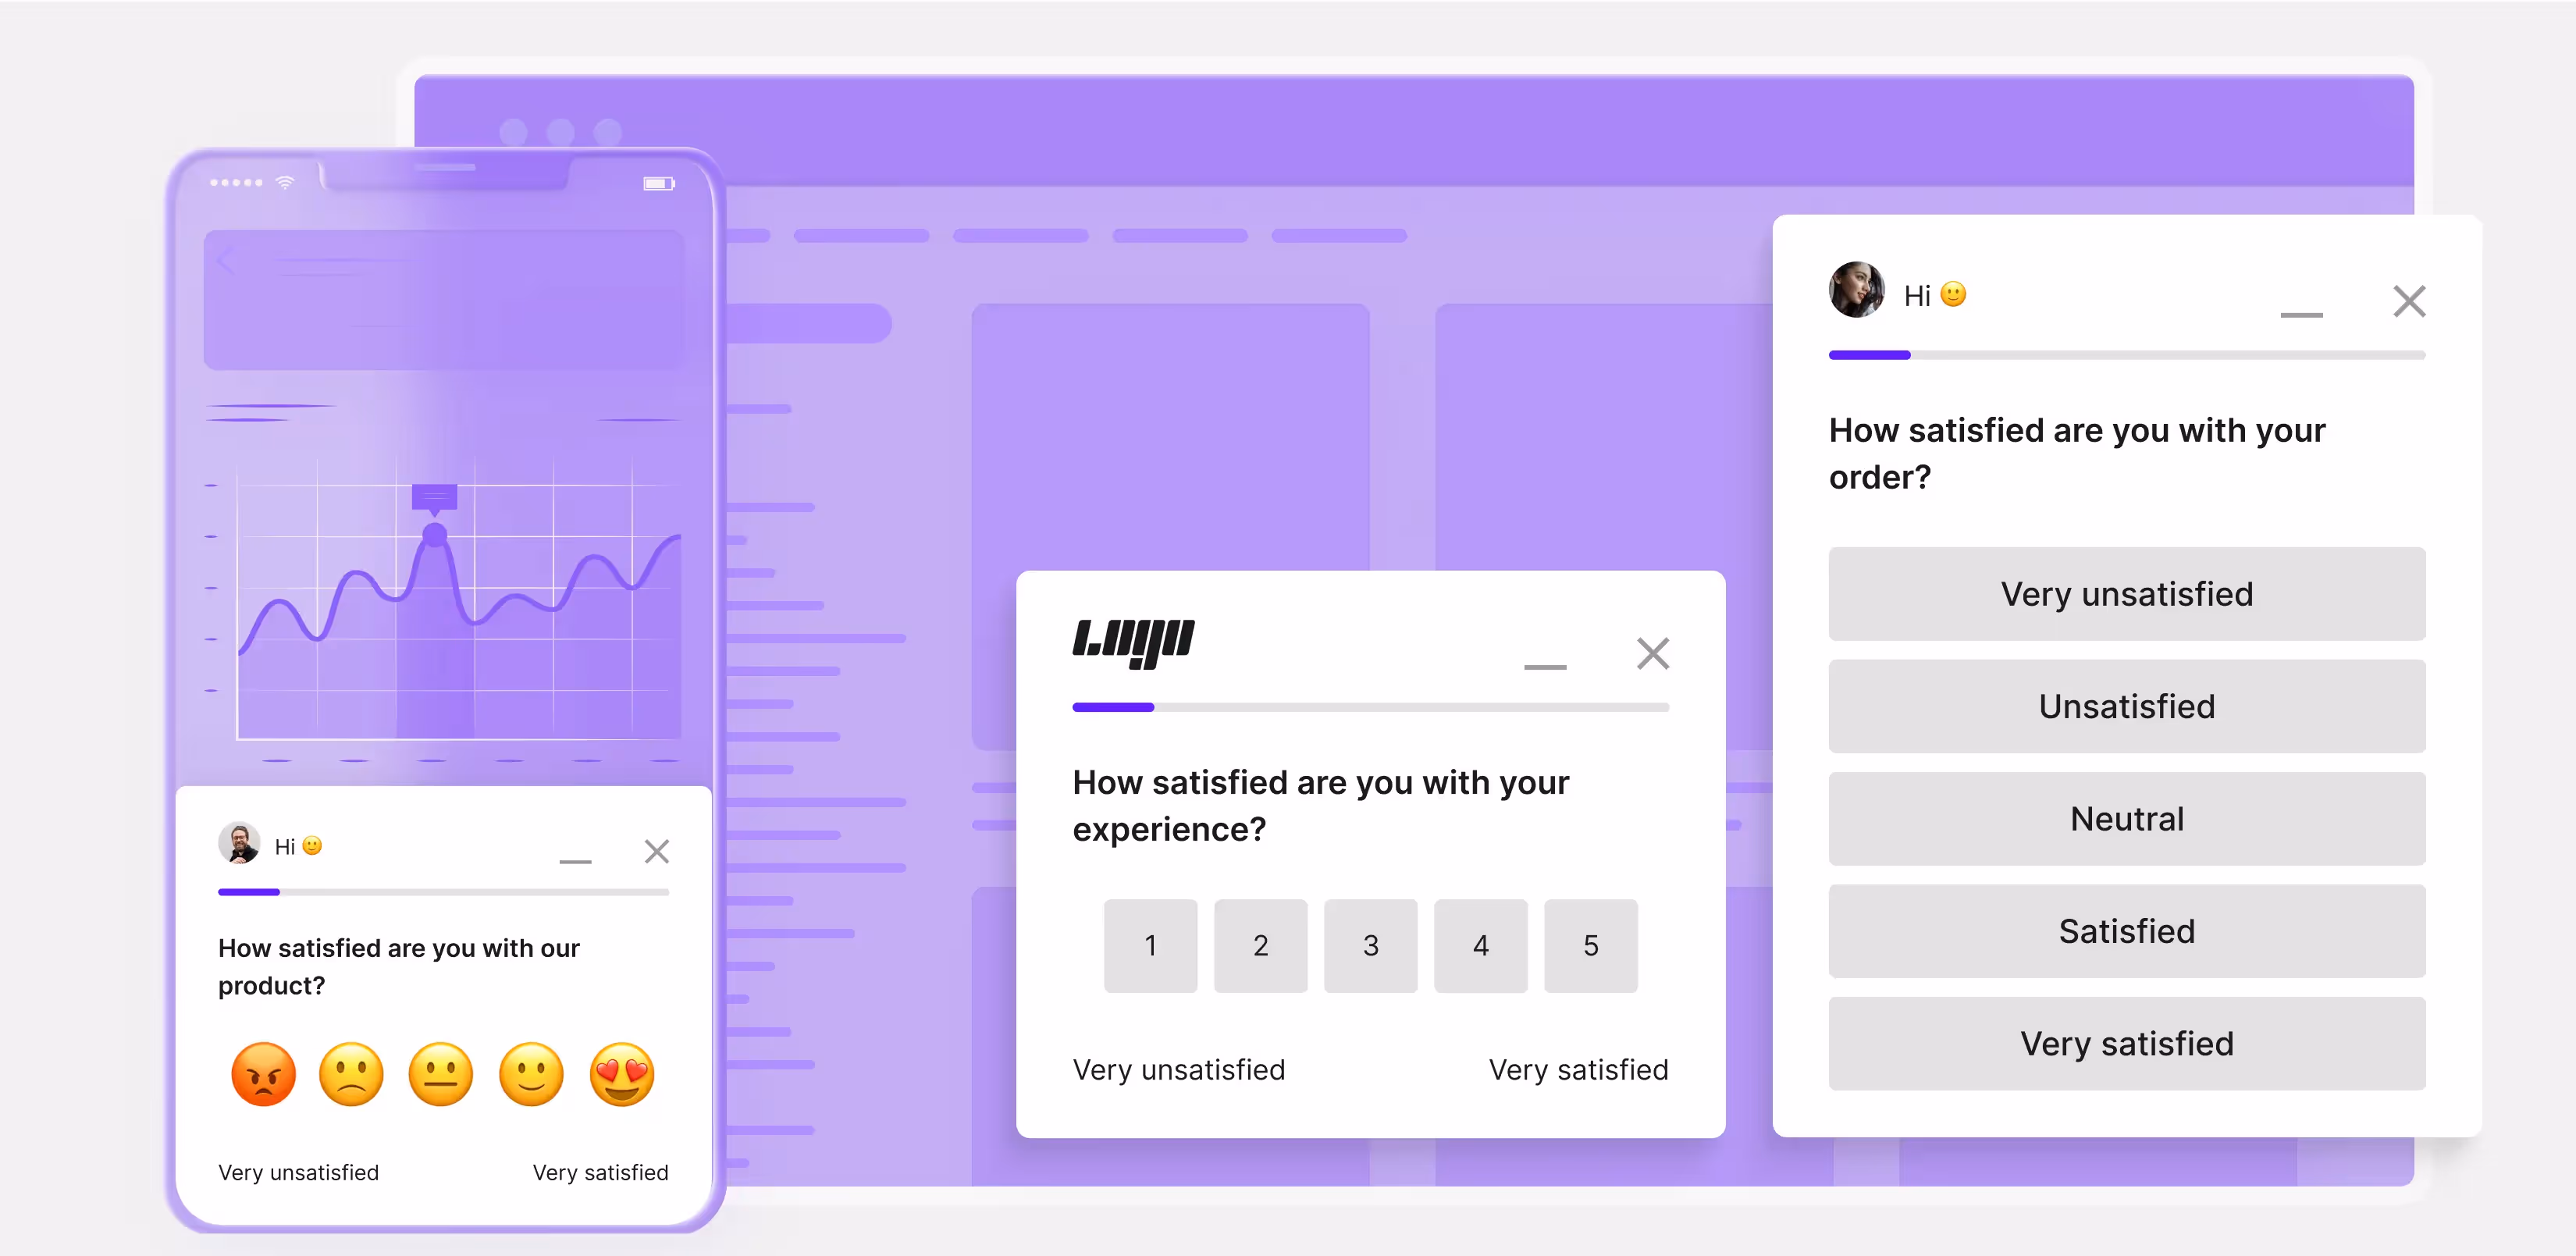
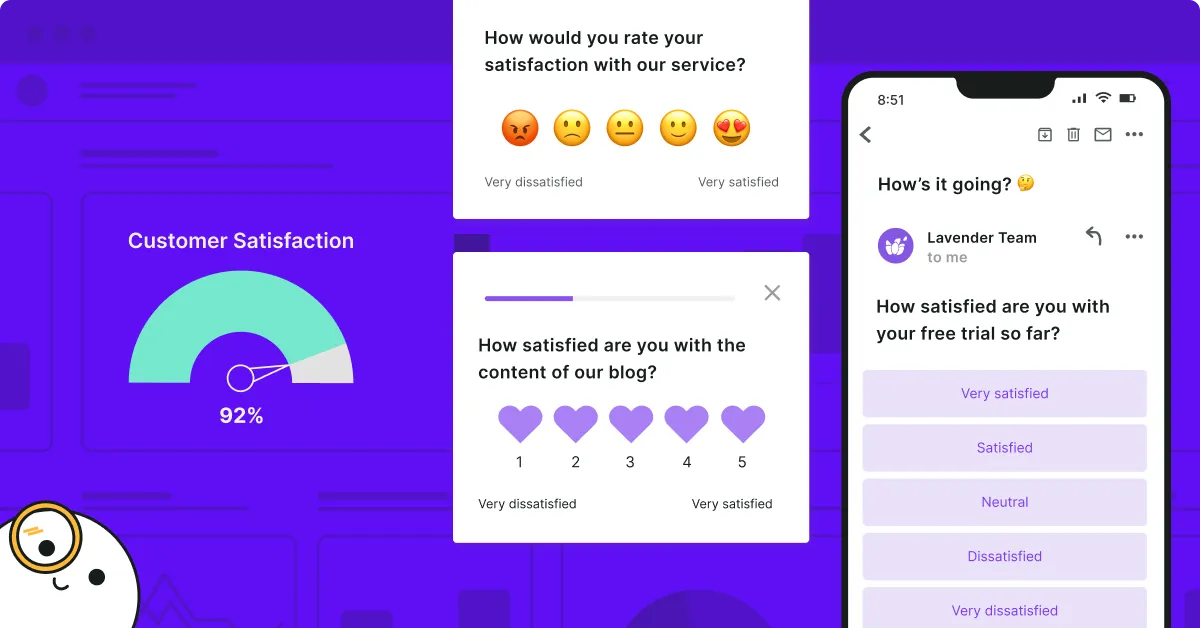
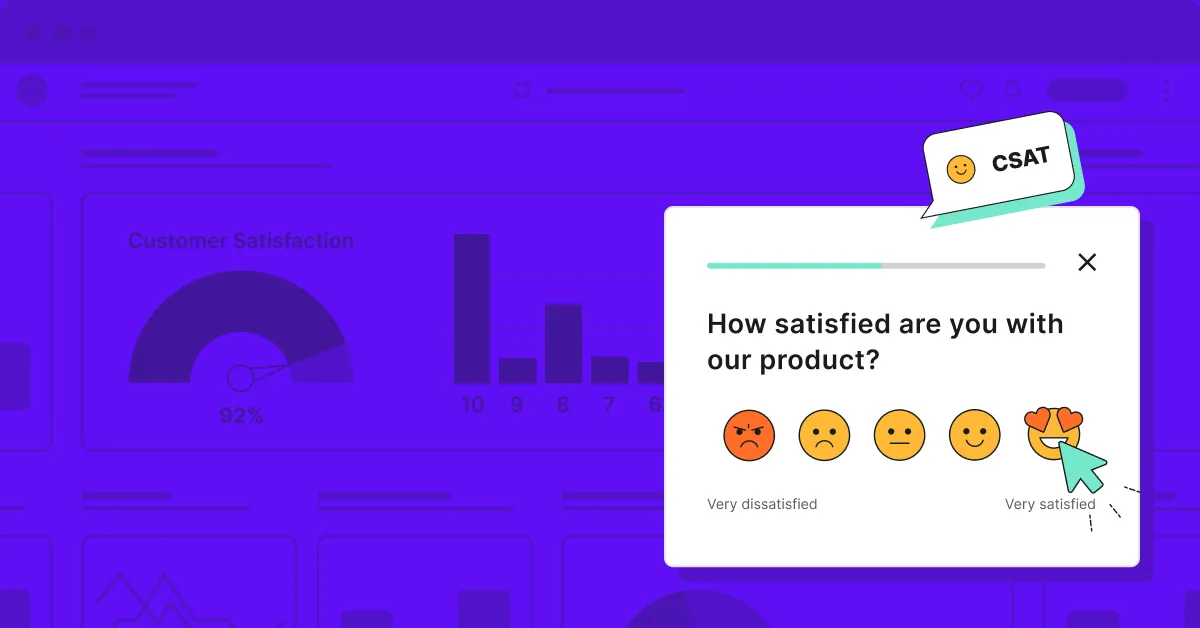
1. Customer Satisfaction Score (CSAT)
What it is:
CSAT is a survey containing a simple question of “How satisfied are you with [product/support/experience]?”—usually rated 1–5 or 1–10.
💡It gives you instant, targeted feedback at key moments (e.g., after a support chat, purchase, or feature use). It’s short, clear, and easy for users to respond to. Watch for spikes and dips. Filter by team, touchpoint, or feature to find where satisfaction drops.
Pro tip:
Pair the standard CSAT question with an open-ended one, like “What could we have done better?” for richer insights.
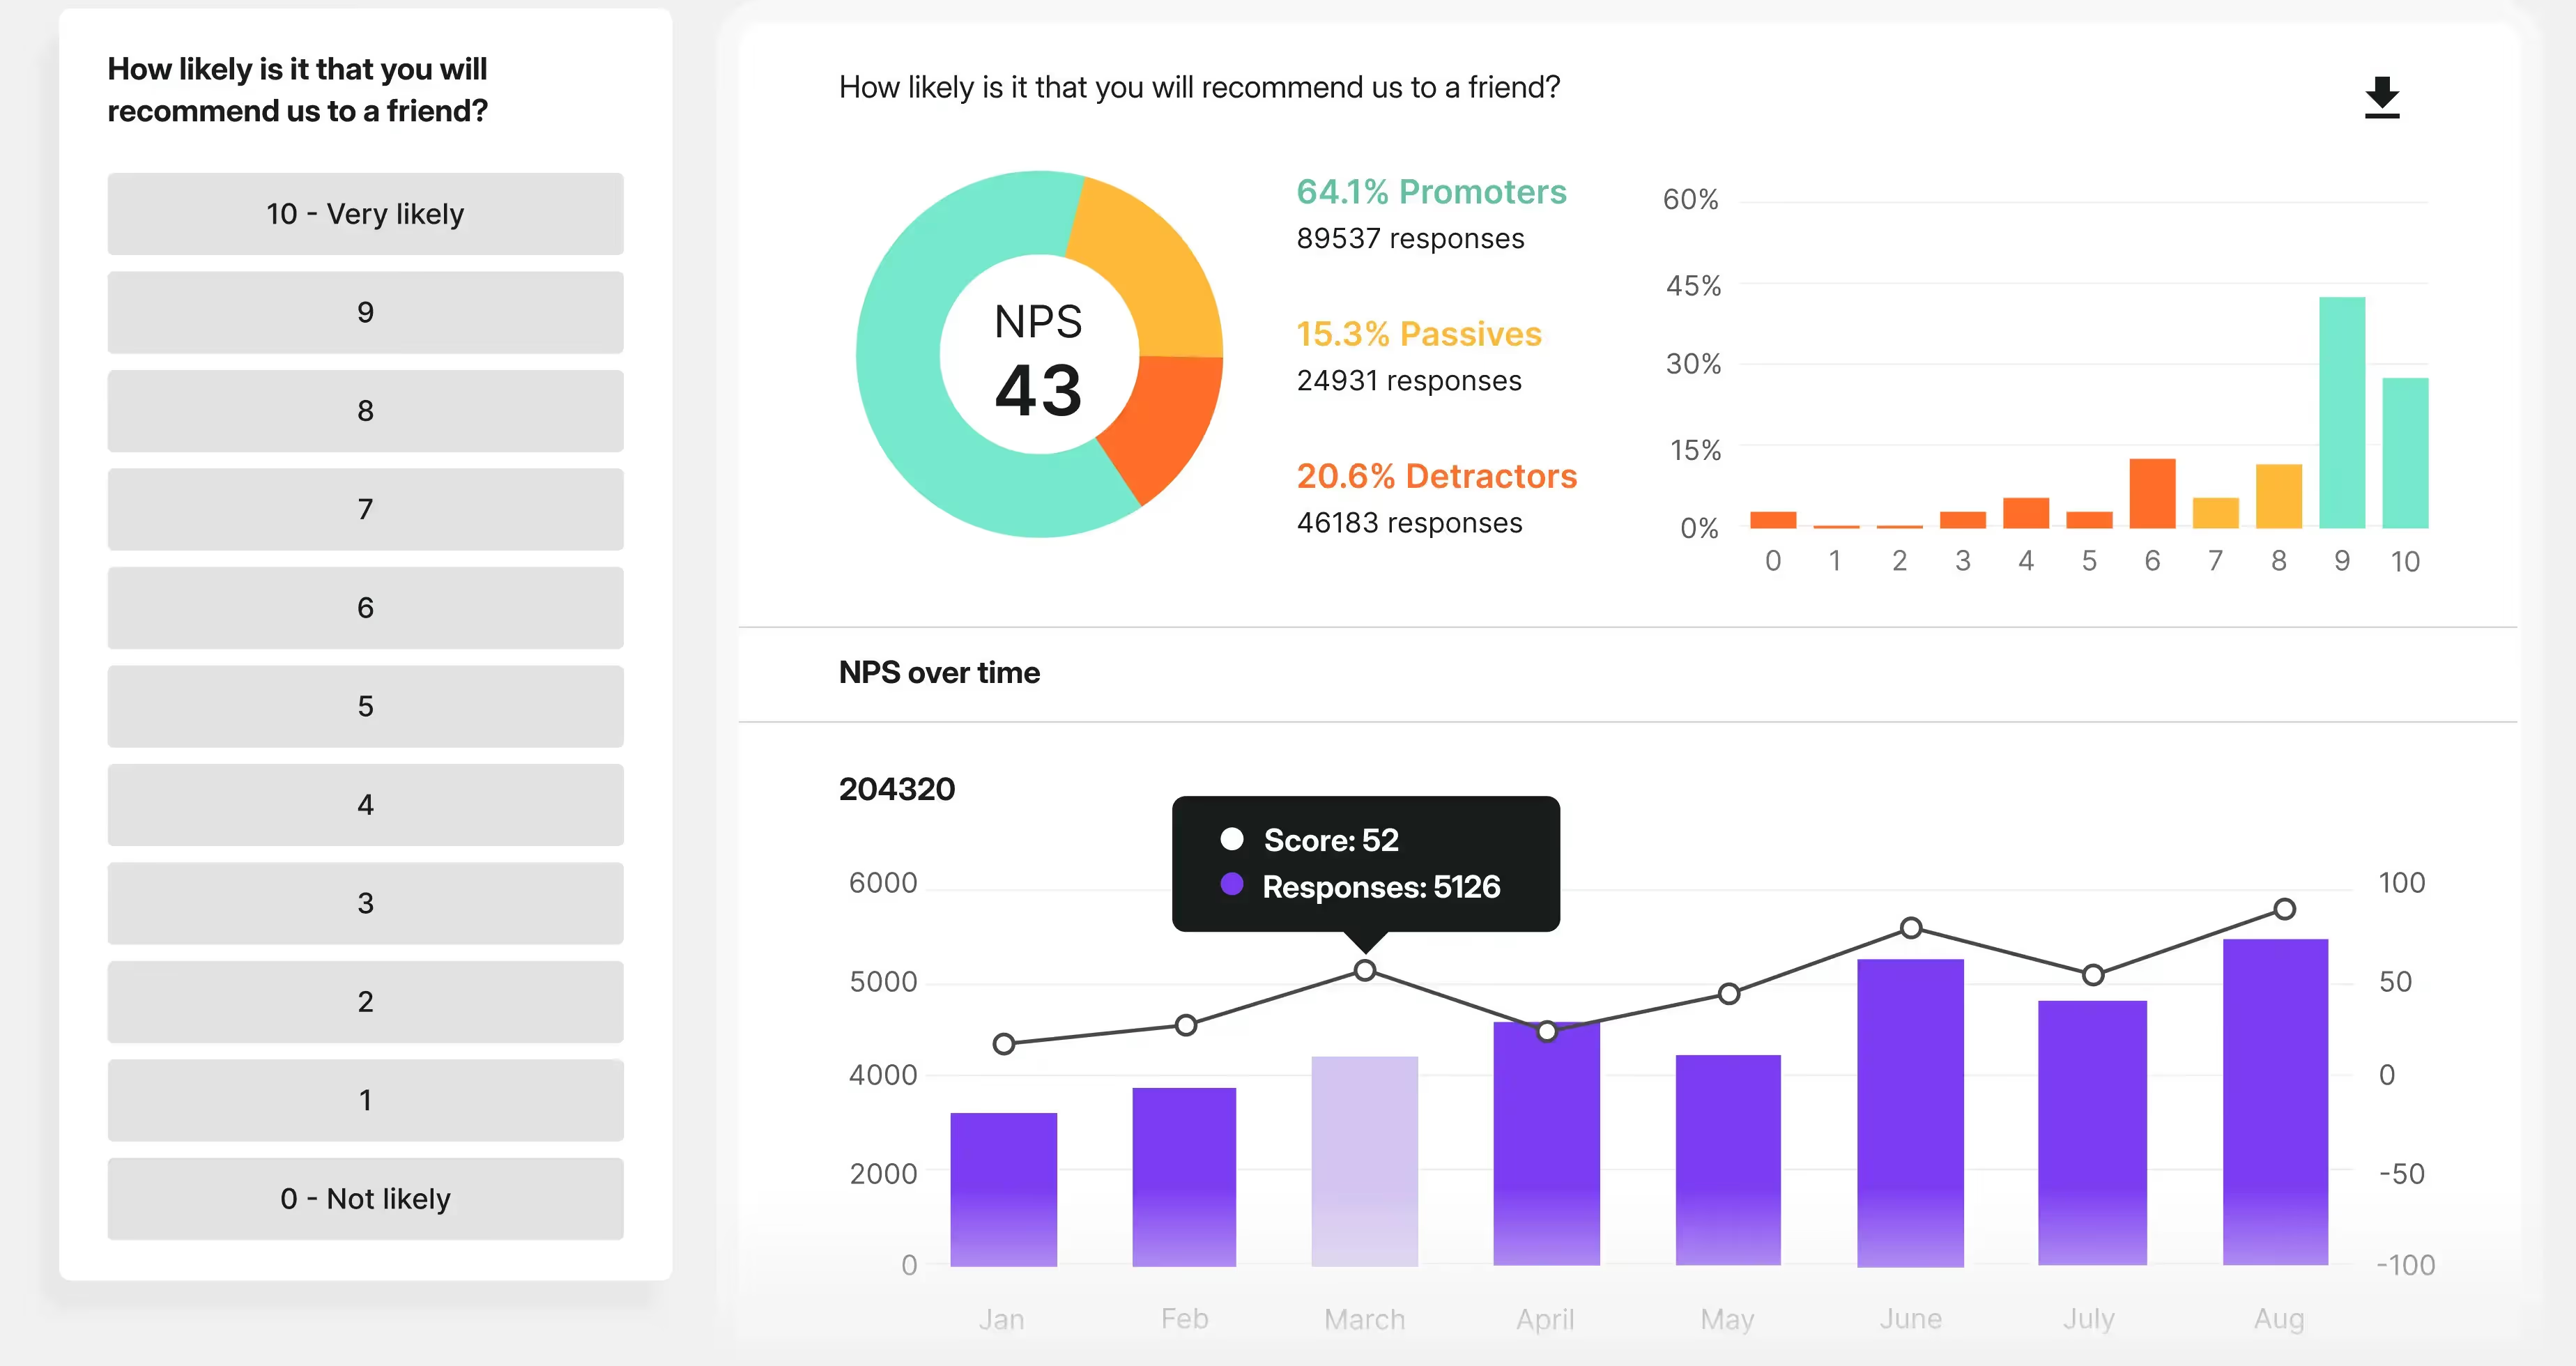
2. Net Promoter Score (NPS)
What it is:
Net Promoter Score (NPS) is the metric that helps us gauge customer loyalty. It asks: “How likely are you to recommend us to a friend or colleague?” (0–10 scale).
💡It tracks overall sentiment and brand perception over time. It helps you identify promoters, passives, and detractors—and what makes each group tick. Measure NPS regularly, e.g., every 3–6 months, to be able to spot trends. Best delivered via email, in-app, or mobile.
Pro tip:
Use survey logic to ask different follow-up questions based on score. Don’t treat a 10 the same as a 6.
3. Customer Effort Score (CES)
What it is:
Customer Efforts Score (CES) measures how easy it was to complete a task. E.g., “How easy was it to resolve your issue today?”
💡Low effort = high satisfaction. Especially powerful for support and UX teams looking to smooth out friction. Use it after support interactions or product tasks (e.g., onboarding, checkout, feature use).
Pro tip:
Combine with CSAT to see both sentiment and effort in one view.
4. Open-ended feedback
What it is:
Open-ended questions are basically text fields that let users explain why they gave a certain score—or share feedback without being led in any specific direction or closed in score choosing.
💡It’s the qualitative goldmine. This is where you learn what metrics can’t tell you, the specific pain points, confusion, and ideas you didn’t even think to ask about. Always pair with CSAT, NPS, or CES.
Pro tip:
Even small samples of open feedback can uncover major issues you’d otherwise miss in score-only surveys.
What NOT to do
- Don’t chase vanity metrics (e.g., just looking for high NPS without understanding the “why”).
- Don’t ask every question in one survey. Short, targeted surveys work best.
- Don’t ignore patterns in open feedback—they may appear before the score actually drops.
Satisfaction isn’t just about numbers. It’s about understanding what those numbers mean, who they’re coming from, and what needs to change.
What’s a good customer satisfaction score?
So, what’s considered a “good” customer satisfaction score?
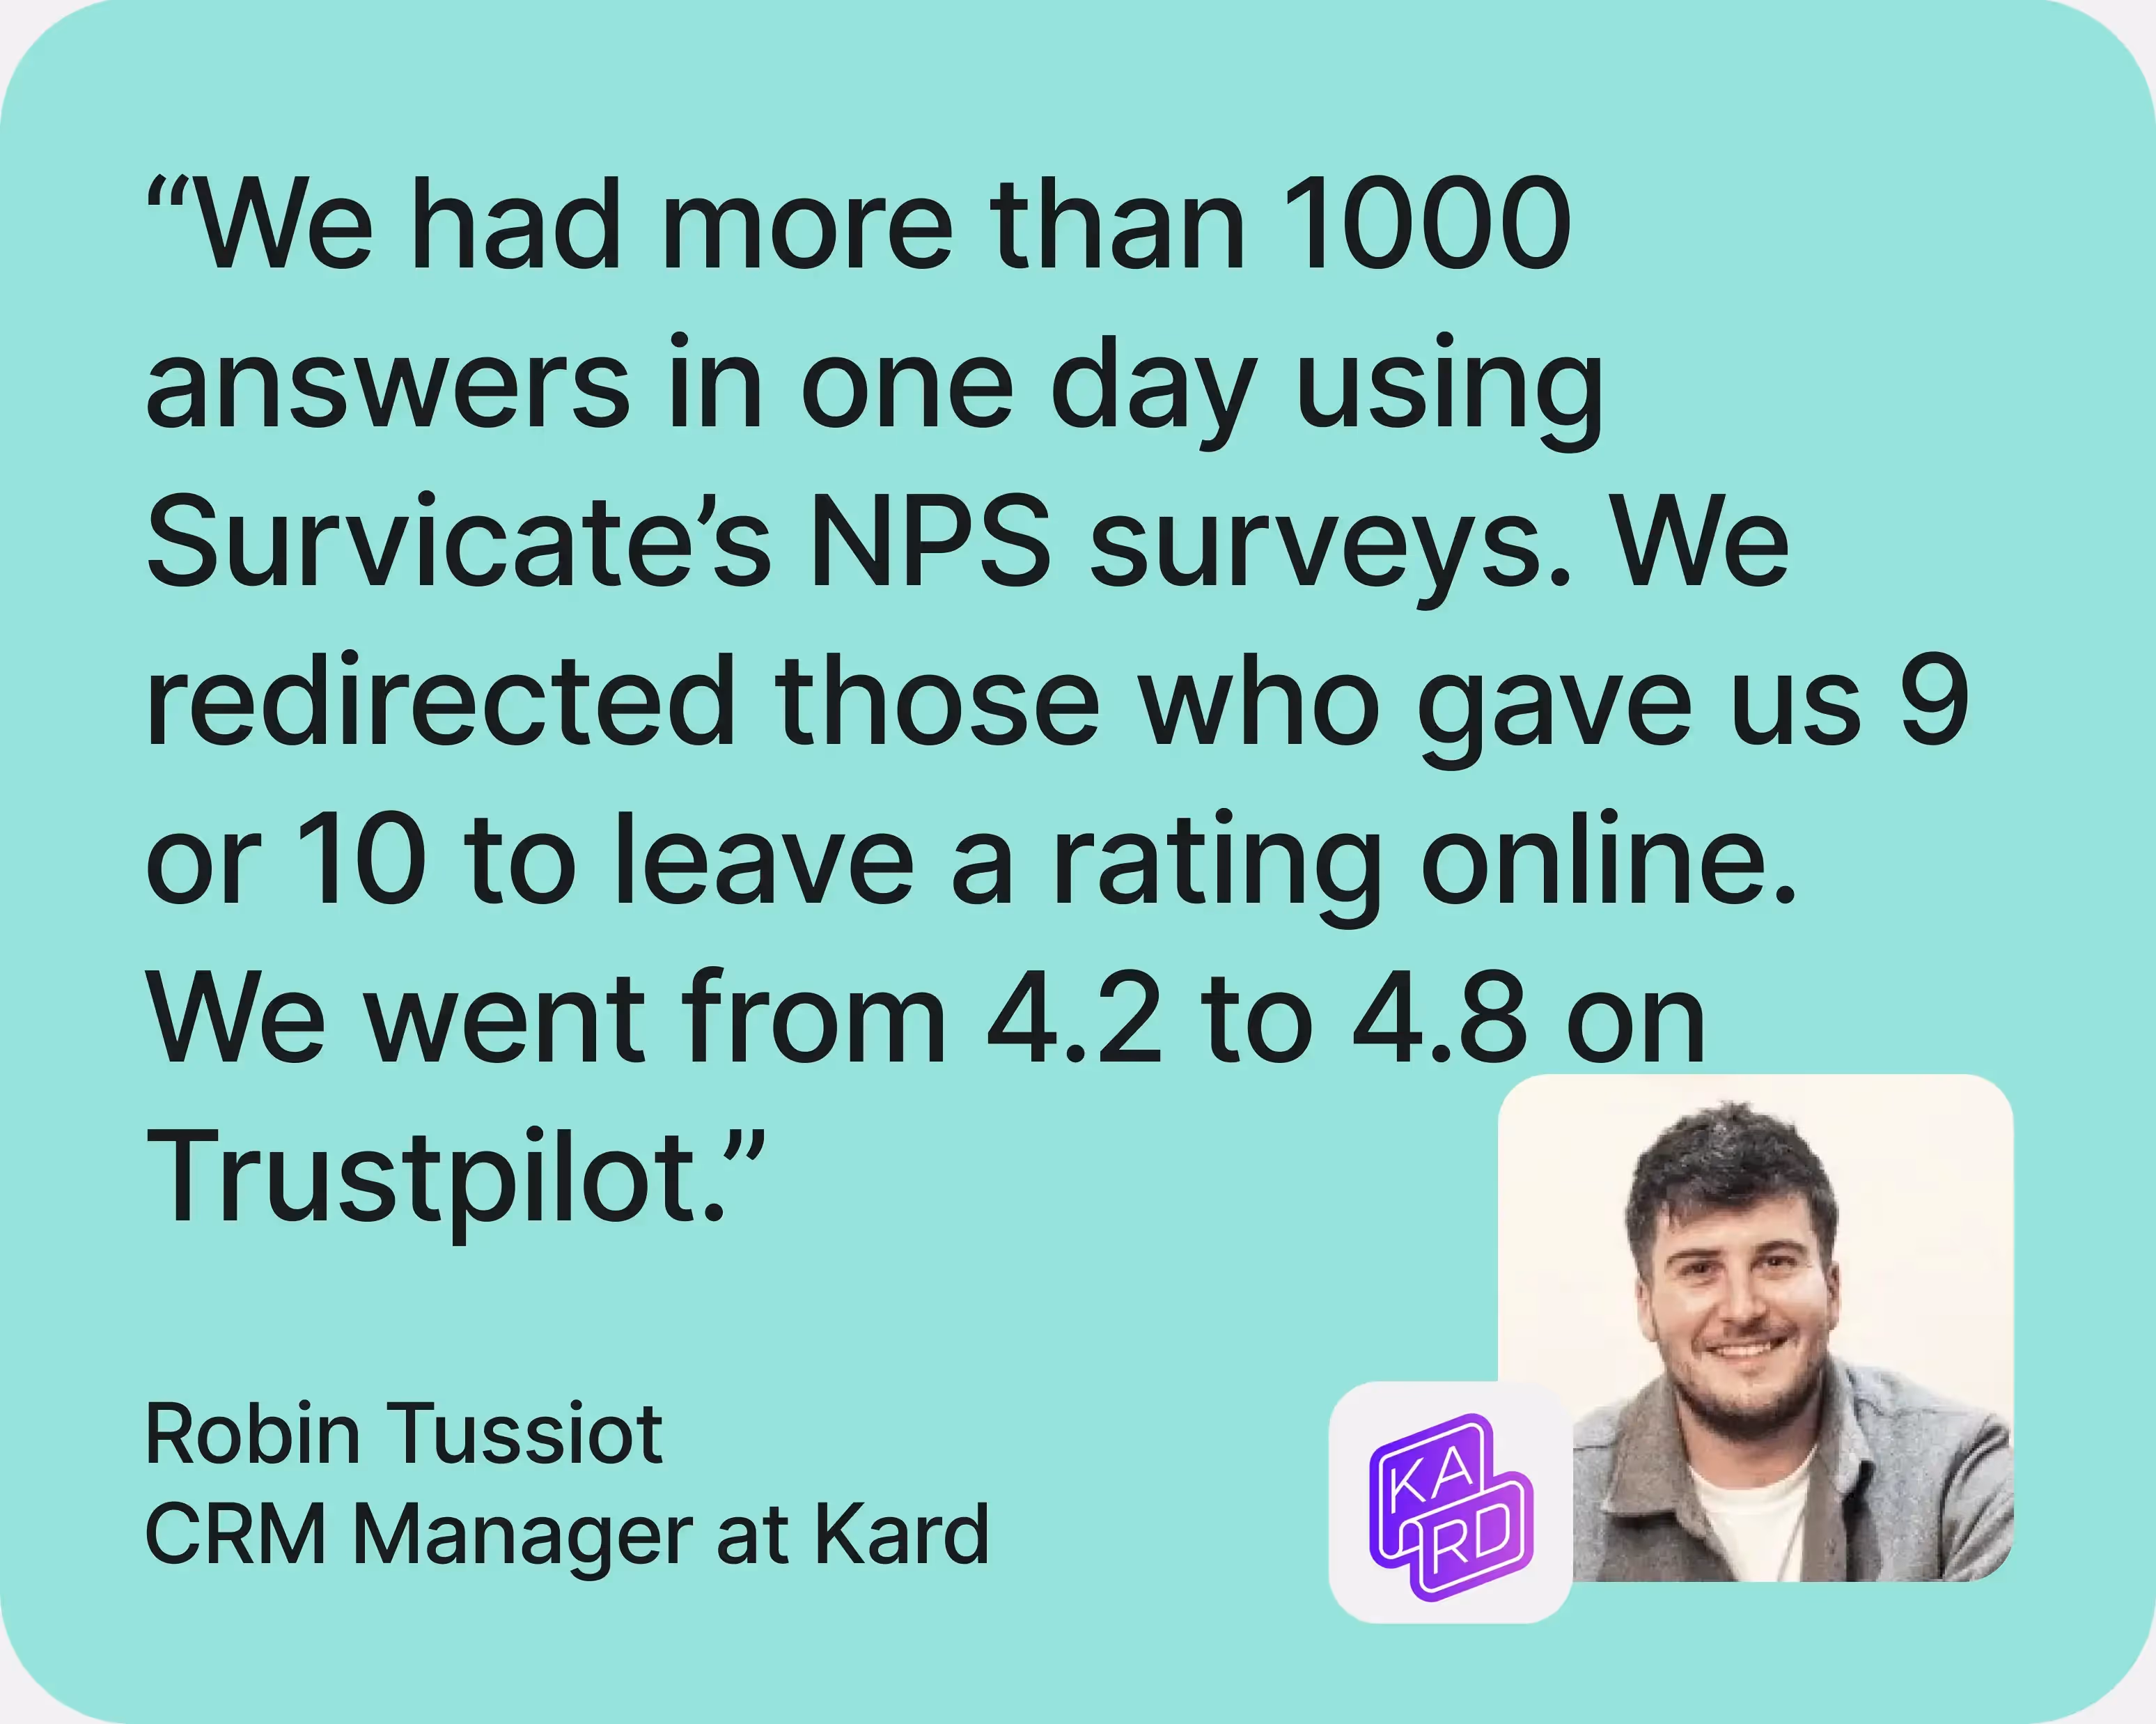
For CSAT, you’ll typically use a 1–5 or 1–10 scale, and anything above 4.0 (or 80% of responses in the top two ratings) is a solid sign you’re doing well. In turn, in 2021 the average US CSAT score was set at 73.6%.
But most aim for the overall satisfaction higher than 70%, especially support teams, like ours at Survicate. In Q1 of 2025 our support team’s CSAT score was proudly 96,7%, nearing perfection.
Yes, we’re loud about it, who wouldn’t be?
But we’re also going to share some tips on how to increase customer satisfaction (CSAT) metrics, at least for support teams specifically. 😉
You should:
- Always check when the user signed up. If it’s someone who’s been with the company for years, you can lean into specific product terminology more confidently. But if they’re new, keep it simple—skip the jargon and explain things more clearly to avoid confusion. ~ Agnieszka Janiec, Senior Customer Support Specialist [LinkedIn]
- Be proactive. In a friendly, no-pressure kind of way. Ask if they need help with any other features while you’re already chatting. It shows you care without overwhelming them. ~ Anastasiia Korsak, Customer Support Specialist [LinkedIn]
- Manage expectations. A lot of frustration doesn’t come from problems, but from mismatched expectations. Don’t overpromise. Be honest and transparent about what the tool can and can’t do. Most users prefer clarity over fake hope. ~ Kasia Przerada, Customer Support Specialist [LinkedIn]
- Offer workarounds whenever you can. Even if you don’t support something directly, it helps to suggest an alternative. Customers really appreciate the extra effort and they often mention it when leaving positive ratings.~ Agnieszka Janiec, Senior Customer Support Specialist [LinkedIn]
- Don’t ghost after solving an issue. Follow up! Especially if it was a tricky setup or complex instruction. Ping them the next day and check in. But be mindful, too many follow-ups can feel spammy. It’s all about balance. ~ Agnieszka Janiec, Senior Customer Support Specialist [LinkedIn]
For NPS, a score between +30 and +50 is solid, +50 to +70 is excellent, and anything above 70 is rare air—think brands like Apple.
CES, which measures ease of experience on a 1–5 or 1–7 scale, is considered strong at 5 or 6 on a 7-point scale.
TL;DR: score cheat sheet
But remember:
- Benchmarks are just that—benchmarks,
- What matters most is your trend over time,
- A “good” score is one that’s improving and tied to action,
- Benchmarks also differ across teams and industries.
How to ask? Channels & timing
You can have the best survey in the world—but if you ask it at the wrong time, in the wrong place, it’s worthless. The key to measuring satisfaction well is about when and where you ask, not just what you ask.
Here’s how to nail it.
Channels: where to ask?
Starting with the place, there are several good spots to run customer satisfaction surveys. Starting with your website.
Website & in-product
Website & in-product surveys happen when users, both existing and new customers, actively scroll through your website or web-based product, either looking for specific information or using your product.
These surveys can either pop up at specific moments in the user journey, for example, when scrolling through the pricing page or exist as static feedback buttons.
- Best for: pricing satisfaction, CSAT, feature-specific feedback, micro-surveys
- Why it works: your users are already engaged. You catch them in context—while they’re using the product or scrolling through the website.
- Example: “How helpful was this feature?” right after a task is completed or “On a scale 1-5, how clear is the information on this page?”
💡 Use Survicate’s multilingual surveys to automatically translate and show customers surveys in their native tongue based on their browser settings.
Email or shareable link
You can also choose to reach out to customers yourself, sharing the surveys either embedded in emails or directly using shareable links, whether that’s in support conversations or in a social media post.
These surveys work especially well for more passive users that may be difficult to catch on your website or directly in product.
- Best for: NPS, post-purchase feedback, churn reasons
- Why it works: great for reaching users outside the product, especially for longer surveys or pulse-checks
- Example: “How likely are you to recommend us?” sent 30 days after signup
Mobile app
A comprehensive customer feedback platform will also work well with your mobile app, allowing you to show surveys directly to mobile users.
For example, with Survicate you can embed surveys in your mobile app thanks to SDKs that work for iOS, Android, React Native, and more, but also in external tools, like Braze In-App Messages.
- Best for: onboarding feedback, app-specific CSAT or NPS
- Why it works: immediate, frictionless experience for mobile-first audiences
- Example: quick emoji-based satisfaction survey after completing a mobile flow
Chat-based tools (e.g. Intercom)
Besides standard survey placements, you should also consider showing surveys in places where users need your utmost attention, aka, the support conversations.
For example, with Survicate, you can embed surveys directly into Intercom chats, even triggering them automatically upon collecting poor feedback to an NPS survey.
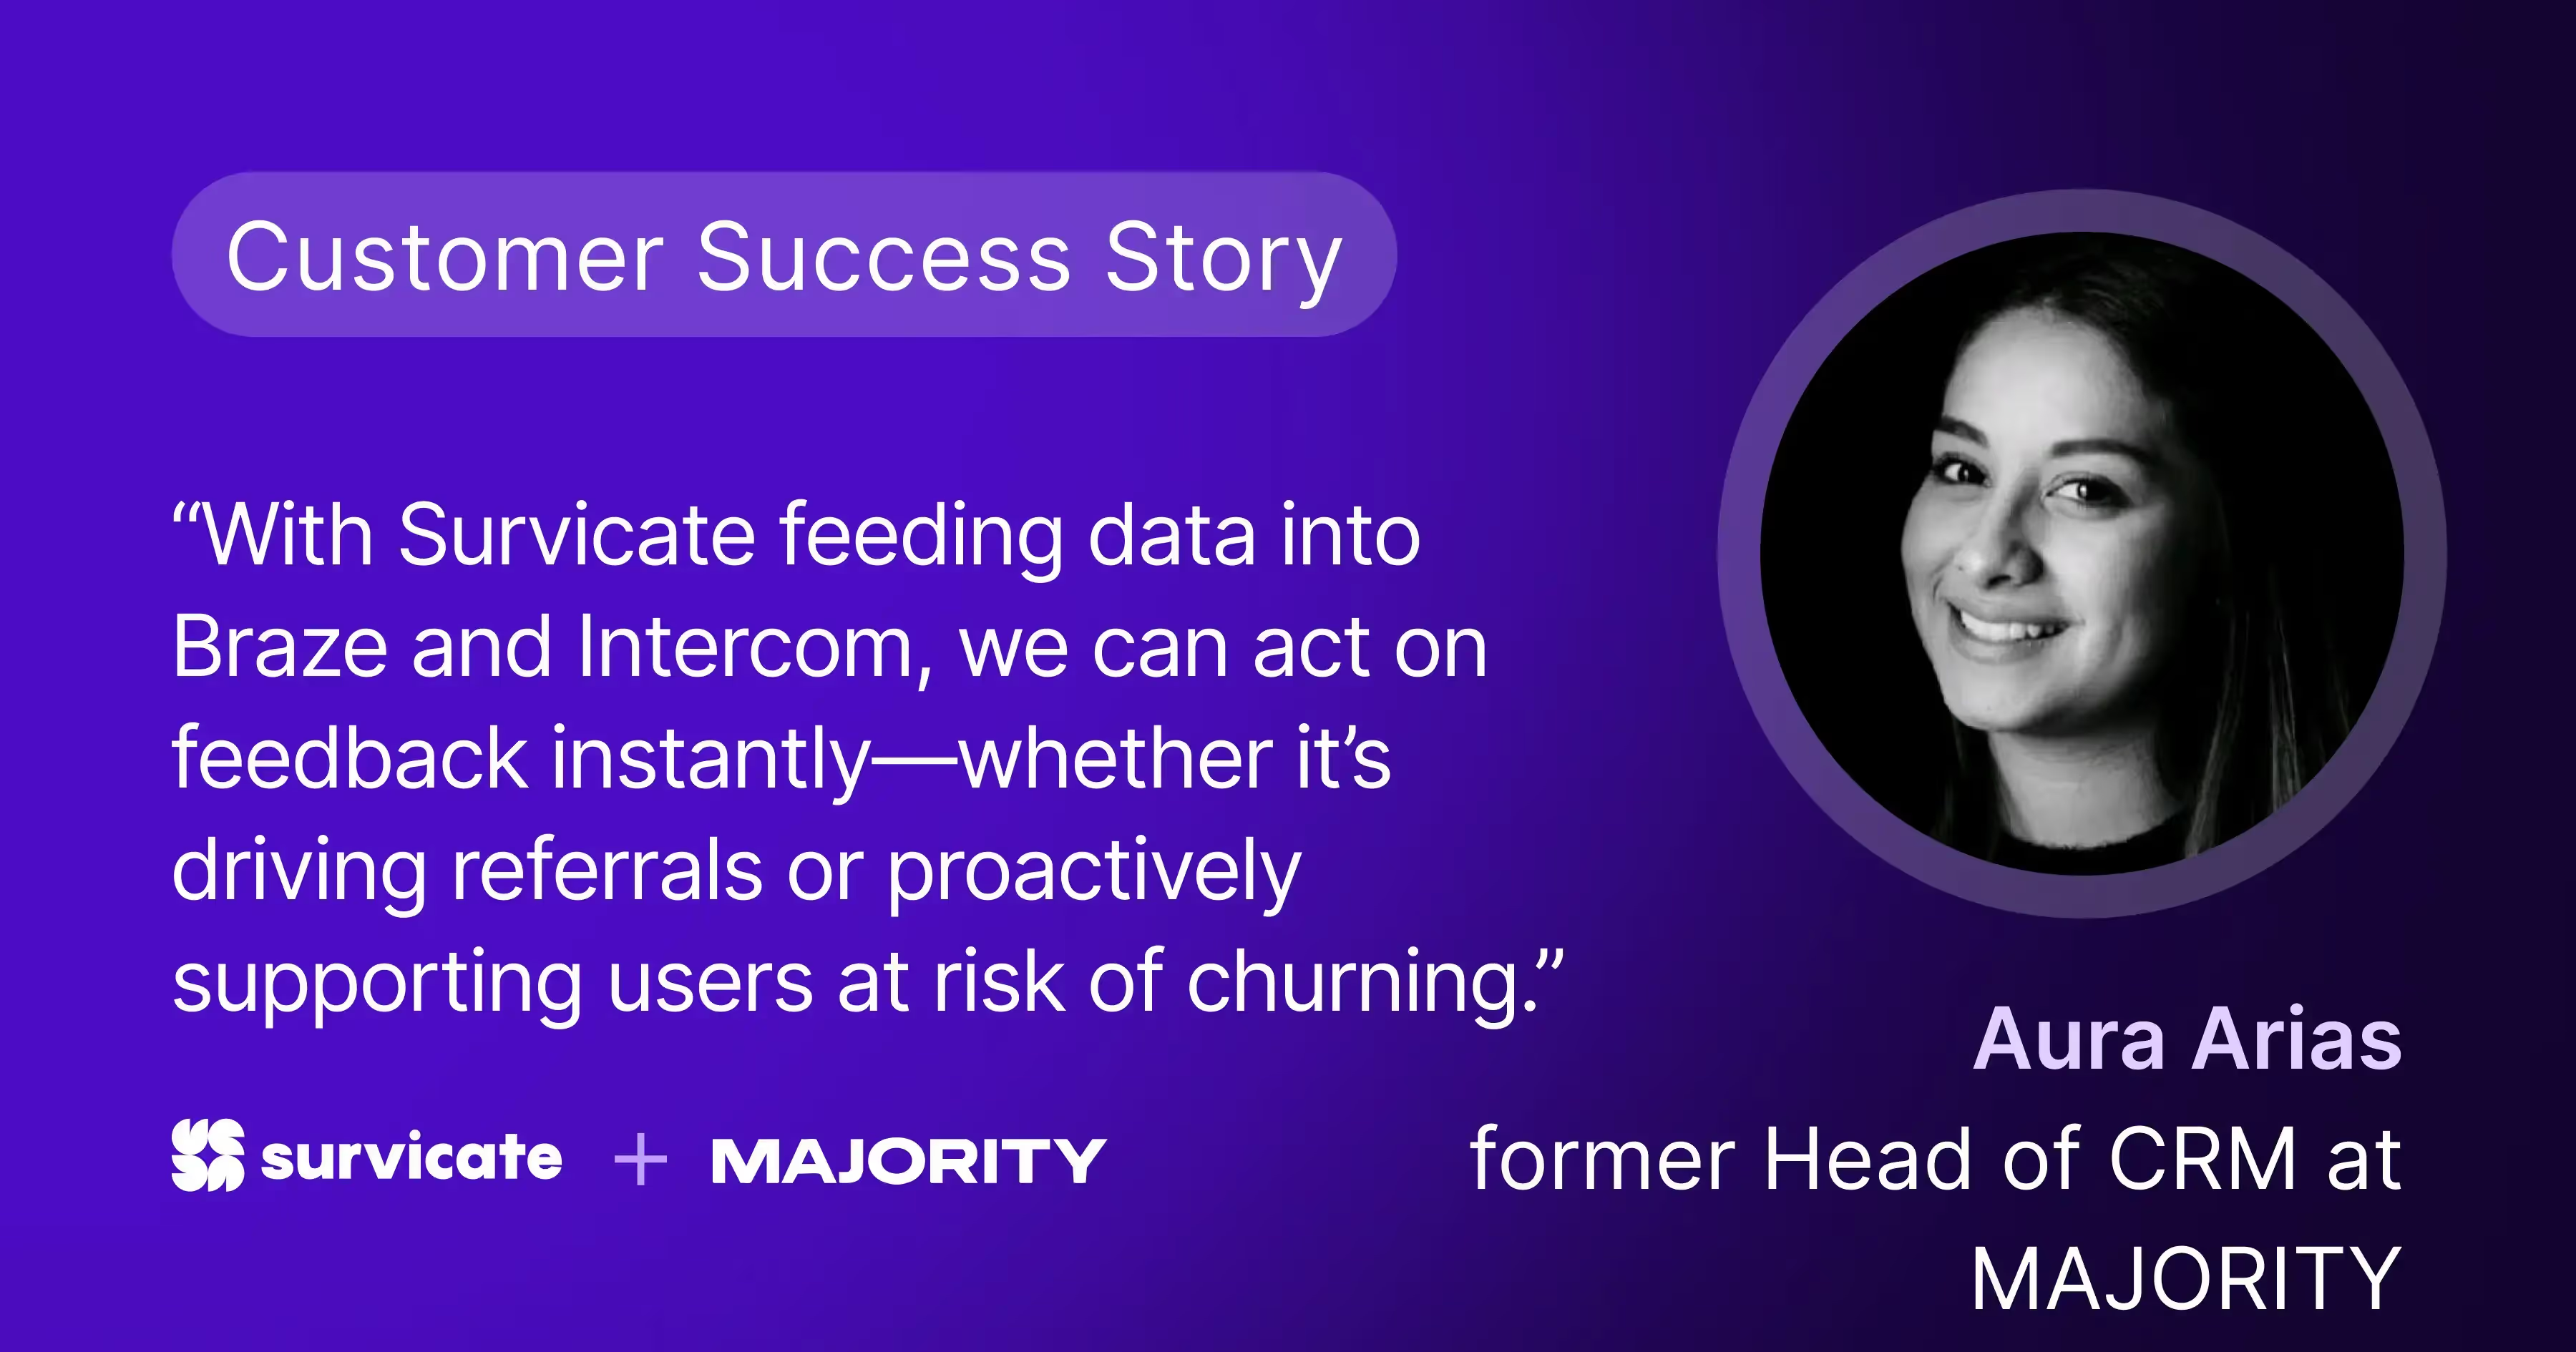
Just like MAJORITY did.
The integration enabled the team to trigger automated support interventions via Intercom for users who expressed dissatisfaction.
- Best for: CSAT and CES after support conversations
- Why it works: users are already chatting—it feels natural to ask right there.
- Example: “How easy was it to resolve your issue today?” or “We’ve noticed your dissatisfaction with our recent feature change. How can we support you?”
Timing: when should you ask?
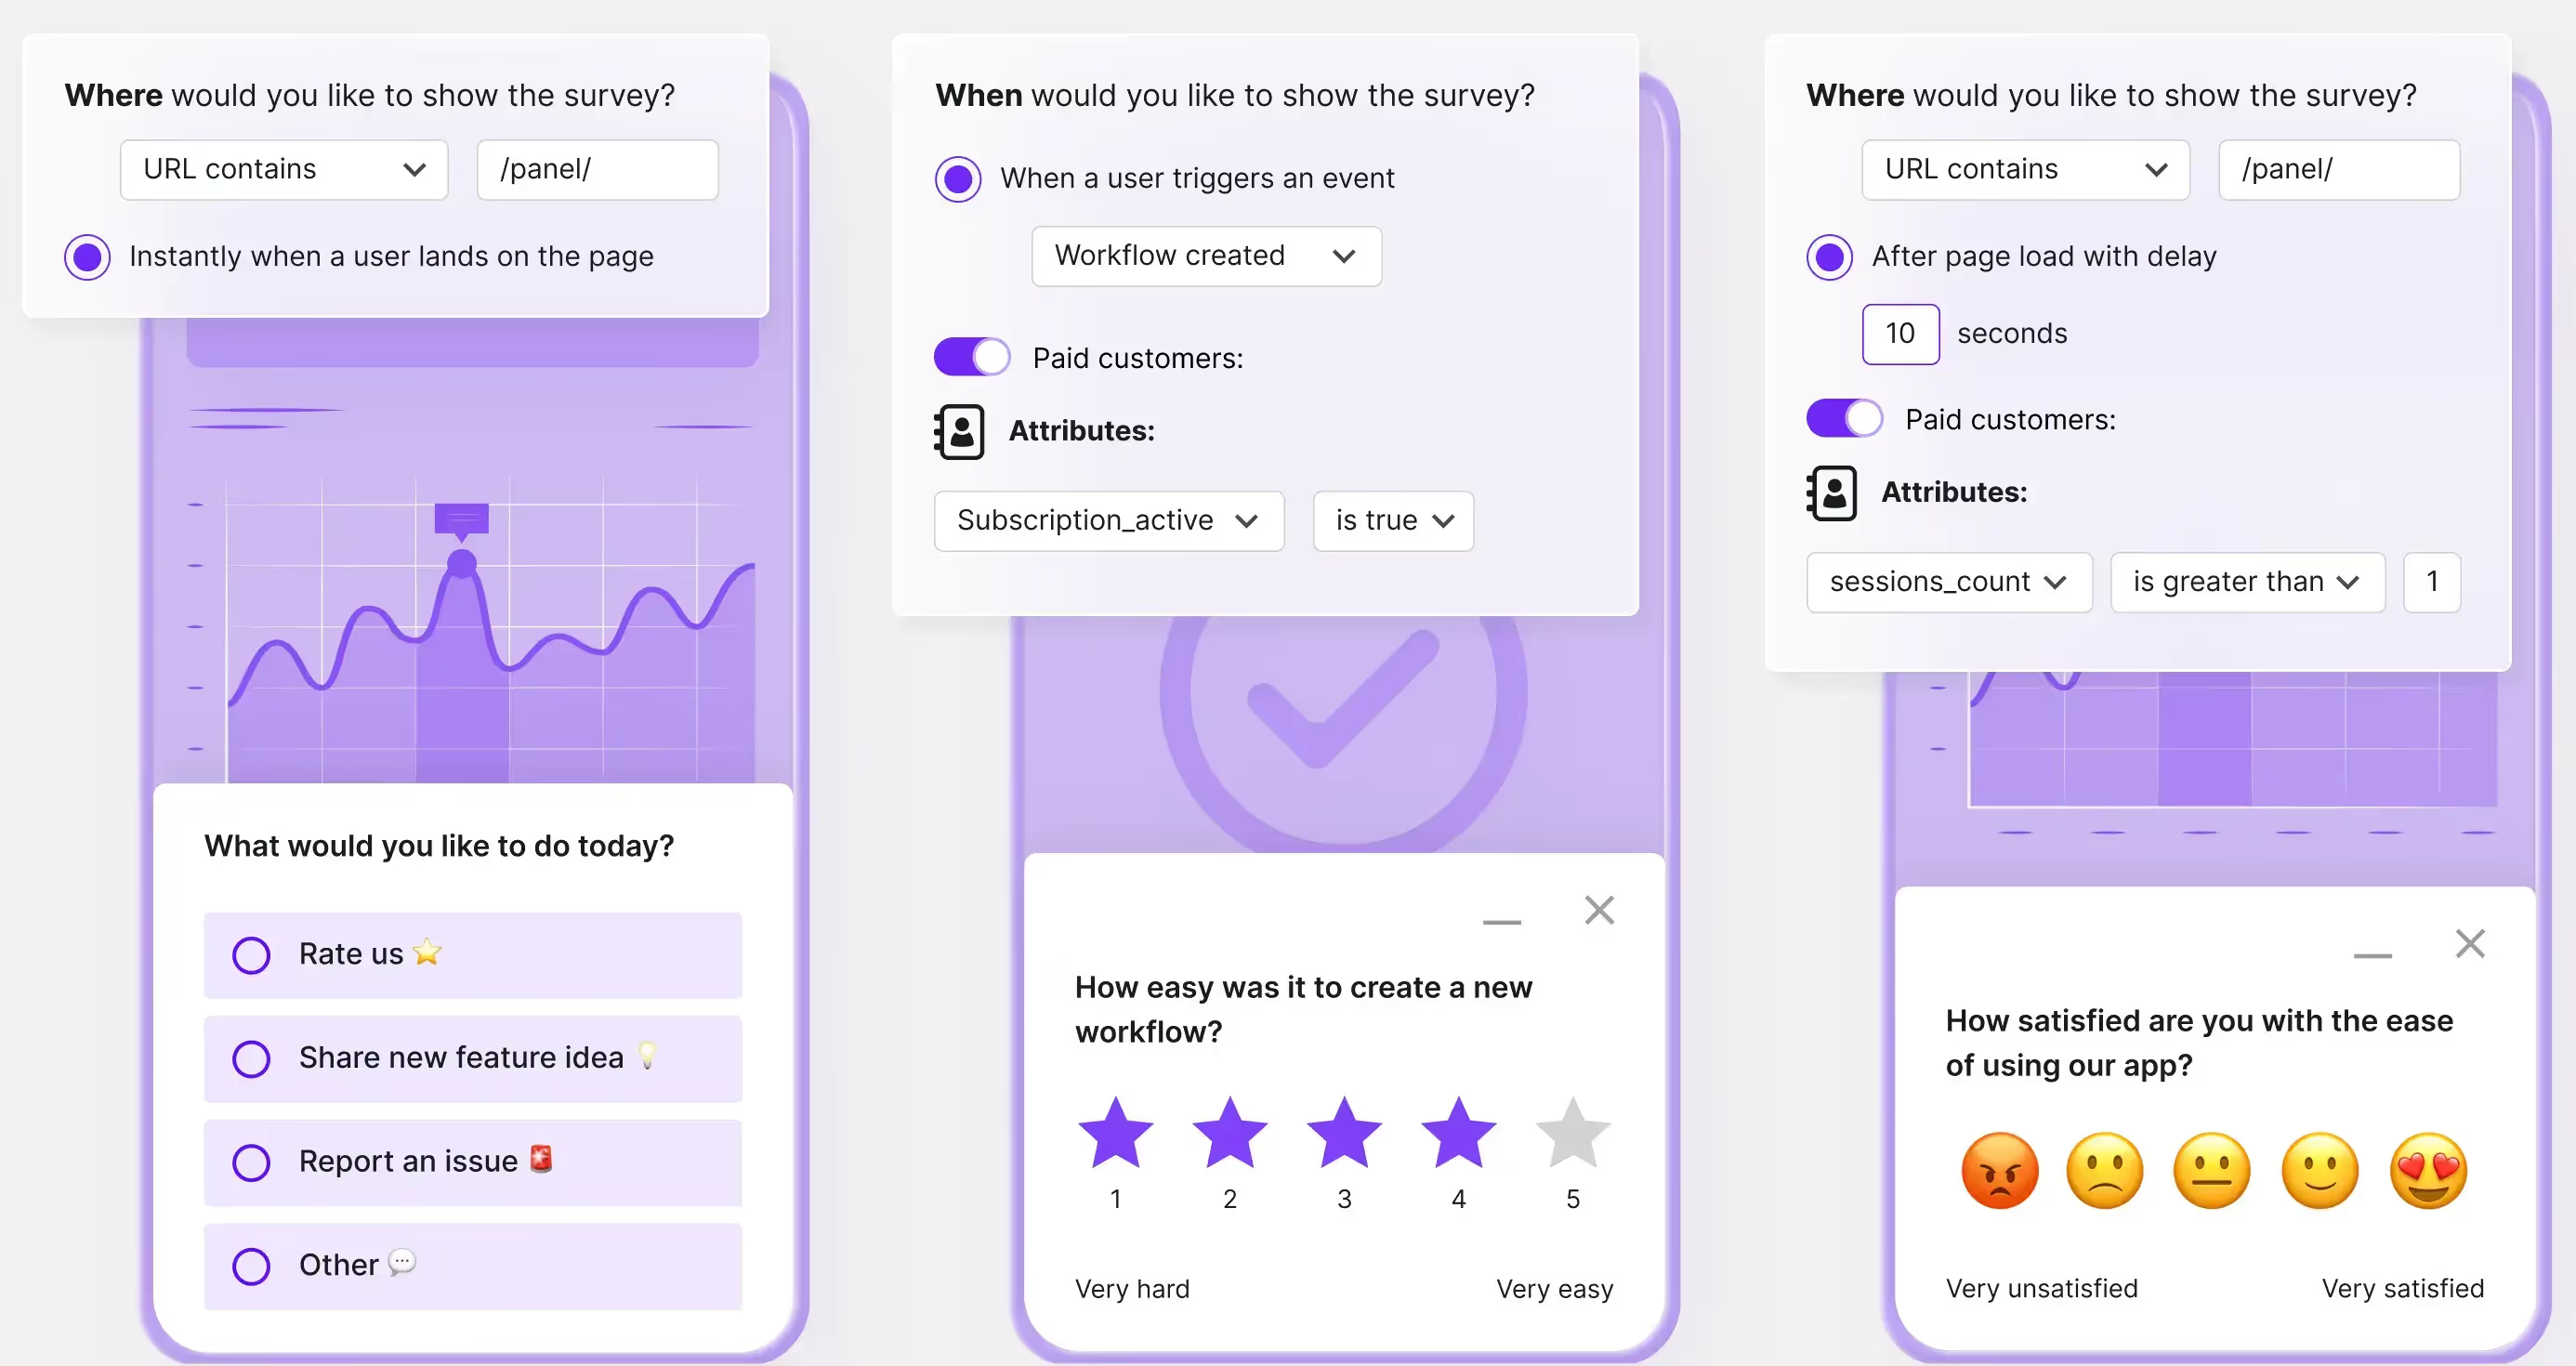
There are three smart ways to time your customer satisfaction surveys: event-triggered, recurring, and behavioral.
Event-triggered surveys are sent immediately after a specific interaction, like a live chat, a purchase, or completing onboarding and are ideal for capturing fresh impressions, such as sending a CES survey right after support resolves an issue.
Recurring pulse-checks, on the other hand, are scheduled at regular intervals (monthly or quarterly) and are perfect for tracking long-term sentiment with metrics like NPS—for example, sending it every 90 days to monitor loyalty trends.
Finally, behavioral surveys are triggered by user actions (or inaction), making them great for spotting silent churn risks or engagement drops, such as asking “What’s missing?” when a user logs in repeatedly without using key features.
Pro tips:
- Don’t ask for feedback too early. Let users actually experience the product.
- Don’t over-survey. Respect attention spans and information overload. Ask fewer questions, more strategically.
- Always combine scores with an open-ended “why?”—that’s where the real gold lives.
- Remember the more subtle events/ways that affect customer satisfaction? After you react, remember to check in with affected customers and ask about their opinion too.
How to measure customer satisfaction? Data analysis
Finally, knowing what exactly customer satisfaction is, what can affect it (negatively and positively), and which metrics you should focus on using which surveys—it’s time to actually get into analyzing the collected data.
And boy oh boy, do we have some cool tips to share.
Part 1: analysis methods
Let’s start with different analysis methods you can use.
Score trend analysis (quantitative)
The most common way to measure customer satisfaction is by collecting customer feedback with the different satisfaction surveys and tracking it over time to uncover any trends.
You’re basically looking at the numbers: CSAT, NPS, and CES over time, wanting to know whether the satisfaction is improving or tanking?
So:
- Track customer satisfaction scores weekly, monthly, or quarterly
- Compare before vs. after product or support changes
- Look for patterns in different segments (new vs. long-time users, web vs. mobile)
- Use when you need hard data to justify decisions, roadmap priorities, or team KPIs
We’ll tell you exactly how to do it without going overwhelmed in a minute.
2. Segment-based analysis
Not all feedback is equal—it depends on who it comes from.
So segment responses by:
- Plan/tier (Free vs. Paid)
- Acquisition source
- Product usage level
- Country or device
- Support agent/team
You want to understand where satisfaction differs—and why.
3. Thematic (qualitative) analysis
Dig into open-ended answers. You’re not scoring—you’re finding themes, just like spotting trends in CSAT scores, this time you’re spotting trends in open-ended feedback.
- Group feedback into themes like "pricing," "UX," "missing feature"
- Identify recurring complaints or praise
- Compare by sentiment: what frustrates detractors? What delights promoters?
You want to understand why people feel the way they do.
4. Comparative analysis
Compare results:
- Between two time periods (e.g., pre- and post-launch)
- Between two products/features
- Between two teams or workflows
Use it especially so if you’re testing an initiative or diagnosing a drop in satisfaction.
5. Root cause analysis
Take low satisfaction scores (e.g., NPS 0–6), and reverse-engineer what caused them.
- Look for common themes in low scores
- Pair with user metadata (plan, feature usage, support history)
- Use it to isolate systemic issues
Use this method when you’re fixing churn risk or trying to improve specific touchpoints.
Part 2: tools to use
Once you start collecting meaningful customer feedback, the next challenge is: how do you actually make sense of it all? Whether you're a solo marketer or a cross-functional product team, your analysis tools should match your stage, stack, and sanity.
Here are two options: manual analysis with Google Sheets / Excel and Survicate for fully automated feedback data analysis.
Google Sheets / Excel

Best for: Early-stage teams, simple use cases, spreadsheet-lovers
Why use it:
The classic starting point for feedback analysis. It gives you full control over how you slice and dice your data. You can build pivot tables to compare NPS by feature, chart CSAT scores over time, and manually tag open-ended comments to find patterns.
Use it when:
You’re just getting started and don’t yet need automation or when you want custom reporting your way.
Limitations:
- Doesn't scale well beyond a few hundred responses
- Manual work = time-consuming
- No built-in support for qualitative text analysis
Now hang tight because we’re about to get technical.
Here are some of the still time-consuming, yet worth to know if you’re just starting out with feedback analysis, tips for making sense of feedback in Google Sheets.
1. Set up manual filters
Use Data → Create a filter or shortcut Ctrl + Shift + L (Cmd + Shift + L on Mac) and then filter responses by rating, sentiment, product, or tag. Within Google Sheets / Excel, you can use different filtering options, such as ‘text contains’ or sorting by a specific number range.
Pro tip: color-code low CSAT or NPS values with conditional formatting to quickly scan for issues.
Also, please note that keyboard shortcuts may not work on Google Sheets without proper browser extensions installed. If the shortcut is not working for you, use the manual way of creating filters.
2. Tag & count open-ended responses
Use a new column for “Themes” and build a dropdown with Data Validation
→ Let you or teammates tag responses as “UX issue,” “Bug,” “Pricing,” etc.
Bonus: Use =COUNTIF(range, "UX issue") to count how often each theme appears. For range, type in the range you want Google Sheets to count. For example A1:A13. Overall, it could look like this =COUNTIF(A1:A12, "UX issue").
3. Use =SPLIT() for multi-select answers
If a response includes multiple values (e.g., "Feature A, Feature B") all in one column, use: =SPLIT(A2, ", ") to split the answers into separate columns.
→ Great for breaking apart multiple choice feedback for tagging or analysis.
4. Highlight problem areas with conditional formatting
To highlight problem areas, use conditional formatting.
- Go to Format → Conditional formatting
- Apply rules like:
- If value < 4 (for CSAT), color it red
- If value = “Bug” in Theme column, highlight in orange
This will give you a visual scan of potential red flags.
5. Use =LEN() to surface long responses
Longer responses often equal more thoughtful feedback. So, to find these insights quicker, add a column with: =LEN(A2). For A2 type in the column number in which you’ve collected the open-text feedback.
Then, once the =LEN(A2) formula calculates the number of characters used in each response, you can filter further to, for example, only show responses, whose length exceeds 100 characters and view them in a separate column or highlight them with a different color.
To filter by character length, you can use =LEN(A2) > 100, swapping the exact numbers as per your wish.
6. Group similar answers with =ARRAYFORMULA()
Need to apply the same formula across hundreds of rows and automatically label low and high CSAT scores? Use: =ARRAYFORMULA(IF(A2:A<4, "Low", "High")).
7. Track trends over time
Use =COUNTIFS() to count how many responses fall into specific categories on specific dates.
=COUNTIFS(DateRange, ">=2024-01-01", DateRange, "<2024-02-01", ScoreRange, "<=3")
→ Helpful for monthly trend analysis of NPS/CSAT/CES.
For example =COUNTIFS(A2:A, ">=2024-01-01", A2:A, "<2024-02-01", B2:B, "<=3").
Where:
- Column A = dates
- Column B = CSAT/NPS/CES scores
8. Use Gemini to speed up charts creation
Last, but not least, you can sprinkle some of the AI that Google Sheets offers.
Save time building charts by using Gemini in Google Sheets. Highlight your data and click “Analyze with Gemini” in the bottom-right corner.
You can ask Gemini to create specific visualizations like a bar chart of CSAT scores by month or a pie chart of response categories. It automatically analyzes your data and suggests the most relevant charts—no manual setup or formulas required here, but still some work and knowledge to ask AI to create what you need.
Survicate: spot satisfaction trends in seconds
Now, if you don’t have all the time and patience in the world to manually analyze feedback with Google Sheets, use reliable tools to do it for you. Like Survicate.
Survicate gives you several powerful ways to analyze feedback, including customizable dashboards for a high-level overview across all surveys, individual survey analysis tabs for deep dives into specific results, and AI for uncovering weeks-worth of insights in seconds, and across sources too.
Best for: product, CX, or marketing teams that want instant insight from open-ended feedback, without spending hours in spreadsheets.
Why use it: Survicate gives you a powerful combination of dashboards, per-survey analysis, and AI tools to help you understand customer sentiment at every touchpoint. No need to export or clean data—the insights are ready the moment feedback comes in.
Use it when: you want to track satisfaction over time, find patterns in open-text responses, or answer strategic questions like “What’s frustrating users right now?”—all without manual effort.
Deep dive into each survey
Every survey you launch in Survicate comes with its own analysis tab—a focused space where you can break down CSAT, NPS, CES, and open-text answers.
Filter results by date, user traits, channel, or device. Compare individual responses, spot patterns, and see what’s working (or what’s frustrating users) in real time.
360-view of all feedback

Want a bird’s-eye view?
Survicate’s customizable dashboards let you track trends across all your surveys in one place. Monitor satisfaction by product area, campaign, user type, or lifecycle stage. Quickly identify shifts, spikes, or score drops—without switching tools or exporting data.
AI for smarter feedback analysis (in seconds)
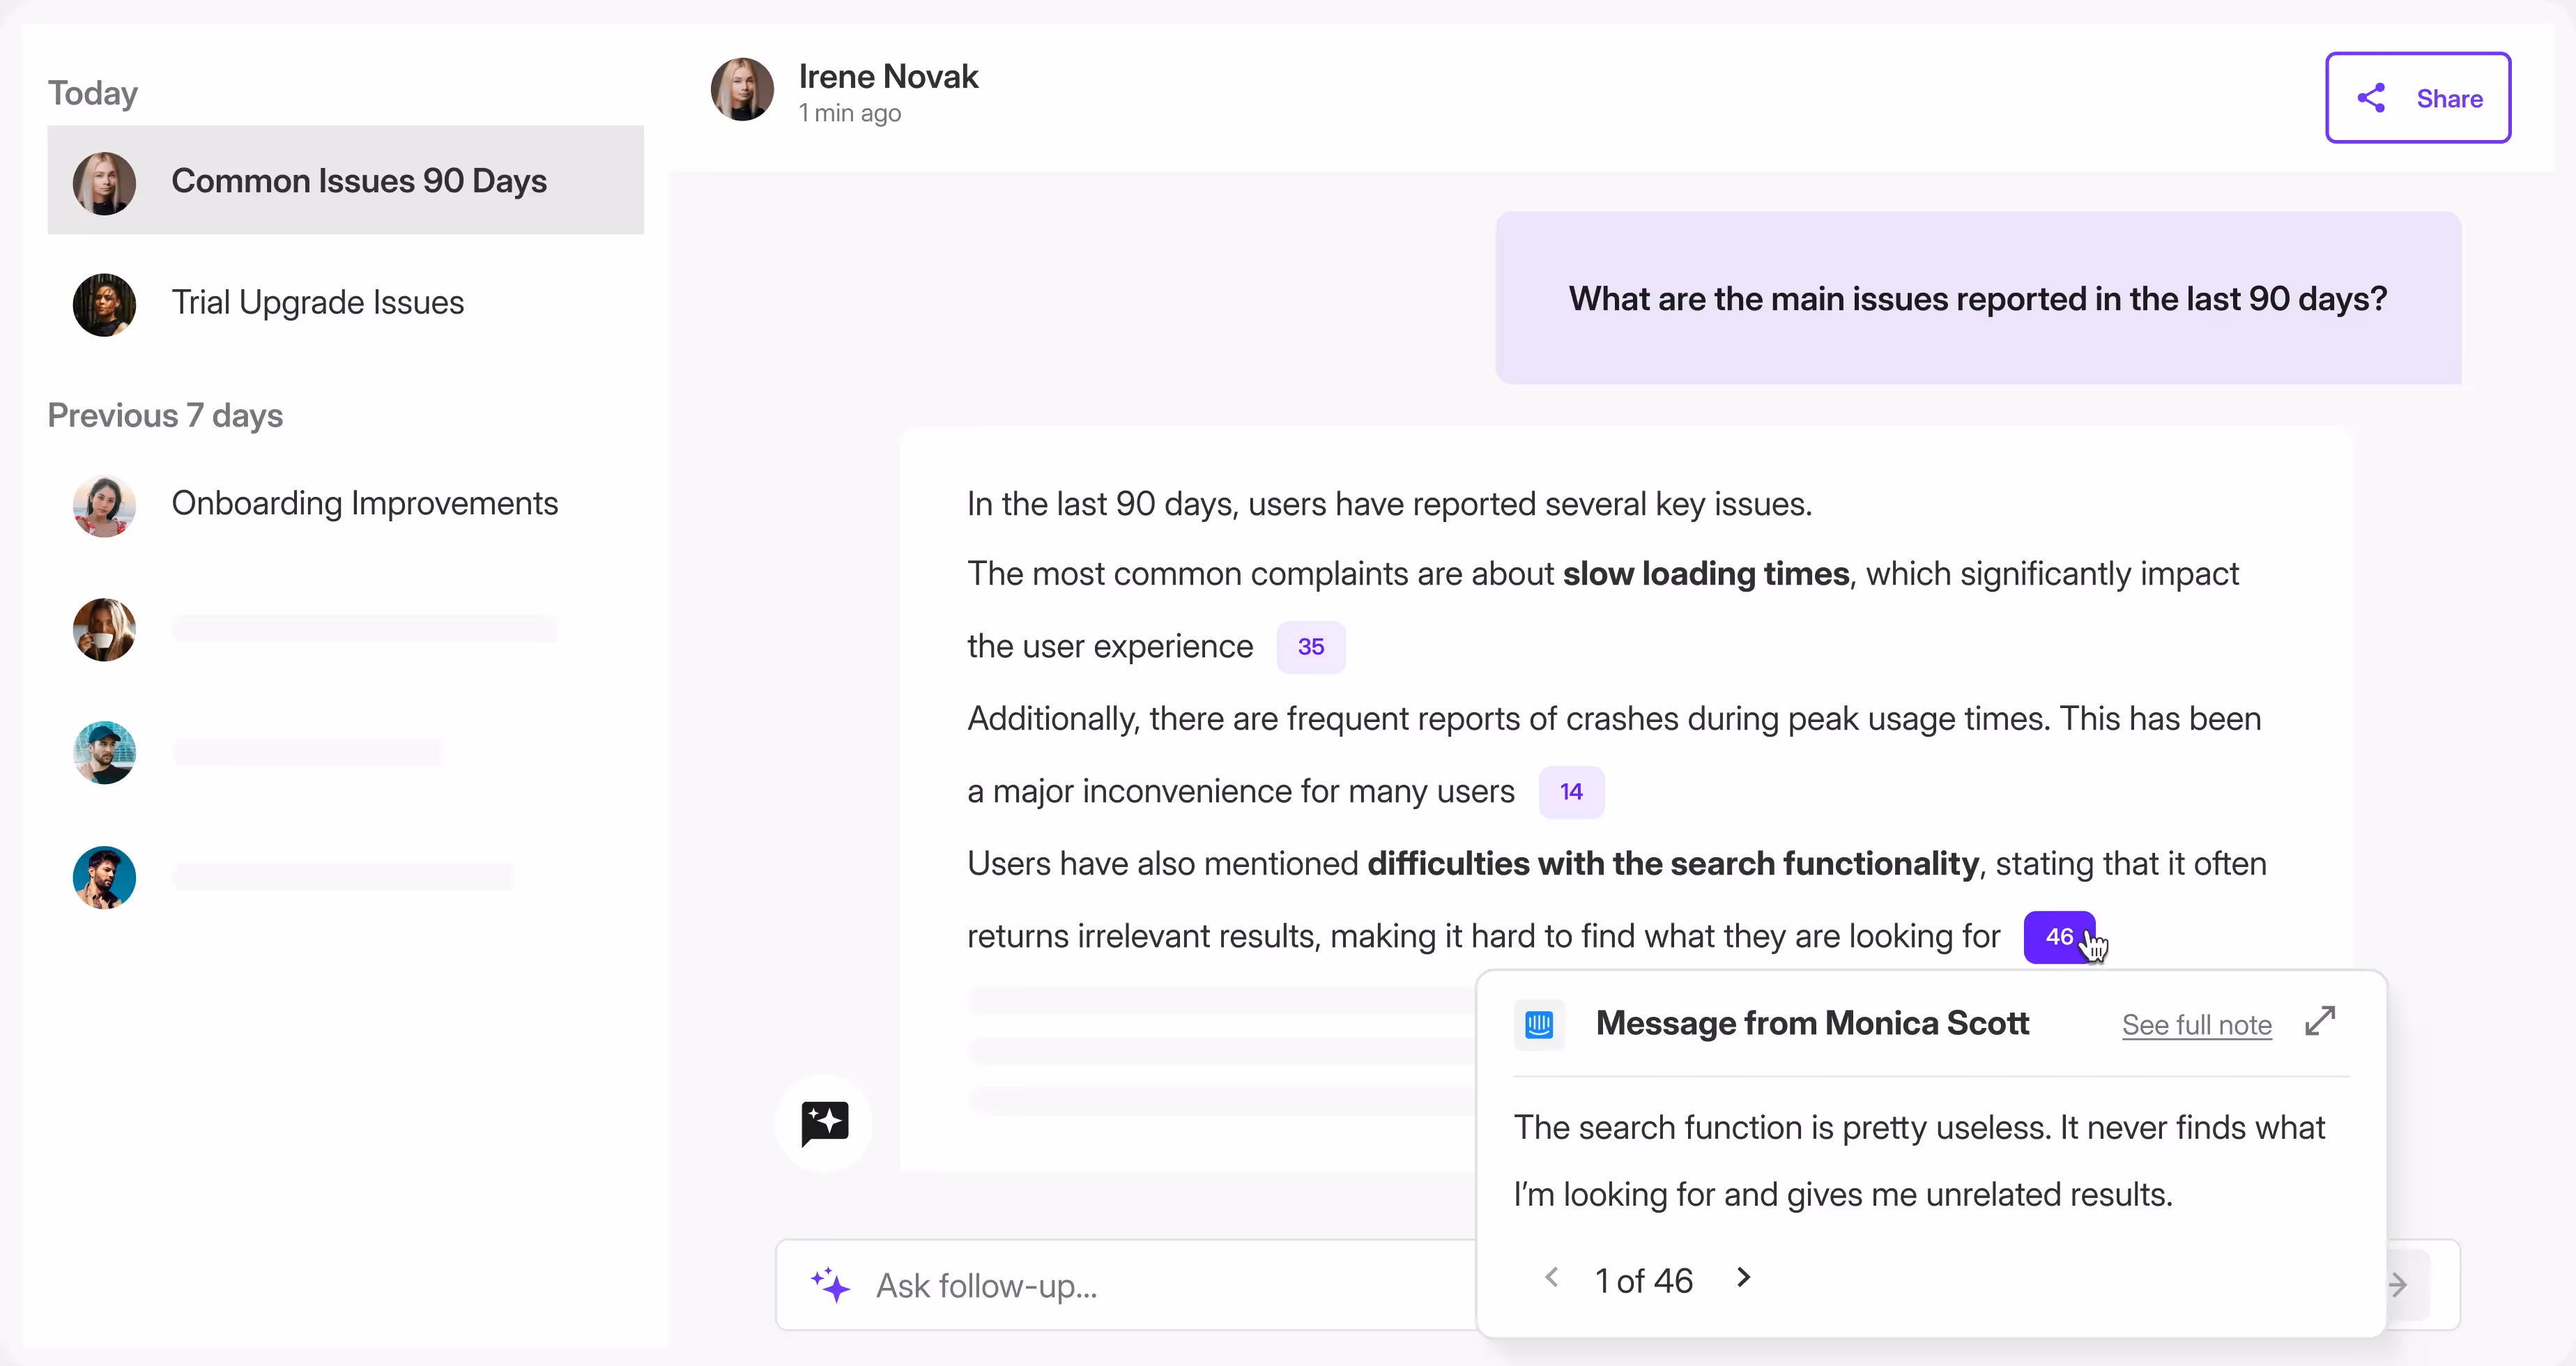
With Survicate’s Insights Hub and Research Assistant, you can stop tagging responses manually and start getting actionable insights right there and then.
AI auto-categorizes open-ended feedback into themes and gives you instant, evidence-backed insights, like:
“What’s frustrating free users this month?”
“What did promoters say after the onboarding survey?”
You’ll surface trends across surveys, sources, and timeframes in seconds—not weeks.
Analyze feedback across sources and calls
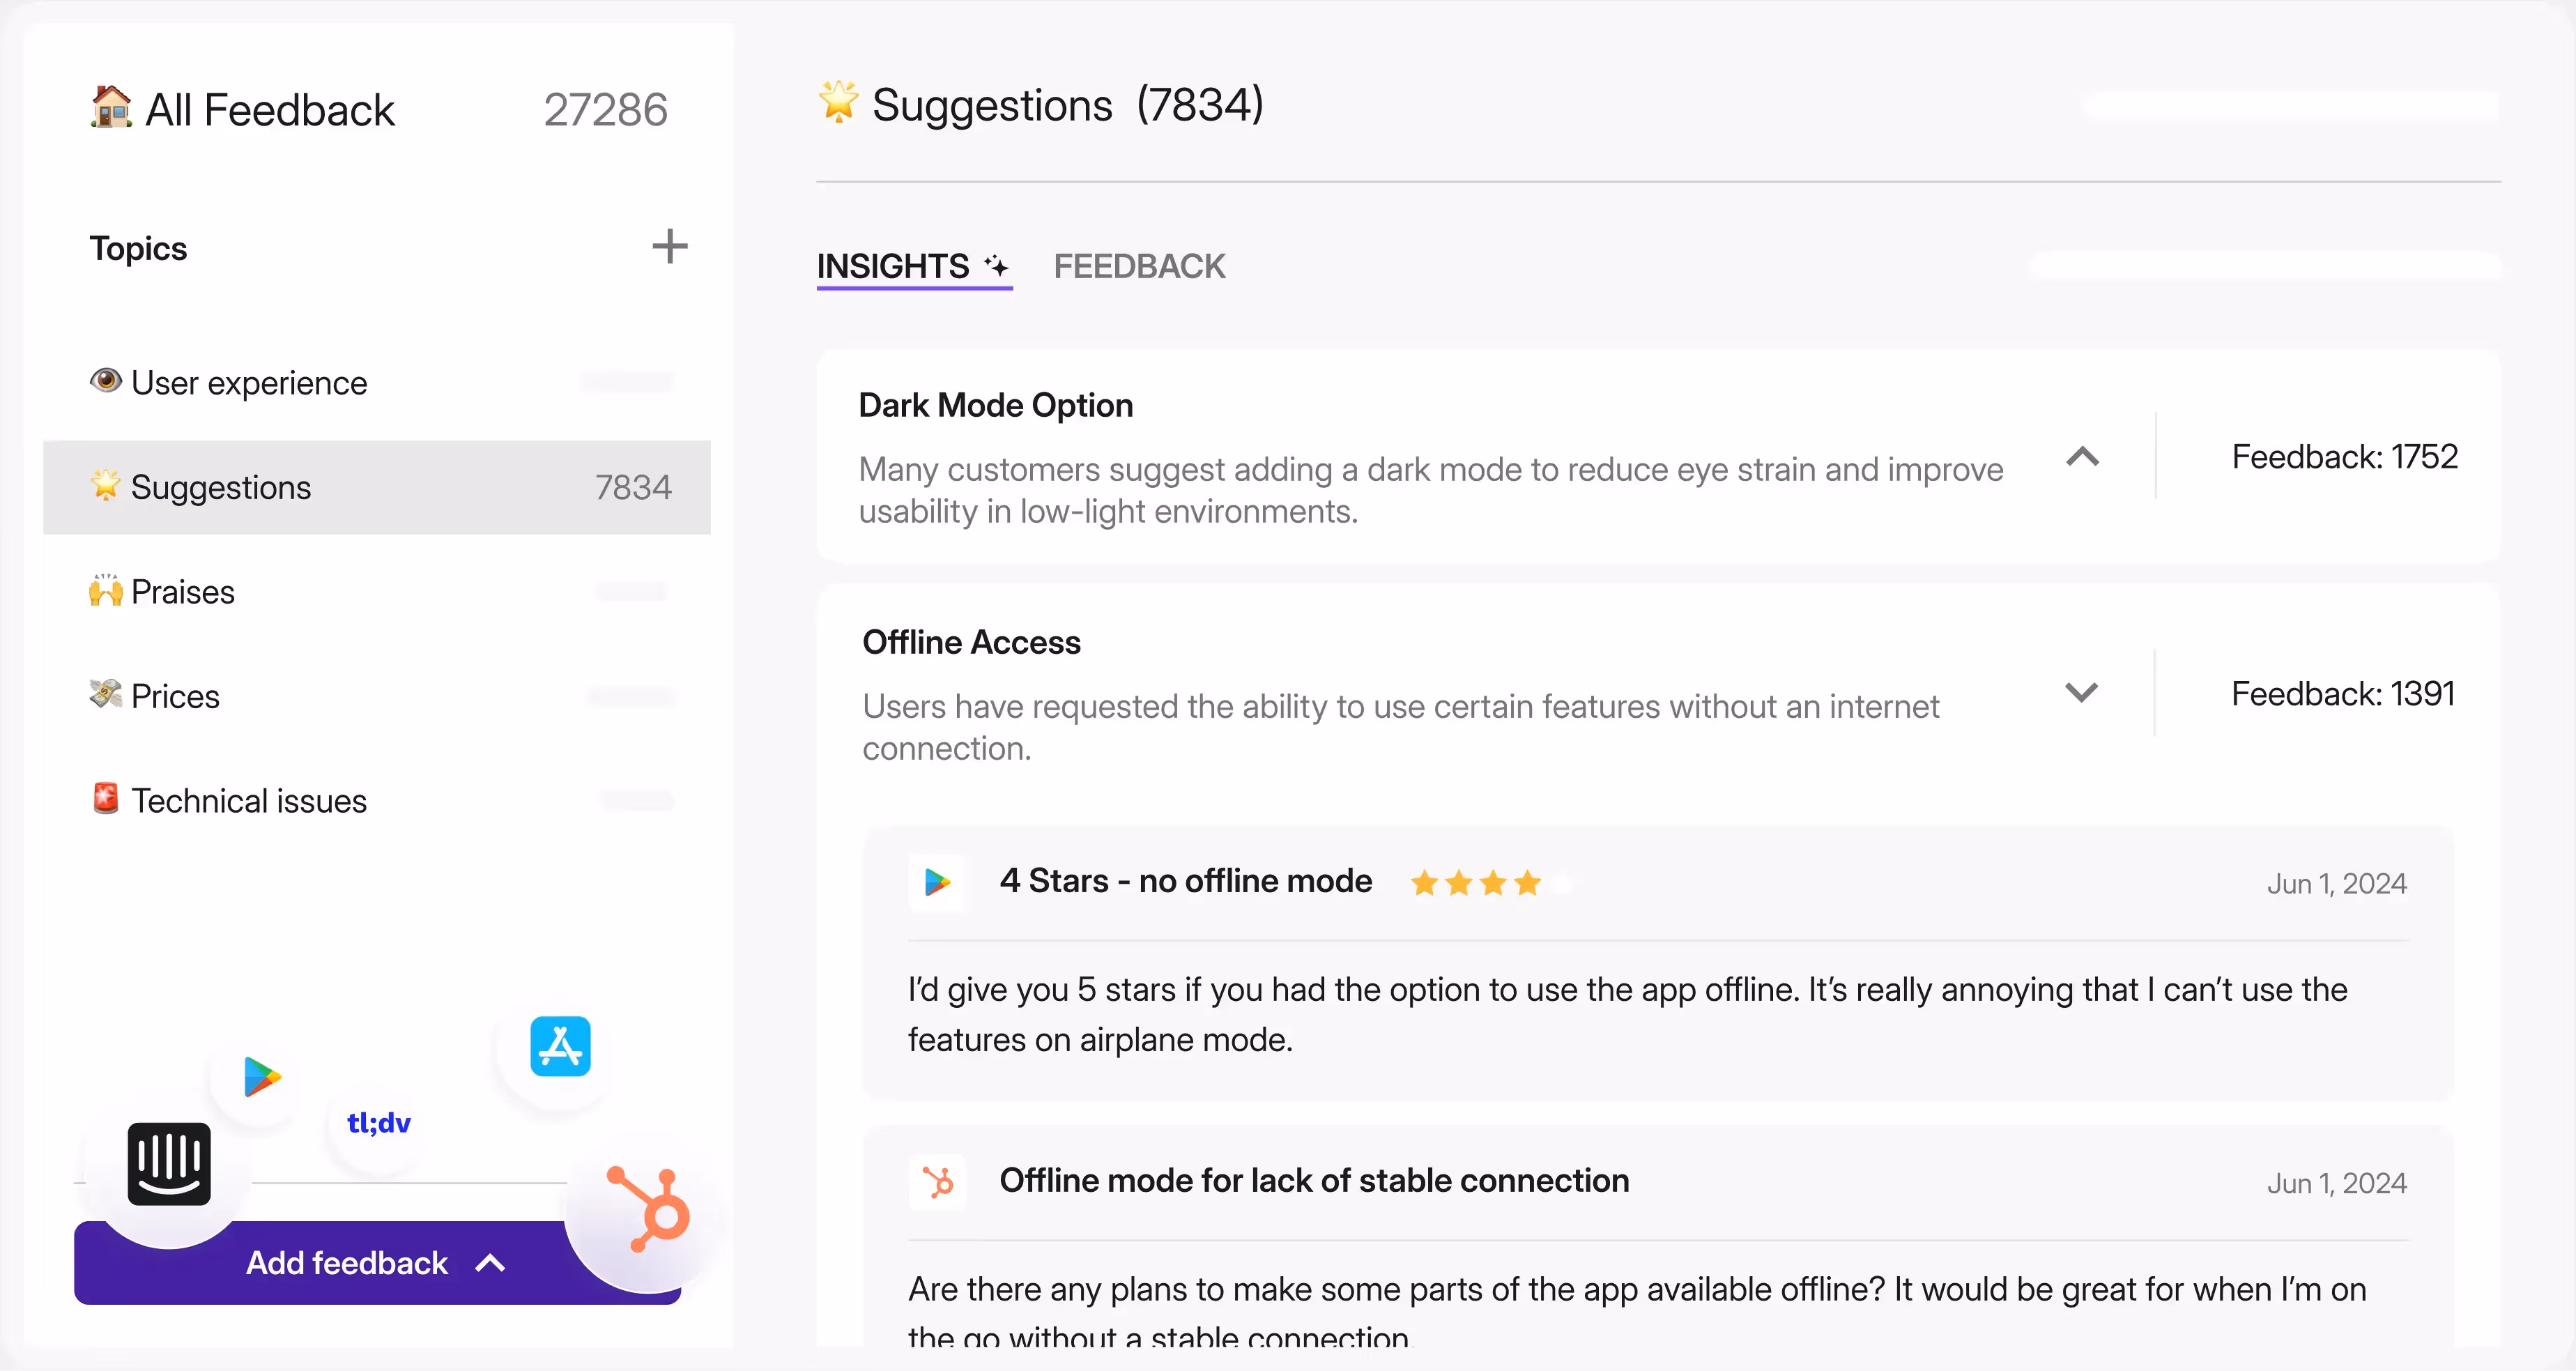
Survicate makes it easy to unify and analyze customer feedback from multiple channels—not just surveys.
You can track insights from App Store and Google Business Profile reviews, Intercom conversations, and more, all in one centralized view.
Survicate even supports call analysis by automatically transcribing recorded conversations and applying AI to surface key themes, pain points, and opportunities.
Whether feedback comes from written comments or spoken interactions, you’ll get a complete picture of the customer experience without switching tools or manually stitching data together.
How to close the satisfaction feedback loop? Internally and externally
By now, you’ve collected all the important customer satisfaction feedback data and analyzed it completely, extracting what matters most: real insights.
But is learning about the existence of those insights enough to turn users into loyal customers? After all, we’re not collecting and analyzing all that data for the fun of it. We’re collecting it to improve our metrics, improve customer retention, satisfaction, customer experience, and loyalty.
What you want to do next is actually close the feedback loops by taking appropriate actions based on what you discovered.
Internal feedback loop closing
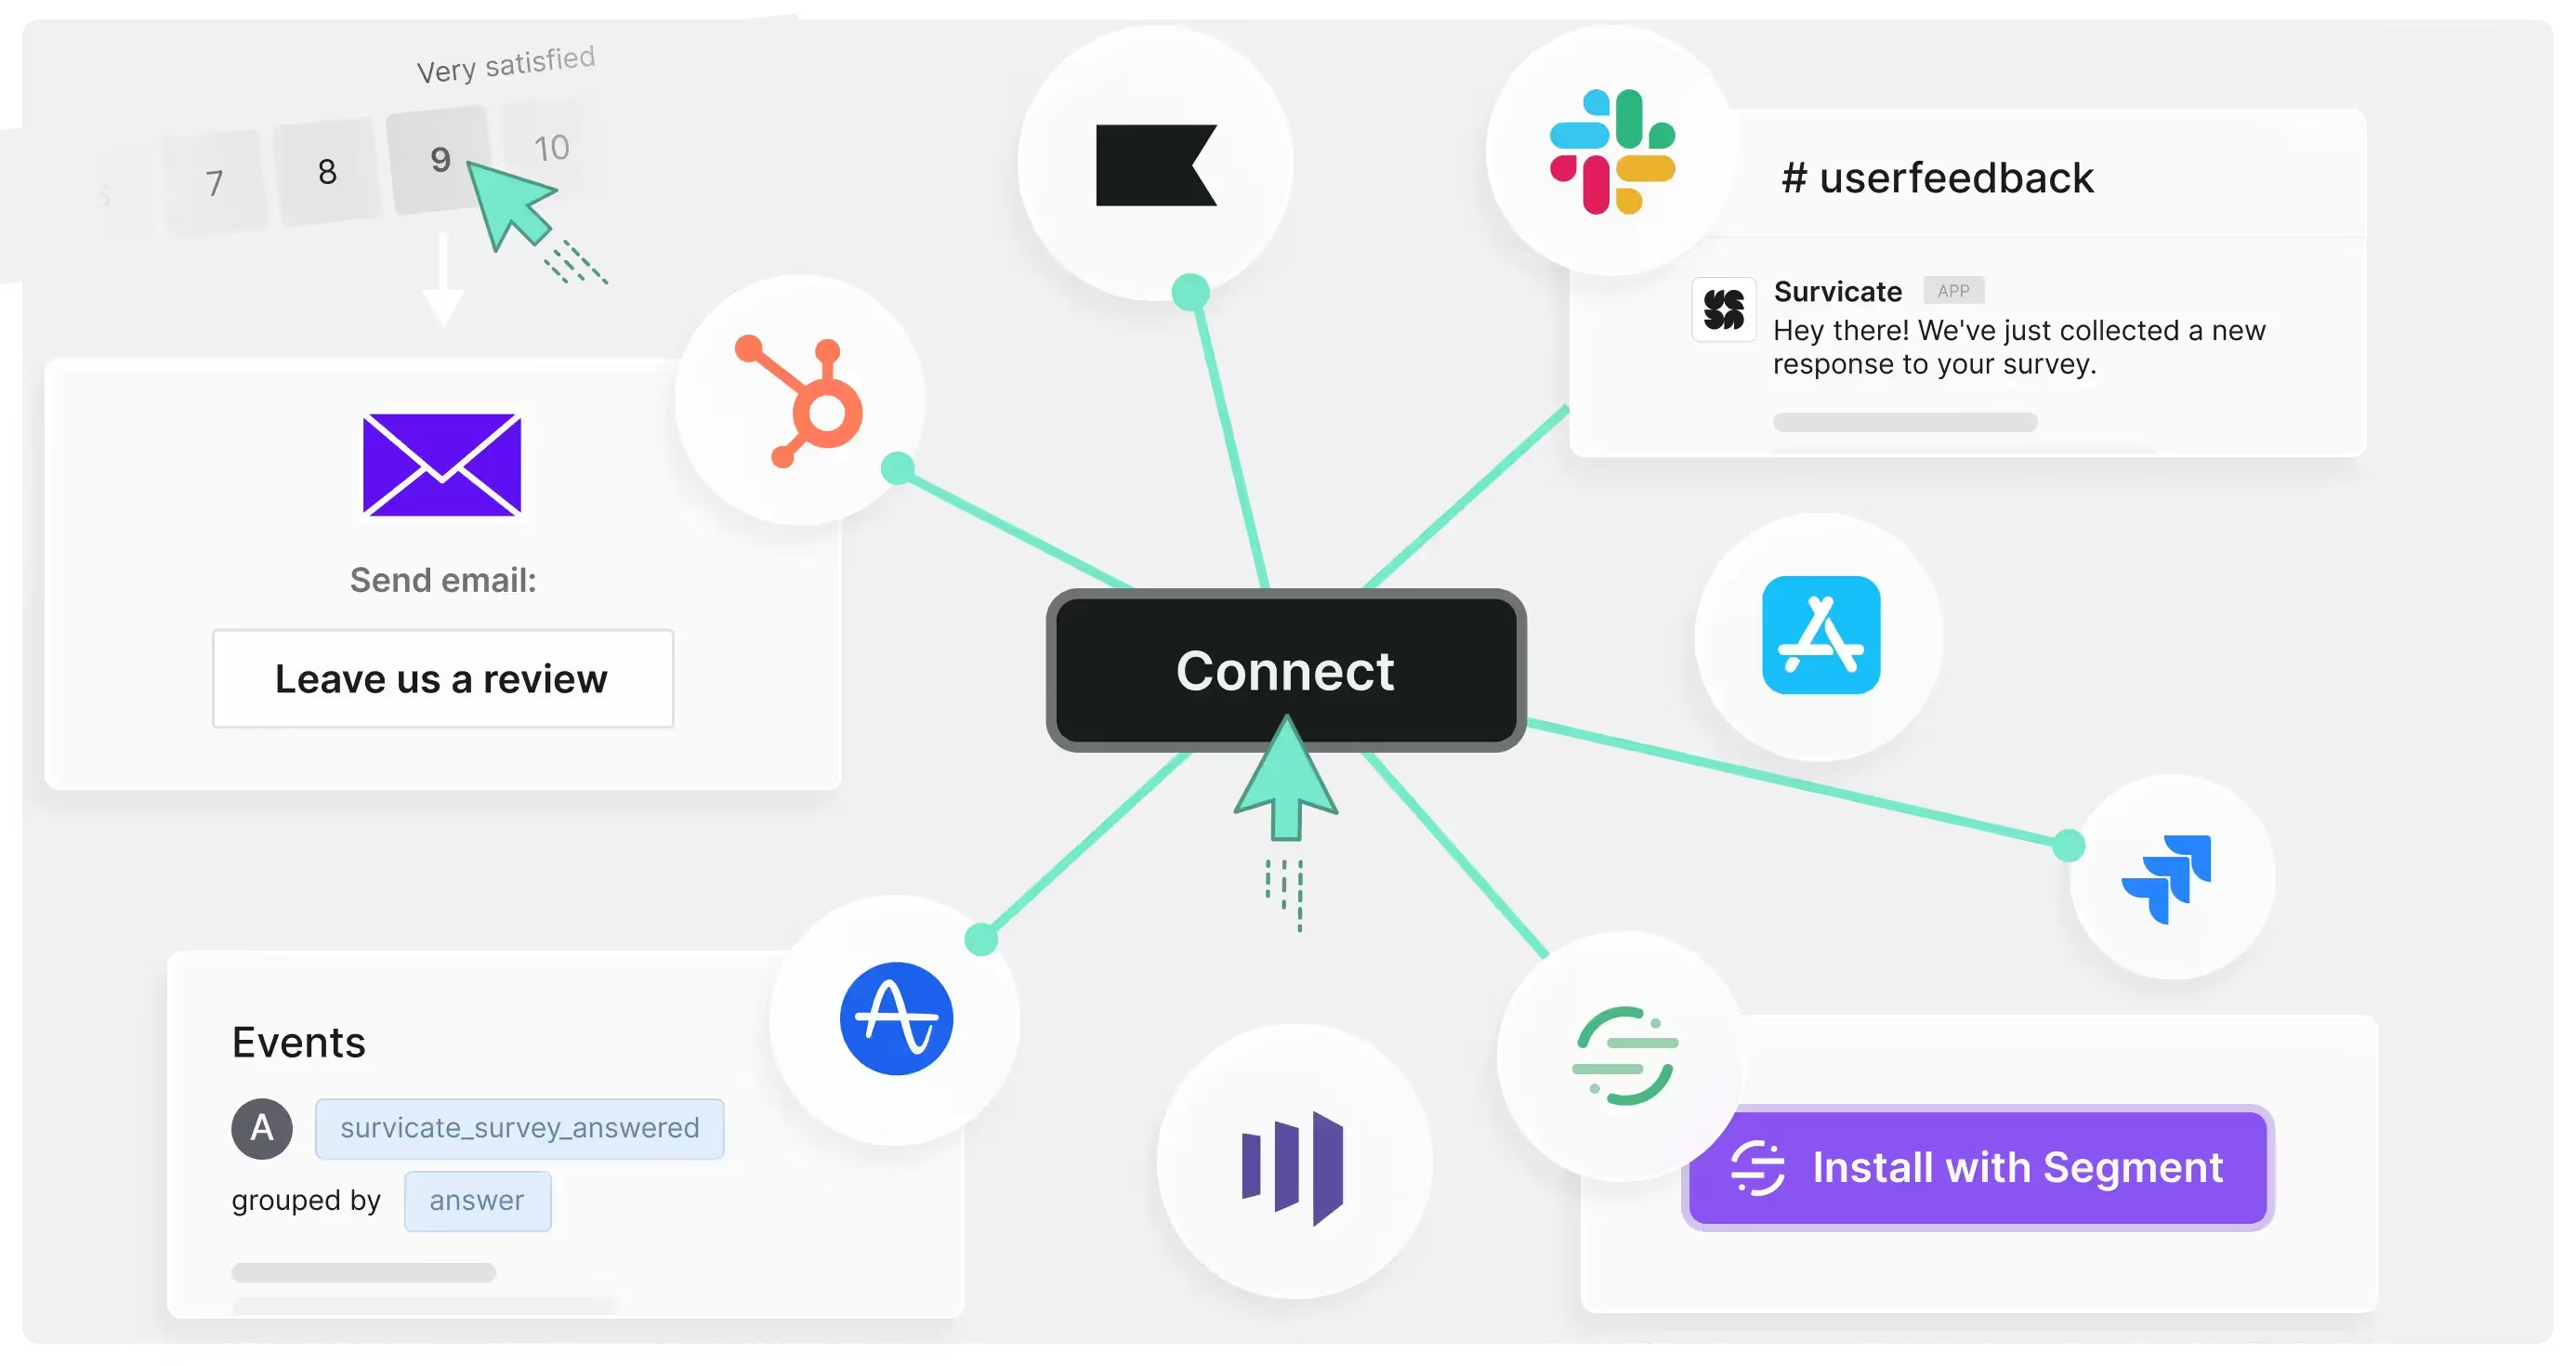
First, share all the important insights with your team, whether that’s product marketing, support, sales, or shareholders. Everyone will be on the same page, and will be able to apply the learnings within their fields and expertise.
With Survicate, you can easily share automatically extracted insights with others in the team integrating with Slack (and more). Trigger automatic notifications sharing new pieces of feedback in just the right channels.
For example:
- Set up real-time Slack notifications when someone submits a low NPS or CSAT score.
- Tag critical responses in Survicate and sync with Productboard or Jira for product or ops teams to triage.
- Use Intercom to create a new support ticket immediately from a negative open-text comment.
You can also go ahead and share a weekly “feedback digest” with themes, scores, and quotes, celebrate wins from promoters, and own failures from detractors.
Then? Use it across teams to make a change.
Your feedback shouldn’t live in a vacuum. Push it to where it can spark change:
- Product: add tagged feedback to dev tickets (with Survicate you can do it all automatically, with 40+ native integrations)
- Marketing: pull quotes from promoters into your copy or landing pages
- Support: train teams on common frustrations or top complaints and how to resolve them to increase the customer lifetime value
- Sales: use objections and praise to improve pitch, onboarding materials, demos
If you’re unsure what to do exactly, it’s also safe to A/B test based on the collected feedback.
- Is onboarding too long? Try shortening flows.
- Are users confused about pricing? Clarify copy.
- Do users want feature X? Run a survey to validate it before building.
Use feedback to form hypotheses → test → re-measure satisfaction.
External feedback loop closing
Besides just spreading the information across teams, don’t forget to use the information to get back to your customers.
Automate how you respond, especially to NPS or CSAT scores.
You can send personalized follow-ups to detractors via tools like Intercom, Customer.io, or HubSpot:
- Trigger a custom email: “Sorry we missed the mark—here’s what we’re doing about it.”
- Assign a conversation in Intercom: open a chat with your support team instantly.
- Tag the user for a follow-up call by success or CX teams.
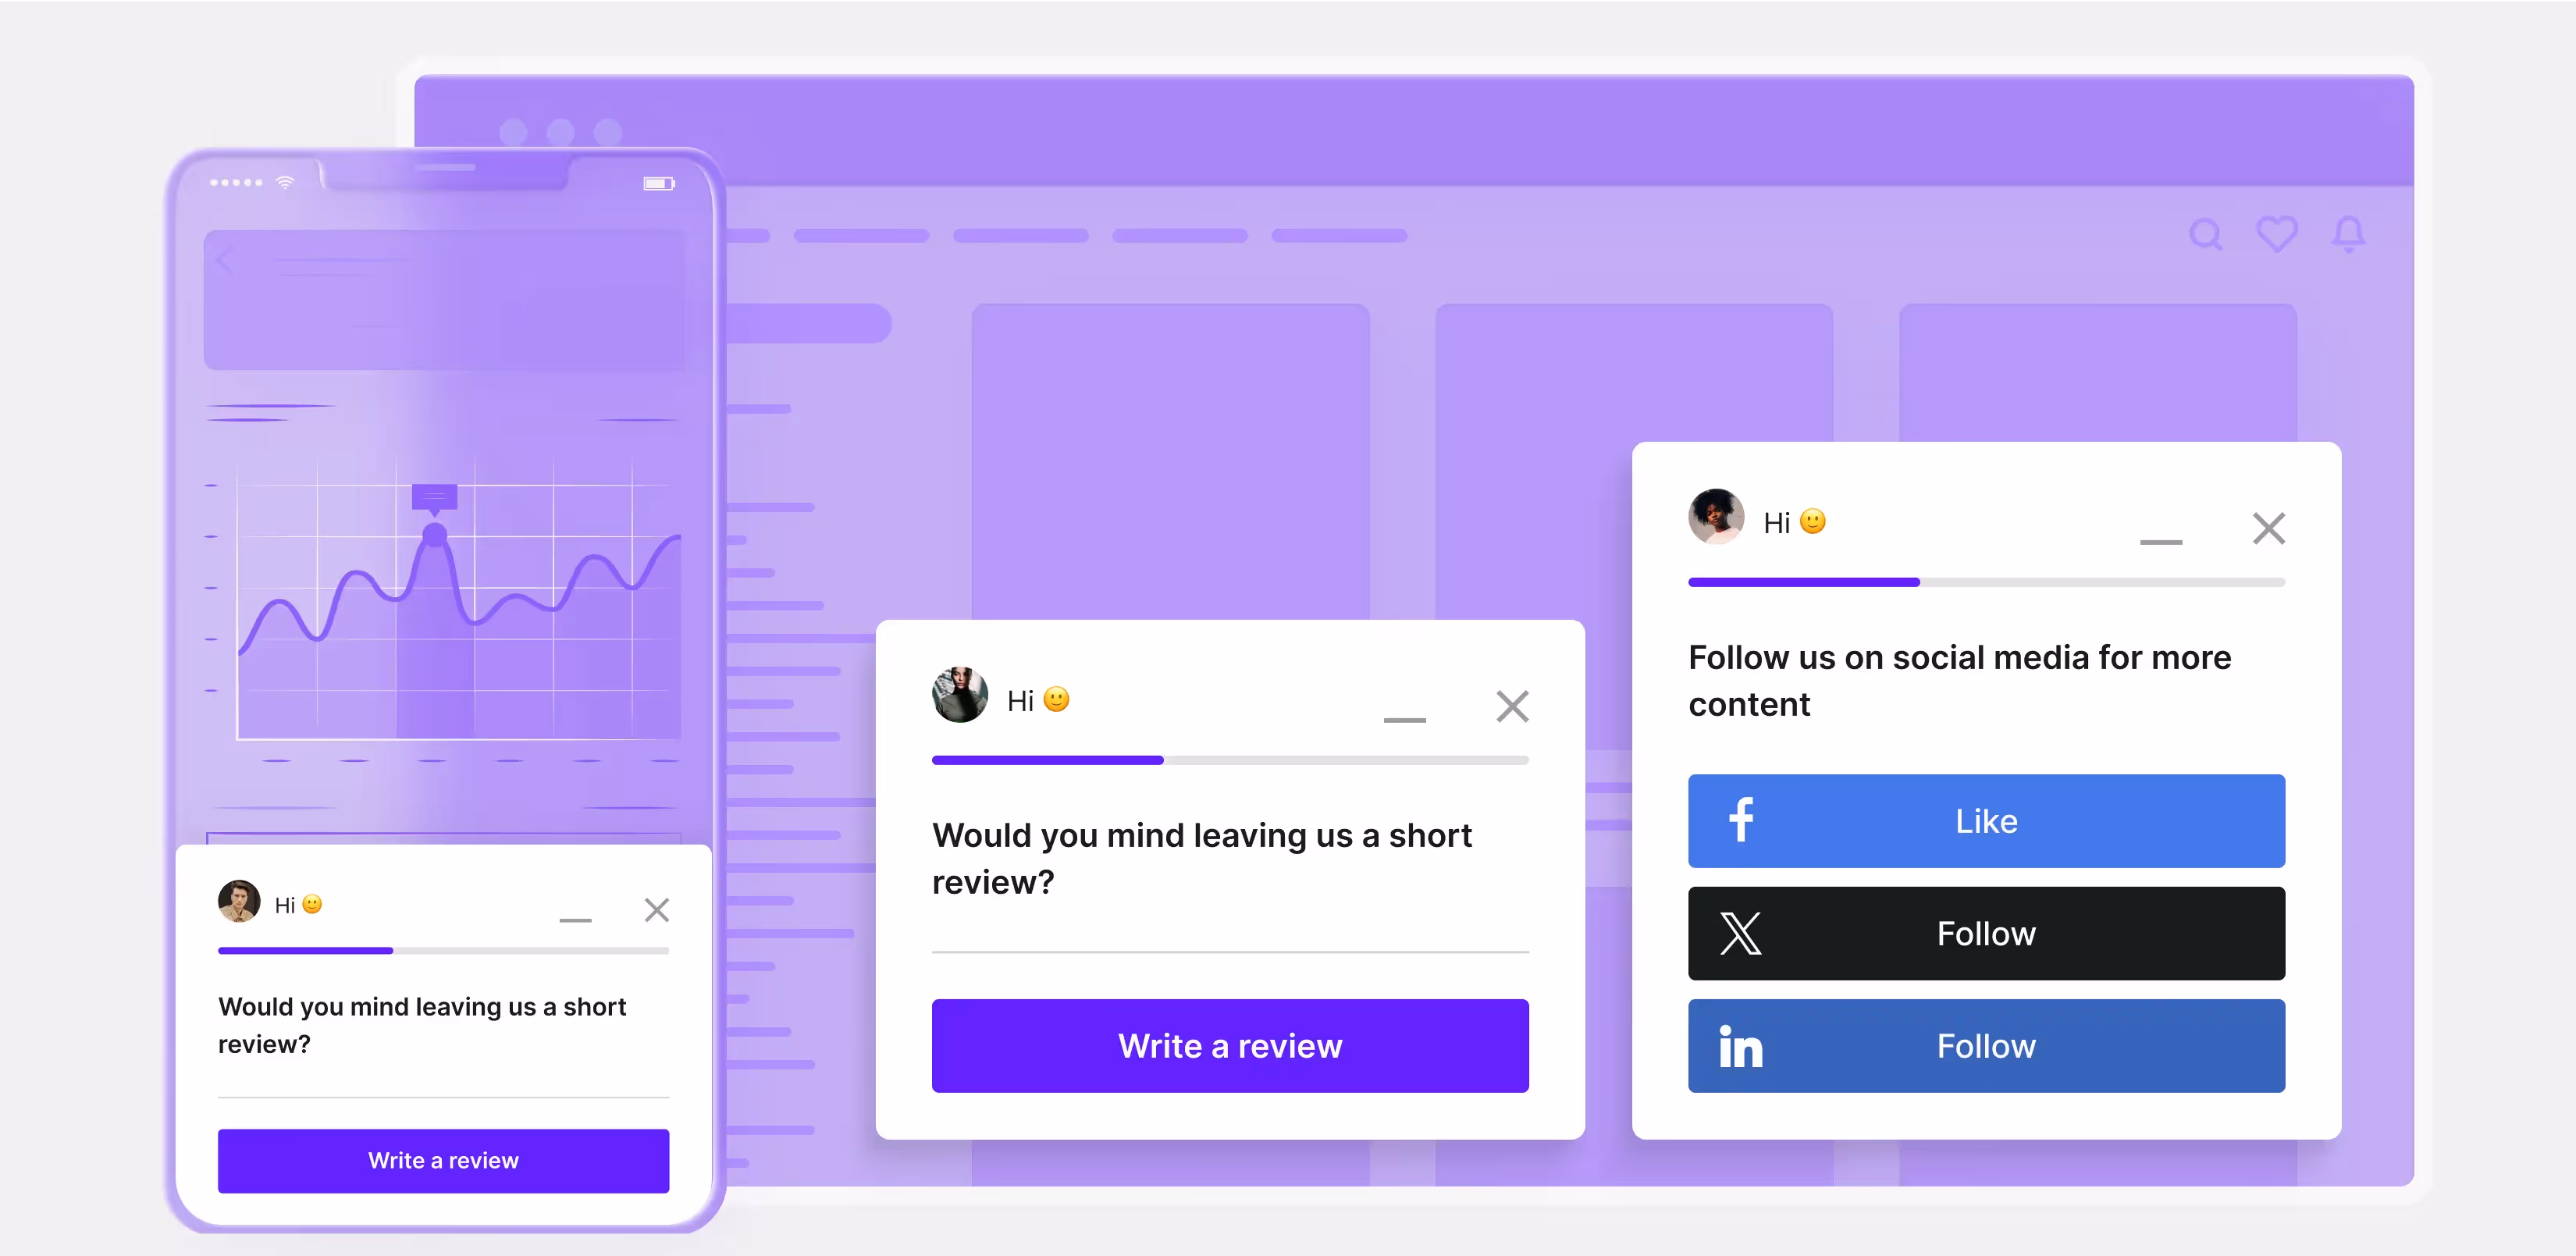
For example, for promoters:
- Trigger a testimonial request email automatically (e.g., via HubSpot or Braze).
- Invite them to join your referral or affiliate program.
- Redirect them to a G2 or Capterra review link—while they’re feeling good.
Like Wahi that saves 10h+ weekly combining Survicate feedback with HubSpot workflows.
.avif)
Your marketing and product teams shouldn't guess what matters to users—feedback tells you exactly what resonates.
You can also automate campaigns based on themes:
- Launch a “You asked, we built it” email campaign for features frequently requested in surveys.
- Highlight popular pain points in landing page copy (e.g., "No more complex onboarding").
- Turn common feedback into FAQ blog posts or product tutorials.
Use feedback to fuel social media:
- Create a mini case study from user praise.
- Share quotes from real users (with permission) as part of your brand storytelling.
- Build a product changelog or teaser campaign based on "top requested features."
Customer satisfaction scores can help personalize the entire customer journey.
- Users who rate your onboarding CSAT below 3/5? Enroll them into a recovery flow with extra help docs or personalized support.
- Users who submit praise for a specific feature? Send them early beta invites to test similar releases.
- Customers who leave product-related complaints? Automatically assign them to a product specialist or success manager.
Use your customer engagement platform (like Braze, Customer.io, Intercom, or Salesforce) to build these workflows.
Want to make this dead simple?
You don’t need to duct-tape five tools together just to ask smart questions, analyze the answers, and act on the data.
Survicate helps you:
- Run CSAT, NPS, CES, and open-text surveys across all channels
- Trigger surveys in-product, via email, mobile apps, or chat
- Analyze customer satisfaction levels and provide results instantly with AI-powered Insights Hub
- Automatically close the loop via integrations with Slack, Intercom, HubSpot, and more
You can start for free, book a demo, or review some more customer stories to make up your mind.
Let feedback do more than sit in a dashboard—make it drive real decisions, automatically. Gain a competitive advantage with feedback.


.svg)

.svg)

