
In today's fast-paced digital landscape, understanding and catering to users' needs is crucial for success. This is where user experience (UX) research comes in. This indispensable discipline provides valuable insights into users' behaviors, expectations, and preferences.
Whether you're a seasoned UX professional, an aspiring researcher, or simply curious about the process, this in-depth guide will walk you through the fundamentals of UX research, its importance in crafting engaging and user-friendly products, and the various methods you can use to uncover invaluable data.
Let's dive in and discover how UX research can help you understand your users better, create more intuitive products, and improve your bottom line.
What is user experience (UX) research?
User experience (UX) research is the process of systematically studying and understanding the needs, expectations, behaviors, and preferences of users to inform the design and development of your products, services, or systems.
Thanks to UX research, you’ll be able to create user-centered designs by empathizing with users, gathering insights about their experiences, and ensuring that the end product is usable, accessible, efficient, and enjoyable.
What are the benefits of UX research?
With countless alternatives at your users’ fingertips, making sure that your solution caters to your target audience’s needs is what can make or break your business.
Simply put, the more you know about our users, the better equipped you will be to create products and services that don’t just resonate with them but provide an outstanding experience.
From improving usability to reducing costs, there are many benefits of conducting user research, some of which you’ll find below.
Understanding your users
Nothing will help you understand your end users better than engaging with them directly and collecting their feedback.
By employing a variety of UX research methods at different stages of development, you will delve deep into their needs, behaviors, motivations, expectations, and pain points, which ultimately will enable you to design and develop better products and services.
Depending on your needs, you can focus on research methods that probe users’ direct experience with your solution or opt for an approach that will tell you more about who they are as people, not merely end users.
You can also create your buyer personas, for instance by using the survey template below:
Improving usability
Once you get a thorough understanding of your users, you’ll be able to take relevant steps to improve the usability of your product or service in line with their needs and preferences.
When you approach UX research with this goal in mind, you can define the specific aspects of usability you want to improve, such as navigation, accessibility, or task completion.
Focus on the most critical usability issues that have the most significant impact on the user experience.
You can run the UMUX survey to evaluate the usability of your website or product:
Reducing costs
UX research can help you reduce costs in several ways.
In the initial stages of development, it will allow you to identify usability issues and user needs before you invest significant resources in the process. Addressing these issues early on is more cost-effective than making changes after the product is built or launched.
UX research can also help you spot potential pitfalls and barriers to user adoption, reducing the risk of product failure.
Supporting inclusive design and social impact
By conducting UX research with diverse users, you can better understand the barriers and pain points that may exclude specific user groups from fully enjoying your product or service.
For instance, you’ll be able to identify areas where you need improvements to meet accessibility guidelines and standards (e.g., WCAG), uncover cultural differences and preferences, and promote inclusive design.
Navigating technological change
UX research can help you understand how users perceive and interact with new technologies, and identify potential barriers to adoption and areas for improvement.
It will also help to mitigate the risks involved in introducing new technologies to your processes by providing evidence-based insights into user behavior, preferences, and expectations.
As a result, you’ll be well-equipped to develop products and services that cater to your users, ensuring that they remain relevant and competitive as technology evolves.
User experience research methods
Once you've decided to run UX research, it's time to pick the tools and methods that will suit your needs and provide the best results.
Quantitative UX research methods
Quantitative user research methods provide data that can be statistically measured.
They are particularly useful when making data-driven decisions, identifying trends, and generalizing findings to a larger population.
These methods can help you put a number on the usability of your product, compare the performance of different versions, and tie any UX improvements to your organization’s goals and KPIs.
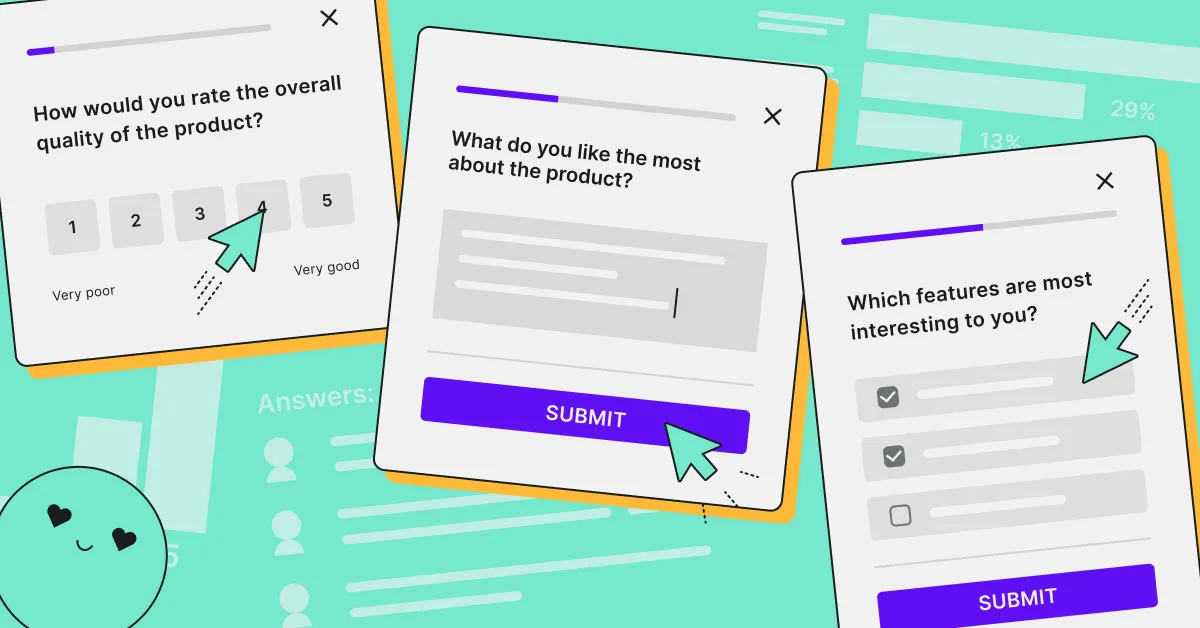
Surveys
Online surveys are one of the most popular and cost-effective methods for collecting quantitative data. They are particularly useful when you need to gather data from a large and diverse population.
Surveys typically consist of a series of questions designed to capture specific information about users, such as demographics, preferences, and behavior.
The easiest way to incorporate surveys into your UX research is by using an automated survey tool, such as Survicate, which comes pre-loaded with hundreds of UX research survey templates:
Web analytics
Analytics, often used to guide marketing strategies, can also be used in user research to understand user behavior on your website or app.
It can be used to supplement and provide more context to your existing user research methods and processes.
According to the Nielsen Norman Group, analytics and other web data can be useful in:
- Issue indication: Letting the team know about any potential problems
- Investigation: Identifying potential causes of issues
- Triangulation: Adding data to supplement qualitative research
Tools such as Google Analytics, Adobe Analytics, Smartlook, and Mixpanel can provide you with metrics such as:
- Users/unique visitors
- Average session duration
- Page views
- Unique page views
- Bounce rate
- Goal completions
Although analytics is great for providing reliable behavior data to guide your design changes, they have downsides, too. While they can tell you why a certain page has a short average session duration, it will not tell you why and how to fix this problem.
A/B testing
A/B testing, also known as split testing, is used to evaluate the effectiveness of different variations of a product or service.
Using this method, you can present two or more variations (A and B) to your users, and measure each one’s performance based on specific goals such as click-through rates, conversion rates, or time spent on a page. The variation that performs better is then the one you should implement.
Usability testing
This quantitative research method measures how well users can complete specific tasks when using your product or service to identify usability issues and inform design improvements.
Participants are given a set of tasks to complete while using the product, and their performance is measured in terms of success rate, time to complete tasks, and error rate. The data you’ll get will help you identify areas of improvement and inform design decisions.
We wrote about the different usability testing tools you can use in a separate blog post. Among them are surveys, including the template below:
💡 YOU MAY ALSO BE INTERESTED IN: After scenario questionnaire survey template
Eye tracking
Eye tracking will not provide a solution to every UX issue you might have, but for those it does, it can be incredibly useful.
The method consists of measuring users' eye movements as they interact with your product or service. This data can help you understand where users focus their attention and how they visually navigate the website or app. Seeing through the eyes of your consumers will give you access to insights that often go unnoticed.
However, eye-tracking studies typically involve specialized hardware and software, so it they might not be possible or practical in certain circumstances.
Clickstream analysis
Clickstream analysis looks at where the users click and how they navigate the page or app.
Thanks to this method, you can collect data on user navigation patterns, including the pages your users visit, how long they stay, and what links they click, among others, using tools such as Google Analytics and Adobe Analytics.
On the downside, clickstream analysis is limited to online user behavior, requires careful analysis and interpretation of data, and might not provide insights into why users navigate in a specific way.
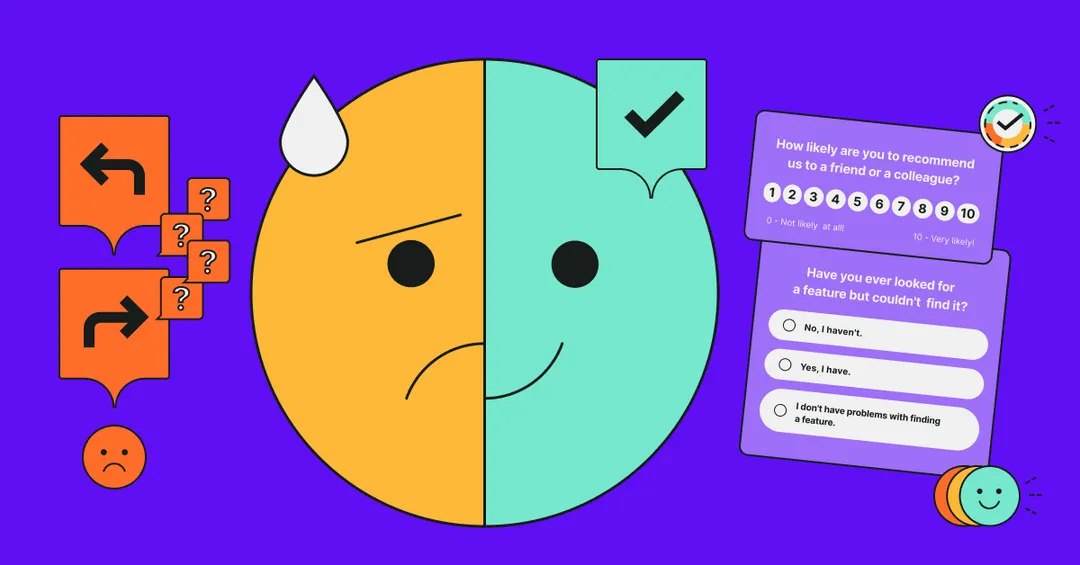
Qualitative UX research methods
Qualitative user research methods focus on providing the ‘why’ behind your data. Unlike quantitative methods, they work well with small sample sizes and help you develop a deep understanding of the UX aspects you’re investigating.
User interviews
One-on-one conversations with users that allow you to gather in-depth insights into user needs, motivations, and experiences. Interviews are a valuable tool for exploring complex issues and understanding the "why" behind user behavior.
Focus groups
A moderated discussion with a group of users who share their thoughts, opinions, and experiences related to a specific product or service. Focus groups are particularly helpful in identifying common themes and trends among users.
Observations
Also known as field studies, observations involve researchers watching users interact with a product or service in their natural environment. This method can provide you with valuable insights into how users behave in real-world situations, revealing potential usability issues and areas for improvement.
Diary studies
A longitudinal research method where users document their experiences with a product or service over an extended period. Diary studies can help researchers understand how users' needs and perceptions change over time.
Generative user research
Also known as exploratory, formative or foundational research, generative research is conducted in the early stages of the design process.
Its primary goal is to “generate” a deep understanding of who your customers are as humans, not just users of your product or service by discovering their identities, goals, and needs in real life.
It can help you build better products that fit their lifestyles, not the other way around.
There are many ways to conduct generative research, including:
- interviews
- observations
- focus groups
- contextual inquiry
Evaluative user research
Also known as validation or summative research, evaluative research is typically used to assess a specific problem to ensure usability and suitability with the needs of your users. It should be carried out throughout the development lifecycle, from early concept design to the final version.
Unlike generative research, which aims to understand the behaviors and identities of your target audience, evaluative research is used to assess an existing solution to make sure it meets the users’ expectations.
Common evaluative research methods include:
- usability testing
- expert reviews
- surveys
- A/B testing
Attitudinal user research
Attitudinal user research is a type of user research that focuses on understanding users' attitudes, feelings, beliefs, and opinions about a product, service, or concept.
It aims to gain insights into users' motivations, preferences, and expectations, which can be valuable for designing and improving products or services that meet users' needs and expectations.
Attitudinal user research typically involves various techniques such as:
- surveys and questionnaires
- interviews
- focus groups
- diary studies
- observation and contextual inquiry
Behavioral user research
Behavioral user research is a type of user research that focuses on understanding users' actual actions, behaviors, and interactions with a product, service, or concept.
It is an empirical research method that aims to reveal how users engage with and navigate through a product, identify pain points and usability issues, and uncover opportunities for improvement.
Importantly, this type of user research can be both qualitative and quantitative, depending on the data collected and the research objectives.
Some common techniques used in behavioral user research include:
- usability testing
- A/B testing
- eye-tracking studies
- field studies
- card sorting
Moderated user research
Moderated user research is a type of user research methodology where a researcher, also known as a moderator, guides participants through a study to gather insights and feedback about a product, service, or concept. The moderator's role is to facilitate the research process, ask questions, probe for deeper understanding, and ensure that the participants stay on track during the session.
In a moderated user research session, the researcher may use various techniques, such as in-person interviews, focus groups, usability testing, or contextual inquiry, to collect valuable information from users.
Using this method offers plenty of flexibility. You can, for example, ask follow-up questions in real time and adapt the approach based on the participant’s responses as well as observe non-verbal cues.
However, moderated research might be time and resource-intensive and challenging to conduct with a large number of participants.
Unmoderated user research
Unmoderated user research is a type of user research methodology in which participants complete tasks, answer questions, or provide feedback on a product, service, or concept without the direct guidance of a researcher or moderator.
This type of research is typically conducted remotely using online tools and platforms, allowing participants to complete the study at their own pace and in their own environment.
Some common unmoderated user research methods include surveys, online usability testing, card sorting, and diary studies.
As part of your research, you can send out this short survey to discover the improvements and optimizations they’d like to see:
How to conduct user research
Start off your UX research by creating a plan which will outline information such as:
- the purpose of the research
- who will conduct it
- the methods you will use
- target participants
- schedule, including any deadlines
- how insights will be documented
- technical setup, if relevant.
Having a plan of action is particularly important if you’re just getting started as it will give you a framework to work within.
1. Define the objectives of your research
Your research objectives should address specific problems or questions, such as:
- Identifying user pain points in the current product
- Testing the usability of a new feature
- Assessing user satisfaction with a redesigned interface
- Understanding user preferences for a specific product feature
Having well-defined objectives will help guide the selection of research methods and ensure that your research is focused on the aspects of the user experience that matter most to you at a given time.
2. Select research methods
In this article we outlined several UX research methods but there are many more you might want to use. Each of them has its own strengths and weaknesses, and your choice should depend on the objectives of the study and available resources.
You might benefit from using a combination of methods to gather a more comprehensive understanding of your user experience.
3. Recruit participants
To obtain reliable results, try to recruit a diverse and representative sample of users, including participants of different ages, genders, occupations, and levels of experience with the product.
You can use the following strategies to identify participants:
- Leveraging existing user databases or customer lists
- Partnering with a professional research firm
- Posting advertisements on social media or online forums
- Offering incentives, such as gift cards or discounts, to encourage participation
Provide as much information about the study as possible to make sure you get informed consent from every participant.
4. Prepare research materials
Any necessary research materials, including surveys, interview guides, or usability testing scripts, should be prepared in advance and tailored to the research objectives and methods you use.
When designing your research materials, consider the following guidelines:
- Use clear, concise language that is easy to understand
- Avoid leading questions or bias that could influence participants' responses
- Include a mix of open-ended and closed-ended questions
- Pilot test the materials with a small group of users to identify any issues or areas for improvement
5. Conduct the research
Once you’ve established the objectives, methods, participants, it is time dive in and start the research. Throughout the research process, keep in mind to:
- Record detailed notes and observations
- Remain flexible and adapt the research approach as needed based on emerging findings
- Maintain user confidentiality and obtain consent
6. Analyze and present the results
In the final step, organize and analyze the data you collected. Identify any patterns and themes: look for recurring issues, trends, or insights that emerge from the data. Interpret findings in the context of research objectives and present your conclusions, including any actionable recommendations, to your organization’s stakeholders.
User research best practices
To get the most out of your UX research, pay attention to these tips and best practices.
Make user research everyone’s responsibility
While having a dedicated UX department is important, everyone in your organization, including product management, development, marketing, customer service, and design, can and should conduct user research.
By empowering non-researchers within your organization to collect customer feedback, you’ll get access to expert insights without relying solely on experts.
Democratizing user research will also help you improve numerous processes by focusing on what users need and want at every point across their journeys.
Identify your target audience
Identifying your target audience is the foundation of successful UX research. It will ensure that the insights you gather are relevant to the users who will actually use your product or service.
By focusing on the right user group, you can maximize the impact of your UX research and design efforts and create tailored user experiences that cater to their specific needs, leading to higher user satisfaction, increased engagement, and improved user loyalty.
Select the right research tools
UX research tools can automate processes and help you streamline workflows, but you need to select the most appropriate ones for different stages of your research.
You might need to have a number of tools at your disposal to plan, organize, and manage the research process as well as collect user feedback.
Some of the most commonly used solutions include:
- Notion
- Miro
- Airtable
- Userzoom
- Userlytics
- Survicate
- Loop11
Prioritize user privacy and ethics
Maintaining participants’ data privacy and security at all stages of the UX research is crucial to protecting it from breaches and cyber threats as well as establishing transparent relationships.
Clearly inform the participants about the purpose of your research, the methods you'll be using, how their data will be stored and used, and any potential risks or benefits. Make sure you obtain their explicit consent to participate.
You should also remove any personally identifiable information from the data you collect. This may include names, email addresses, or other sensitive information that could be used to identify a participant.
Ensure that your data storage and sharing methods are secure— use encryption, password protection, and other measures to prevent unauthorized access.
Conduct UX research regularly
Regular testing while designing and implementing your solution will give you real-time feedback on any changes you make, minimizing the risk of producing features that no one will use.
Being proactive about user research at all stages of the development process will also provide you with plenty of insights into your customers’ behavior, expectations, shopping patterns, and identities to inform your strategy.

Better user research with UX surveys
As user expectations evolve, the importance of UX research will only grow, making it a critical skill for anyone looking to create meaningful, impactful digital experiences.
Among the variety of methods we described in our guide, surveys are particularly easy to get started with while providing immediate, direct, actionable feedback.
By using an automated survey tool such as Survicate, you can significantly speed up your UX research. Simply sign up for free, select a survey from among hundreds of ready-to-send templates (translations included), and send it out.
Once you get responses, Survicate will automatically analyze and present all the findings in a dedicated dashboard. Interested? Try it out for free!


.webp)
.webp)
.svg)

.svg)