
Successful UX research is one that dives deep into the user's world, understanding their needs, preferences, and challenges to create solutions that not only solve their problems but also provide a delightful experience.
But what good is UX research if it doesn't translate into actions that drive product development in the right direction?
That's where a well-crafted UX research report comes into play. It helps you translate the findings into actionable recommendations that your stakeholders understand and care about.
In this guide, we’ll show you how to present your raw data in a clear, impactful manner that will turn your report into a powerful driver of design and business decisions.
What is a UX research report?
A UX research report is a document that summarizes findings from your UX research, translating them into a language that is understandable to your stakeholders.
It typically includes data gathered from various UX research methods, such as usability testing, user interviews, and surveys, used during your research process.
The aim of a UX research report is to present the data you gathered in an easily digestible format that enables stakeholders to make informed decisions about product design and development.

The benefits of creating a UX research report
Conducting UX research without acting upon its findings is an exercise in futility. A report can help you gather conclusions and create a coherent plan of action so that no relevant insight is lost.
Here are some of the key benefits you’ll reap by creating a UX research report.
Building empathy for the user
One key purpose of UX research is to build empathy for users among the product team and stakeholders. A well-constructed UX research report vividly conveys user struggles, aspirations, and workflows, fostering empathy and encouraging a user-centered approach to product design and development.
Facilitating consensus
In any product development team, there can be diverse opinions and ideas. A UX research report serves as an objective source of truth that helps align different team members and stakeholders. The clear presentation of user data and findings can foster agreement on priorities and next steps.
Enhancing product value
Insights derived from your UX research reports can help identify opportunities for innovation or improvement, leading to better product-market fit. The report might also reveal unmet user needs or pain points that, when addressed, significantly enhance the value and appeal of the product.
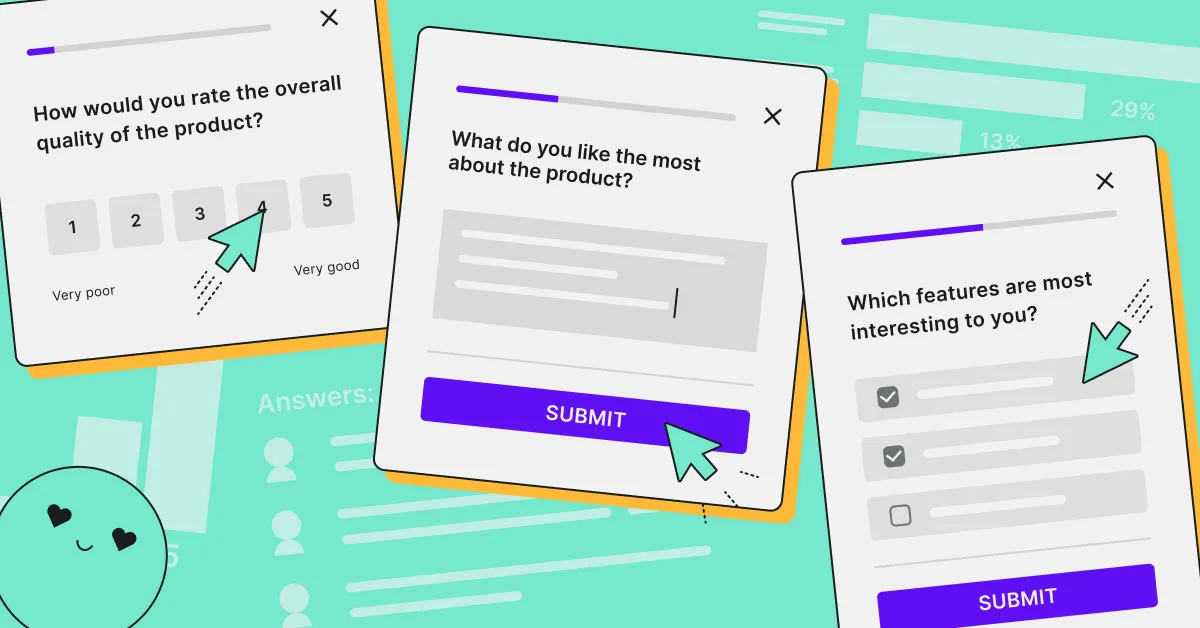
Surveys, including the template below, offer a great to collect user insights on the perceived product value:
Demonstrating ROI
Your UX research reports can also help demonstrate the return on investment (ROI) of UX activities. By connecting the insights and recommendations from the report to measurable improvements in key metrics (like increased user engagement, reduced churn, or improved conversion rates), you can provide tangible evidence of the value of UX research.
Enabling continuous improvement
UX research reports serve as benchmarks that enable continuous improvement. By documenting user insights and experiences over time, these reports help teams track changes in user behavior, measure the impact of design changes, and assess progress toward UX goals.
How to write a UX research report
Now that you know the benefits of a UX research report, let's go into more depth on the essential elements it should consist of.
Introduction
This part of the report lays the groundwork for everything that follows. It should clearly define the product or service you’re working on, the reason behind conducting the UX research, and a high-level overview of the methodology you used.
It can be helpful to articulate any pre-existing assumptions or known issues about the user experience that inspired the research. The introduction sets the tone and context for the entire report, making it essential for engaging your audience.
Research goals
The research goals section is where you articulate what you aimed to discover through your research. It is the guiding light of your entire study and report.
These could include understanding the reason behind a drop in user engagement, discovering how users interact with a particular feature, or finding out what obstacles are causing users to abandon the product or service.
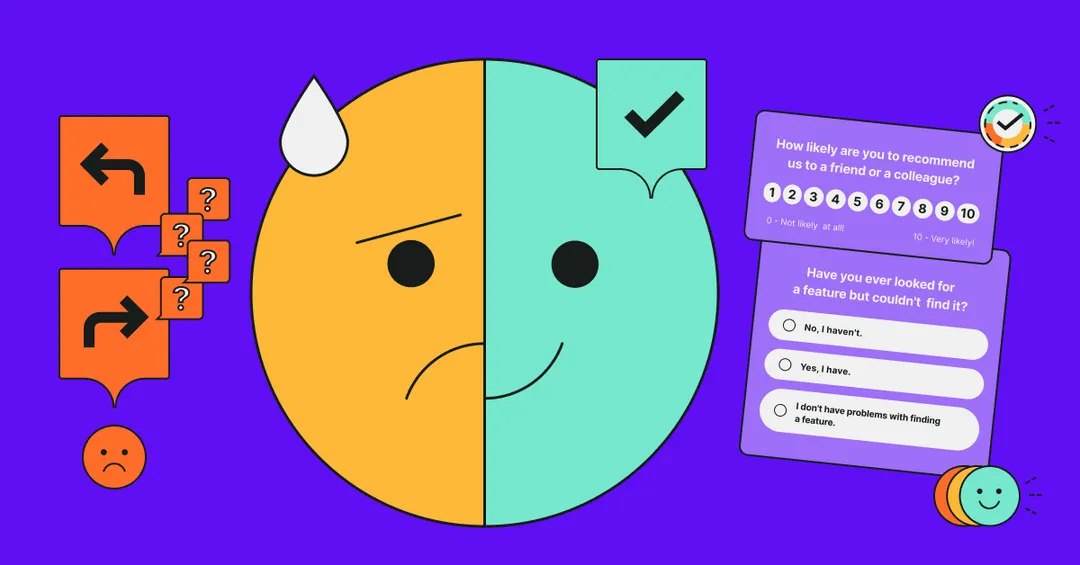
Use the survey template below to discover what stops your customers from completing a purchase:
Business value
Here you should highlight how the UX research aligns with and contributes to the organization's overall goals. You might discuss how improving user engagement can lead to increased revenue, or how reducing user frustration can decrease customer churn. By showcasing the business value, you help stakeholders understand why the research is crucial and how it can impact the bottom line.
Methodology
The methodology section is where you outline the research methods and techniques you used to gather data. This could include surveys, interviews, usability tests, card sorting, heatmaps, and more. For each method, explain why you chose it, how you implemented it, and any particular considerations or challenges. This section allows readers to understand the context of your findings and how you arrived at them.
Key findings
This is the core of your report where you present your research outcomes.
Break down the findings based on research goals or the specific parts of the user journey they relate to and explain the UX metrics you used. To enhance readability, you can use bullet points, numbered lists, or subheadings.
Keep in mind that key findings are recommendations are the two parts your key stakeholders are most likely to skip to, so make sure it’s easy to understand and gets your points across.
Recommendations
The recommendations section is where you offer suggestions for improvement based on your findings. Make sure your recommendations are actionable and specific. It's not enough to say, "improve website navigation"; instead, try something like, "rearrange the main navigation menu items in order of user preference as indicated by our card sorting exercise". The more detailed and precise you are, the more value you provide to decision-makers and those who will implement these changes.
Best practices for writing a UX research report
Crafting a compelling UX research report requires more than just presenting the facts. Here are some best practices to ensure your report is insightful, engaging, and actionable.
Know your audience
Before you even begin to write, it's crucial to understand who will be reading your report. Are they designers, developers, or business stakeholders? Tailor your content, depth, language, and presentation style to their needs and understanding levels. Keep technical jargon to a minimum unless your audience is highly specialized. The aim is to make the report accessible and meaningful to all readers.
Turn your findings into a story
Data alone can be dry and challenging to digest. One way to make your findings more engaging and memorable is to weave them into a story. This doesn't mean fabricating narratives, but rather presenting your data in a way that it forms a coherent, relatable narrative. Data-driven storytelling can help to highlight important trends, reveal user behaviors, and create a compelling argument for your recommendations.
The video below explains how to frame your UX data with storytelling:
Combine qualitative and quantitative data
An effective UX research report marries both qualitative and quantitative data. Quantitative data provides broad strokes—how many, how much, how often—while qualitative data fills in the details, revealing why users behave as they do. Together, these two types of data provide a full, rich picture of the user experience.
Explain and visualize data
Data visualization is a powerful tool for making complex information easier to understand. Charts, graphs, and infographics can all help to convey your findings more effectively. But don't just present data—explain it. Make sure to clearly articulate what each piece of data means and why it's important.

Offer actionable recommendations
Your findings aren't much use if they can't be acted upon. Based on your research, offer clear, actionable steps that your team can take to improve the UX. Be as specific as possible. Instead of saying "improve the checkout process," for example, you might suggest "add a progress bar to the checkout process to let users know how many steps remain."
Use different formats
While a written report is critical, consider leveraging other formats and mediums to present your findings. Infographics, presentations, video summaries, or interactive dashboards can cater to different learning styles and preferences. These can also make it easier for stakeholders to digest and understand your research.
Spread the word
Finally, don't let your hard work go unnoticed. Share your report with all relevant parties—designers, developers, product managers, executives, and even customer service representatives can all benefit from your insights. Consider presenting your findings in a meeting, sharing them via email, or posting them on your company's internal network.
Collect better user data with surveys
UX research reports are a vital cog in the UX design process. They unearth invaluable insights and draw a roadmap toward a more seamless, user-centric product.
The quality of your report is heavily dependent on the quality of the data you collect. One of the most effective tools for this purpose is surveys.
When designed and deployed correctly, surveys provide a wealth of quantitative and qualitative data about your users. They can capture insights into any aspect of the user experience you’d like to discover more about.
With Survicate, you can deploy surveys at any stage of the user journey, on any platform. Simply sign up for a free account, choose from dozens of UX survey templates (or create your own), and start collecting invaluable user feedback.


.webp)
.webp)
.svg)

.svg)