
Since it was introduced in 2003, the Net Promoter Score (NPS) has become an essential customer satisfaction metric. Consisting of a simple question—On a scale of 0 to 10, how likely are you to recommend our company?—it’s an easy-to-implement yet reliable way to gauge customer sentiment and loyalty.
However, many companies are missing out on the benefits of NPS. In this blog post, we’ve summed up some of the most remarkable NPS statistics to show you how awesome NPS is and why you should give it a go.
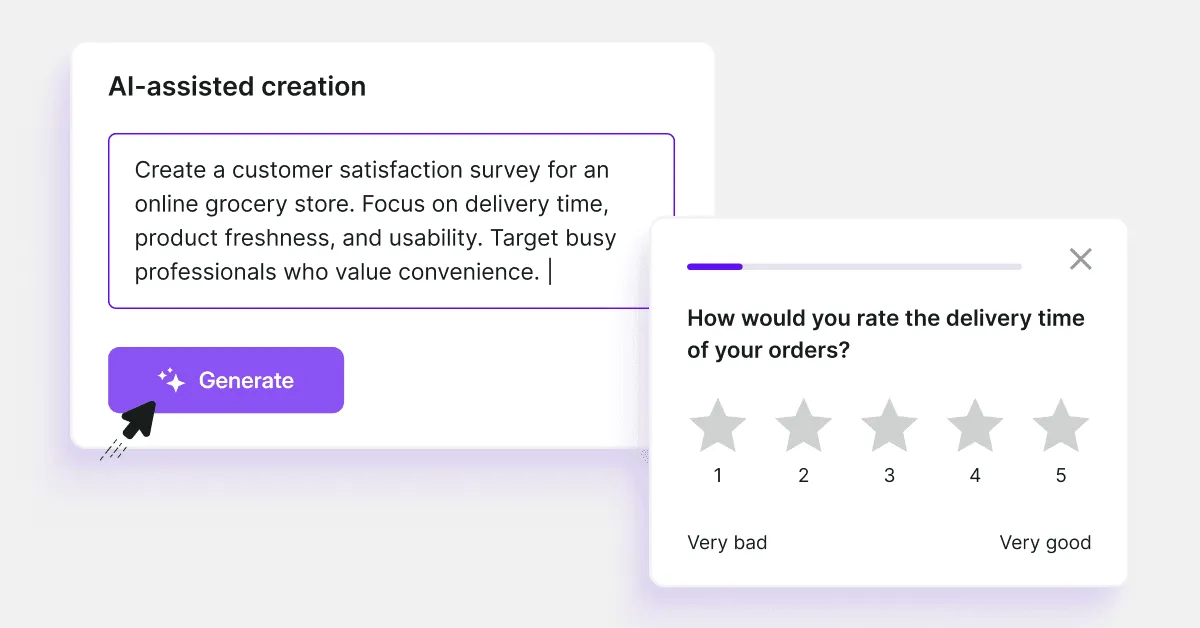
Before we start, here’s an NPS survey template you can use for free:
NPS has been around for 20 years
NPS was developed by Fred Reichheld, a partner at Bain & Company, in 2003 to help companies earn customer loyalty and inspire employees.
Working with data provided by Satmetrix, Reichheld and his team tested a number of questions to find out how well the answers correlated with customer behavior. Their goal was to identify the best question to help predict customer lifetime value. Ultimately, they decided that the NPS question in its current form does the job best.
The research took Reichheld and his team 2 years as they analyzed the correlation between survey questions and business results based on over 4000 surveys.
“As part of our research into customer loyalty and growth, my colleagues and I looked for a correlation between survey responses and actual behavior—repeat purchases, or recommendations to friends and peers—that would ultimately lead to profitable growth. Based on information from 4,000 consumers, we ranked a variety of survey questions according to their ability to predict this desirable behavior.”
Fred Reichheld, "The One Number You Need to Grow"

NPS is extremely popular
In the decade since it’s been introduced, NPS has become one of the most popular and universal customer loyalty surveys. It’s been reported that two-thirds of the Fortune 1000 use NPS to gauge the quality of their customer experience. However, it can be used by companies of all sizes, in any language, and from across different industries.
Despite its simplicity, the metric is designed to inspire companies to deliver customer experiences that are not just acceptable or satisfactory but remarkable.
It’s also an extremely cost-effective way to make data-driven decisions, gather product feedback, and segment a customer base.
NPS can lead to better revenue
According to CustomerGauge research, more than 62% of businesses can’t calculate the ROI of their CX efforts, and as many as 70% are not aware of the impact of the CX on their bottom line.
What’s more, 60% don't know how much each NPS driver is costing them, or the ROI they’re missing out on had they fixed them.
Improving your NPS can help you drive revenue growth. CustomerGauge discovered that a tenfold increase in NPS score correlates with a 3.2% increase in upsell revenue.
In 2005, the London School of Economics conducted a study that found that a 7% increase in NPS correlates with a 1% increase in revenue overall.
In another example of how NPS can be linked to revenue, the Philips Lighting group correlated fluctuations in NPS at the account level with annual revenue growth and decline. Accounts with an increased NPS experienced average revenue growth of 70%, while those with a declining NPS saw a 24% decrease in revenue.

NPS Detractors spread 80% of negative word of mouth
In 1996, Jeff Bezos, the CEO of Amazon, famously said:
"If you make customers unhappy in the physical world, they might each tell 6 friends. If you make customers unhappy on the Internet, they can each tell 6,000 friends with one message to a newsgroup."
The statement holds even more true today than almost three decades ago.
According to Bain & Company, NPS Detractors are responsible for more than 80% of negative word of mouth, which can seriously hurt your growth rates.
For instance, the firm found that Dell, one of the companies it worked with, once had 15% NPS Detractors, which accounted for $68 million of lost revenue. By Bain & Company’s estimate, converting just 2-8% of the Detractors into Promoters, Dell would have grown their revenue by $167 million per year.
Engaging with Detractors and working to solve their problems is crucial.
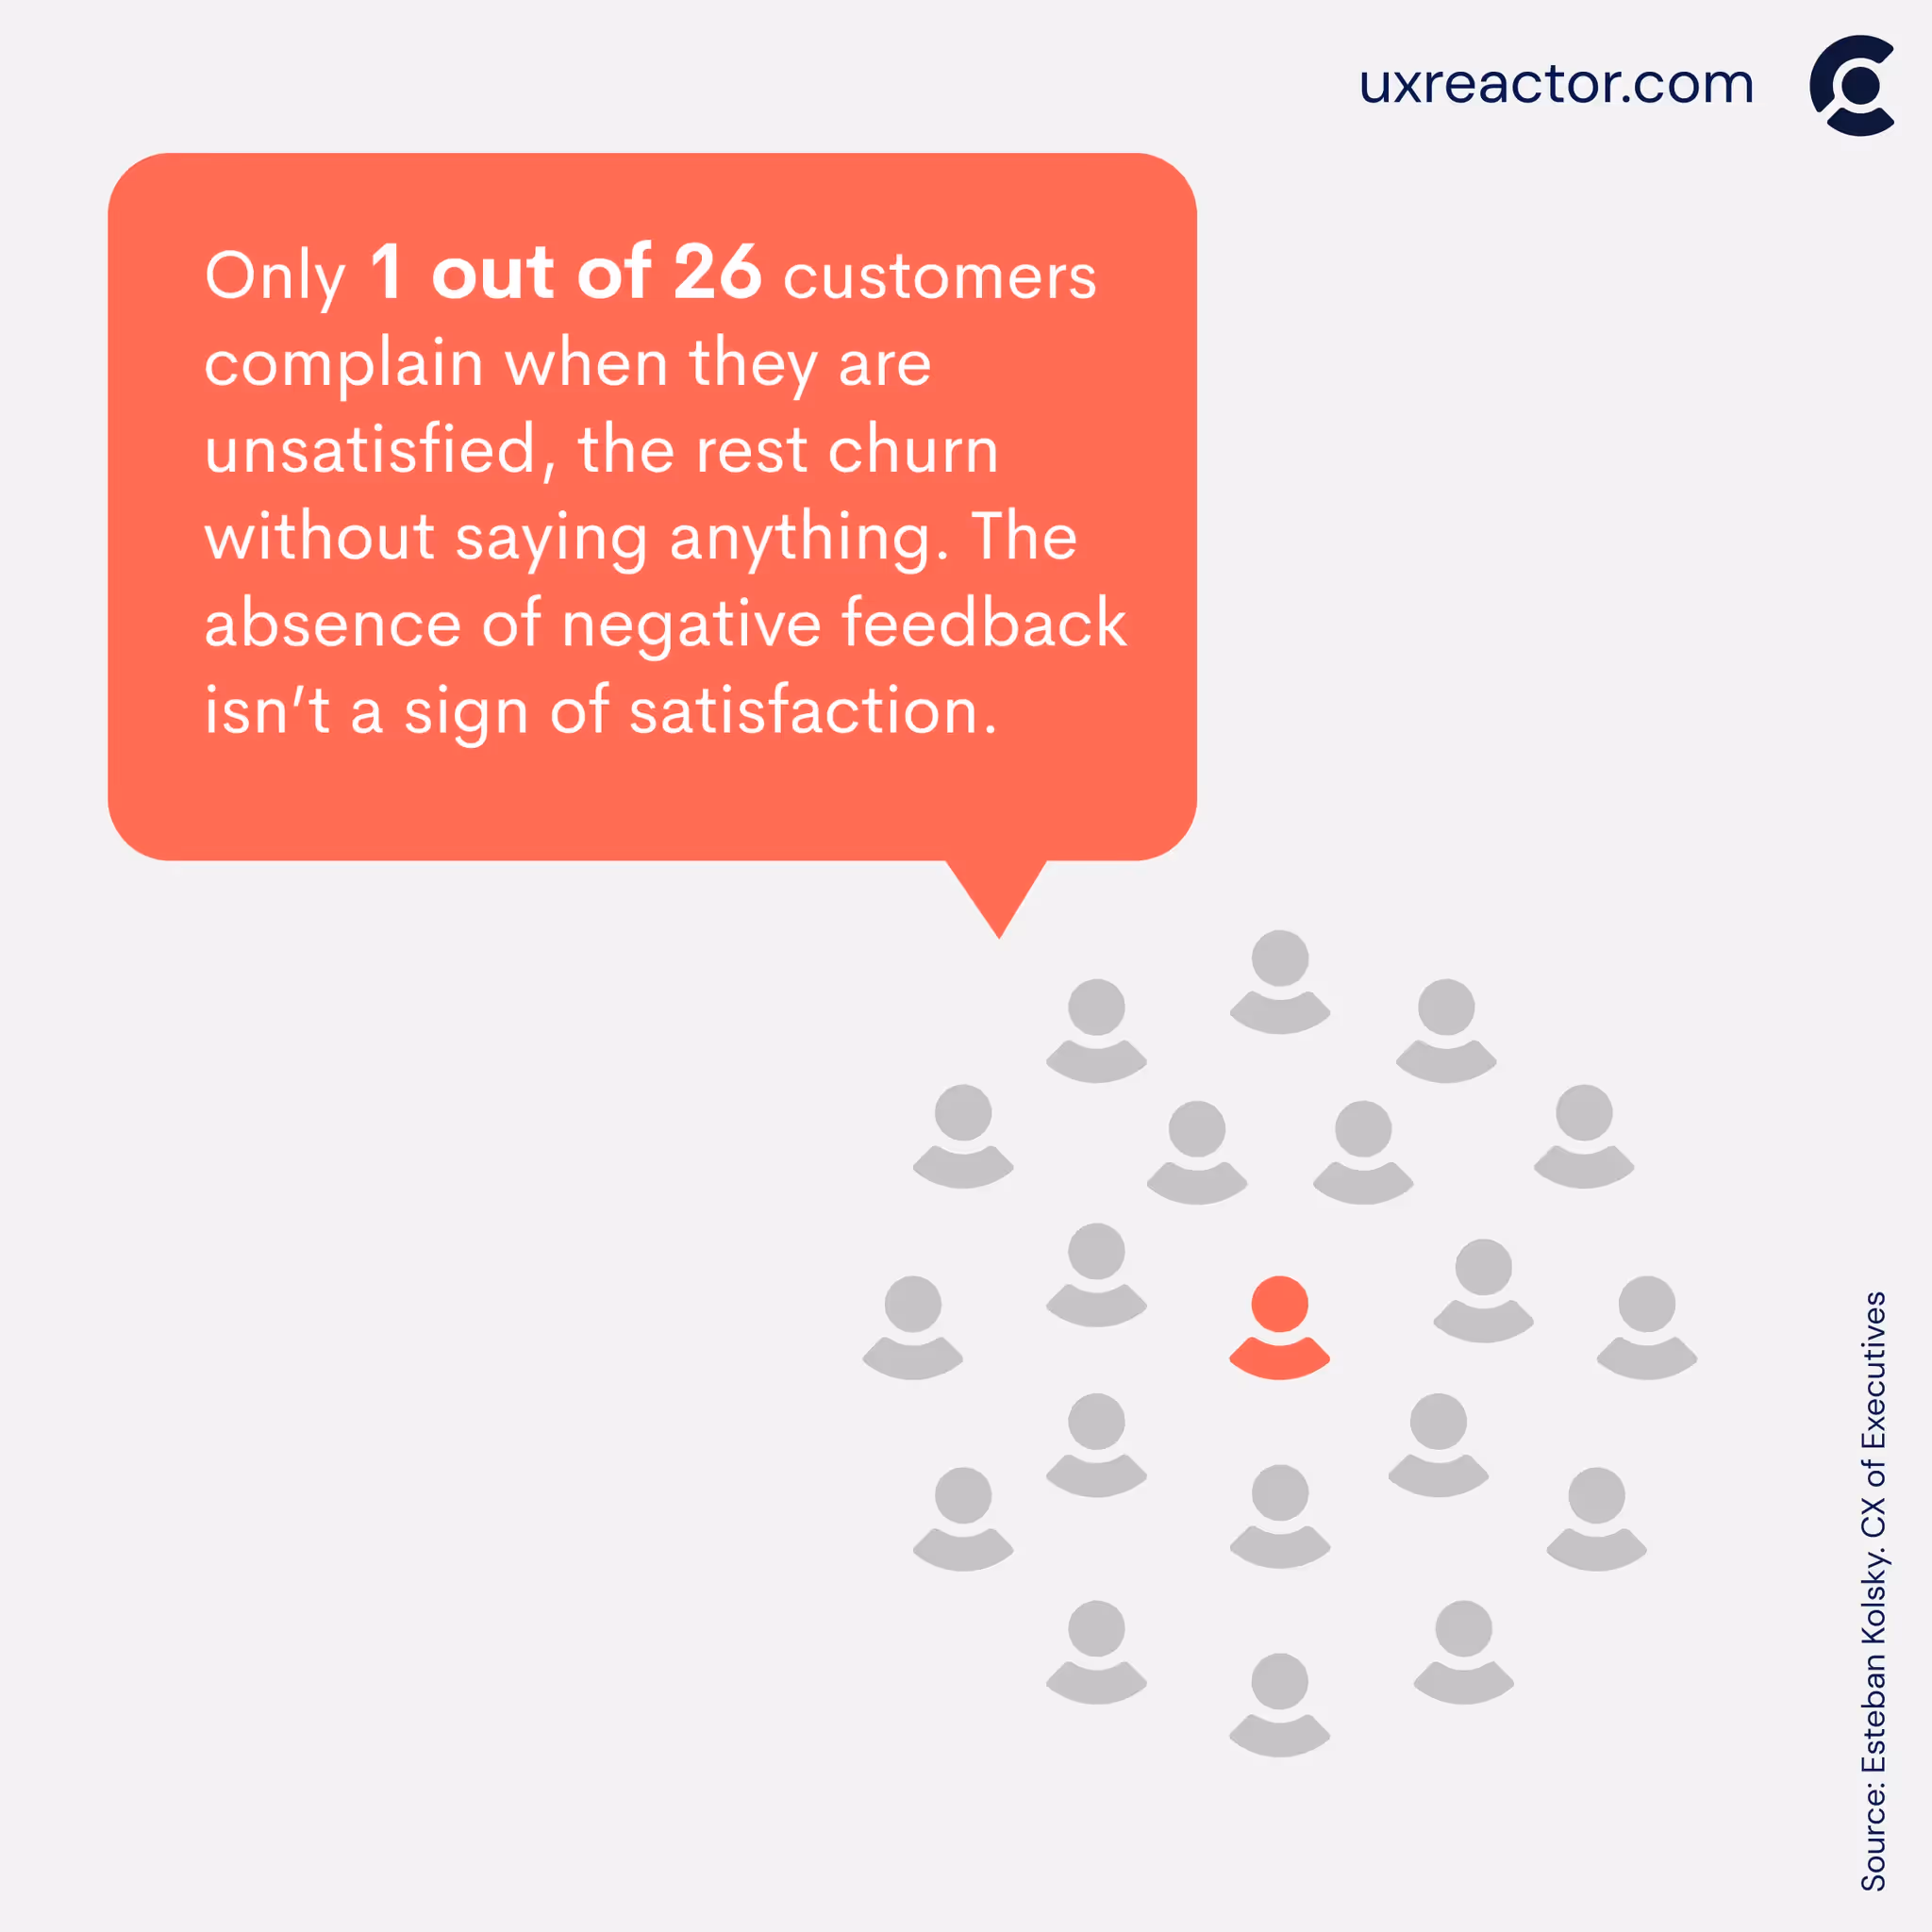
As Esteban Kolsky, CEO of ThinkJar and former Gartner analyst, found in his customer experience survey,
“Only 1 out of 26 unhappy customers complain. The rest churn. A lesson here is that companies should not view absence of feedback as a sign of satisfaction. The true enemy is indifference.”
NPS Promoters are the main drivers of revenue
A group of Bain researchers examining wealthy banking customers discovered that there were differences in profit-driving behaviors among NPS Promoters, Passives, and Detractors.
Promoters, the study found, allocate nearly 45% more of their household deposit balances to their primary bank compared to detractors. On average, they purchase 25% more products from the bank than Detractors, with a product mix leaning towards more profitable checking and savings accounts.
Attrition rates for Promoters are, on average, only one-third of those for Detractors. What’s more, Promoters generate almost seven times as many positive referrals as Detractors.
In a case study of its NPS program, Wajax, a Canadian industrial products and services provider, said that the revenue the company generates from Promoters is twice that of Detractors.
As 80-90% of positive referrals come from Promoters, you should engage with this group regularly and follow up after each NPS survey.
High NPS scores correlate with growth
Since NPS is a leading measure of customer loyalty, it’s no surprise that higher scores are linked to business growth.
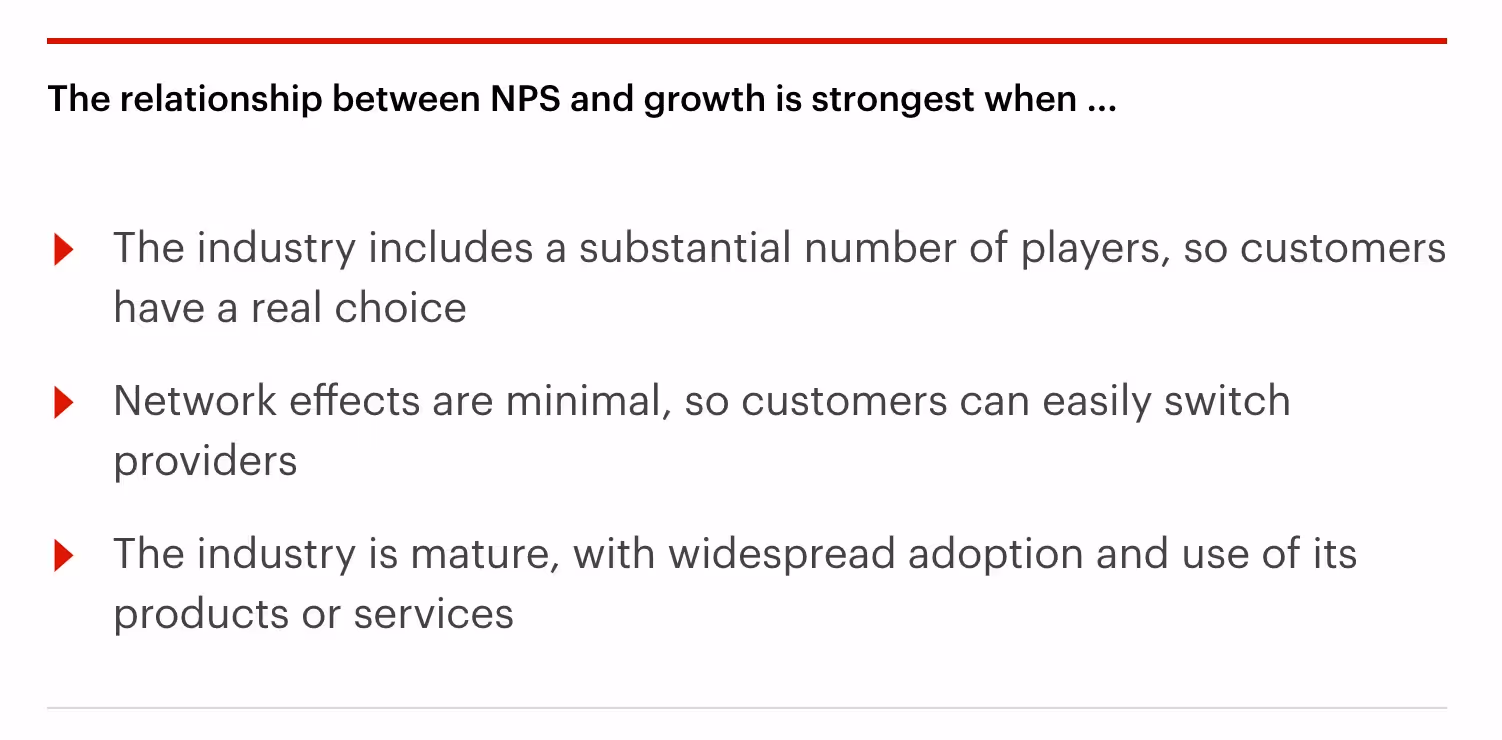
To determine the relationship between relative Net Promoter Scores and growth, Bain teams picked the relevant competitors in a business and assessed each competitor's NPS. Then, they compared these relative NPS scores with organic growth metrics, such as revenue, where public data was accessible.
In most industries, NPS accounted for approximately 20% to 60% of the variation in organic growth rates among competitors. On average, NPS industry leaders surpassed their competitors in growth by a factor of more than two times.
NPS leaders generate higher shareholder returns
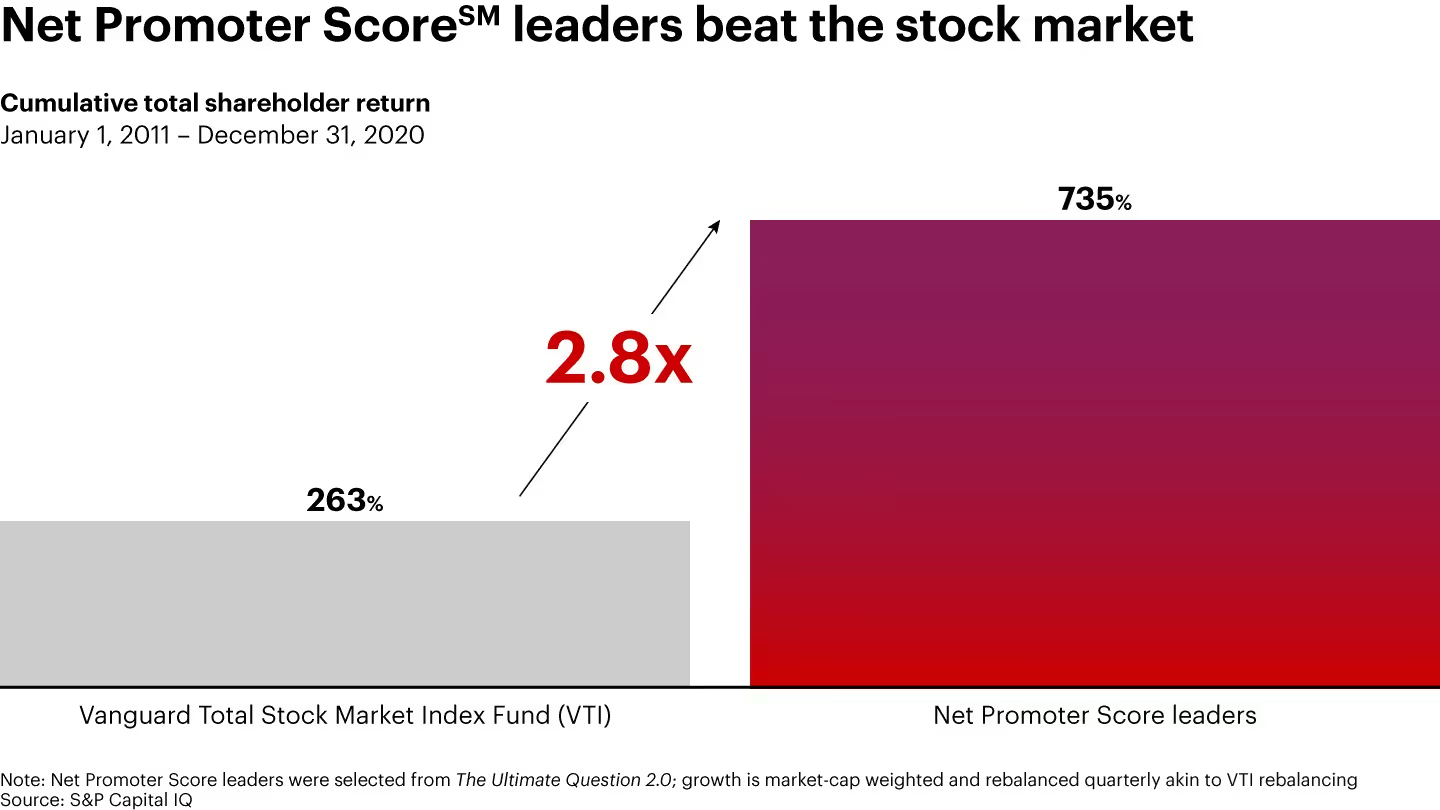
Research has shown that companies with the highest NPS scores generate total shareholder returns 2-3x the market average.
In their 2011 book The Ultimate Question 2.0, Fred Reichheld and Rob Markey listed a dozen (at the time) publicly traded NPS leaders, including Amazon, Meta, Apple, Costco, Alphabet, and American Express. They found that, over a decade, they outperformed the Vanguard Total Stock Market Index exchange-traded fund (VTI) by a factor of 2.8 to 1.
NPS can fluctuate based on external factors
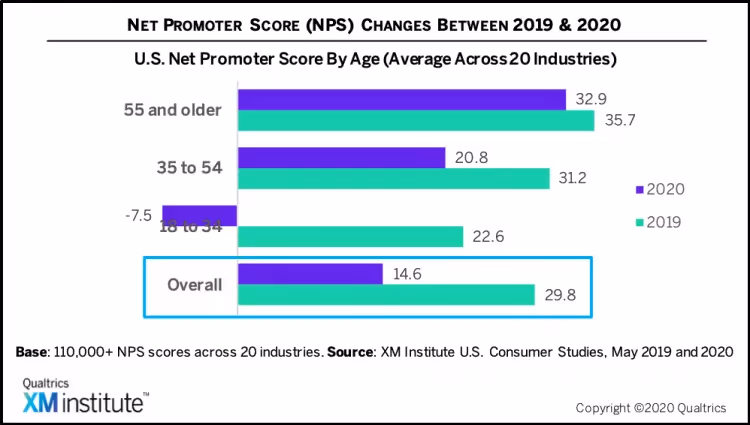
In May 2020, after the outbreak of the Covid-19 pandemic, Qualtrics researched 10,000 US consumers in 20 different industries. It found that the overall NPS score decreased from 29.8 to 14.6 points. The decline was particularly pronounced for tourism and hospitality-related industries, which experienced a drop of 24-28 points due to worldwide travel restrictions.
The reason for the fluctuations can be found in the rapid shift in consumer needs and preferences. As lockdowns forced the entire economy to adapt to the new normal, customers turned to online services, prizing those that offered seamless experiences. Many businesses that could not adapt nimbly to the new requirements were left behind.
The study also found that the NPS decreased by as many as 30 points for the youngest consumers and 3.2 points for the oldest ones, most likely due to varying levels of expectations.
Measure NPS with Survicate
NPS can truly transform a business, as many of the stats show. Have you tried measuring it in your company?
With Survicate, you can send your NPS survey free of charge, collect unlimited responses, and analyze the findings in a dedicated dashboard.
Ready to get started? Sign up for the 10-day free trial and start leveraging the power of NPS with Survicate.


.webp)

.svg)

.svg)