Every company tracks NPS, but most can't answer the simplest question: is our score actually good? After analyzing thousands of NPS surveys across industries, we've created the benchmarks you've been asking for. Now you can compare your score to companies operating in your industry and see where you stand.
Our NPS survey management system (survey creation, distribution, and analysis all in one tool) is one of Survicate's flagship features. With this rich database at our fingertips, it was time to give back to the NPS community with real, actionable insights.
This report reveals the following data from real NPS surveys run by Survicate customers in 2024 and 2025:
- Median NPS scores by industry
- NPS benchmarks by industry: 25th, 50th, and 75th percentiles
- Year-over-year percentile comparison (10th, 25th, 75th, and 90th percentiles)
- Median NPS scores by business model (B2B vs. B2C)
- Industry-specific breakdown of B2B and B2C median NPS scores
Methodology
Here’s how we selected the data for the report to make sure it’s as comprehensive and objective as possible.
- For the 2025 report, we analyzed data from 599 unique companies that ran 2,187 surveys and collected 5,4 million responses (5,414,263) from January through October 2025
- For 2024, we analyzed data from almost 655 unique companies that ran 2,178 surveys and collected nearly 6,5 million responses (6,466,710) from January through December 2024
- We only included surveys with 100+ responses in a year to minimize the margin of error
- Each industry includes a minimum of 50+ companies to ensure statistical relevance
- All data was anonymized to protect customer privacy
- Our data comes from NPS surveys conducted in different languages
- This iteration includes small, medium, and large companies across all categories
- We report median scores. The median is often more reliable than the average because it's less affected by extreme outliers - a few very high or very low scores won't skew the overall picture.
We plan to update the report periodically with new results.
Key findings
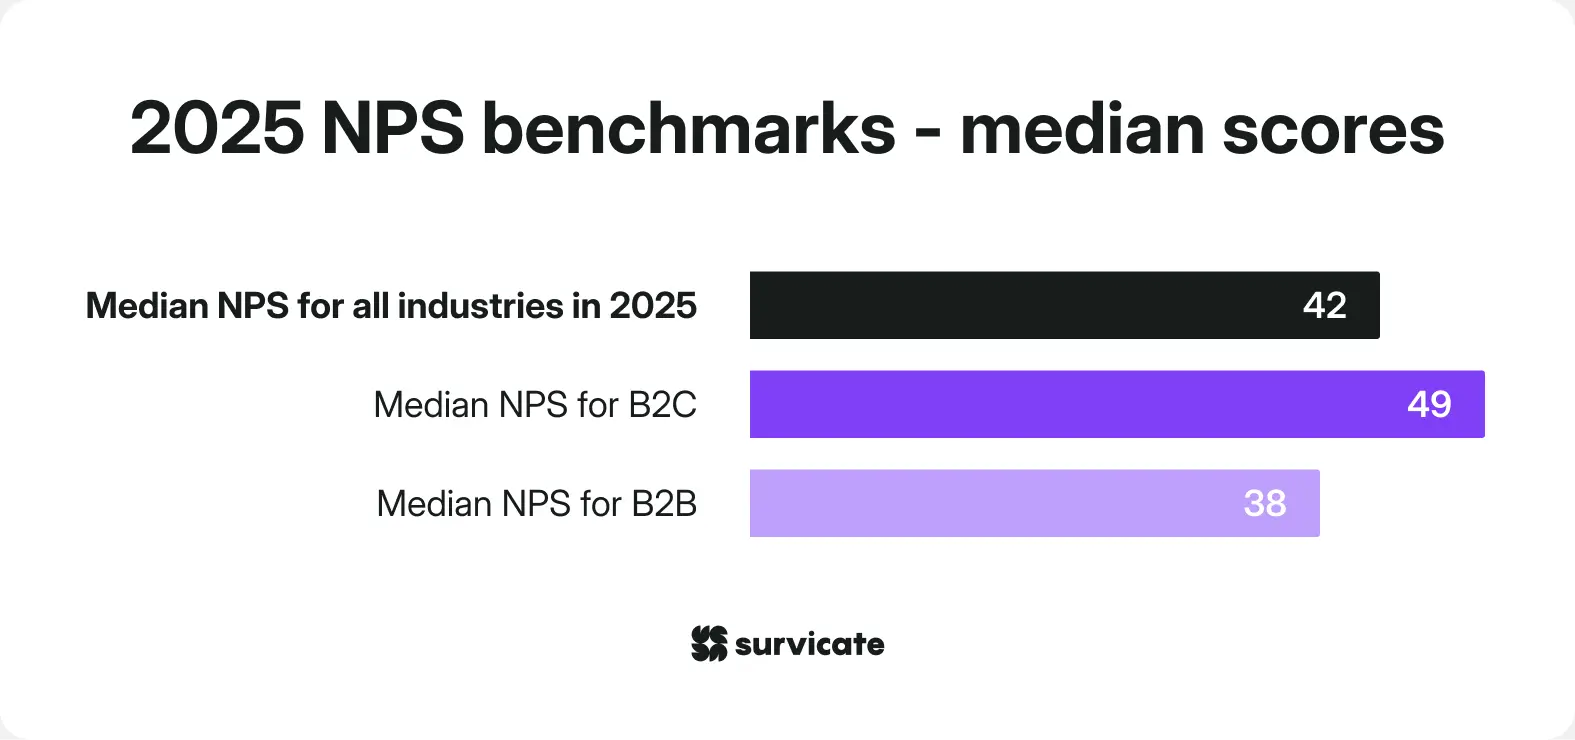
- The median NPS in 2025 is 42
The median 2025 NPS benchmark across all industries we analyzed is 42.
B2C companies in our report outperformed B2B by 11 percentage points (49 vs. 38), showing that consumer-facing businesses maintain stronger customer satisfaction than business-focused companies.
2. Low NPS scores got worse year-over-year
The bottom 10% of companies saw their NPS drop from -0.3 in 2024 to -4 in 2025. This suggests rising customer expectations are making it harder for underperforming companies to recover. The bar for customer satisfaction continues to rise across all industries.
3. Software shows the largest B2B vs. B2C performance gap
While Software has the lowest average NPS overall (30), the disparity between business models is striking. B2C (47) significantly outperforms B2B (29), likely due to several factors.
B2B buyers have different expectations, demanding excellent support, extensive integrations, and complex feature sets that are harder to deliver consistently. The stakes are also higher in B2B contexts, as business software directly impacts operations and revenue, leading to less tolerance for issues.
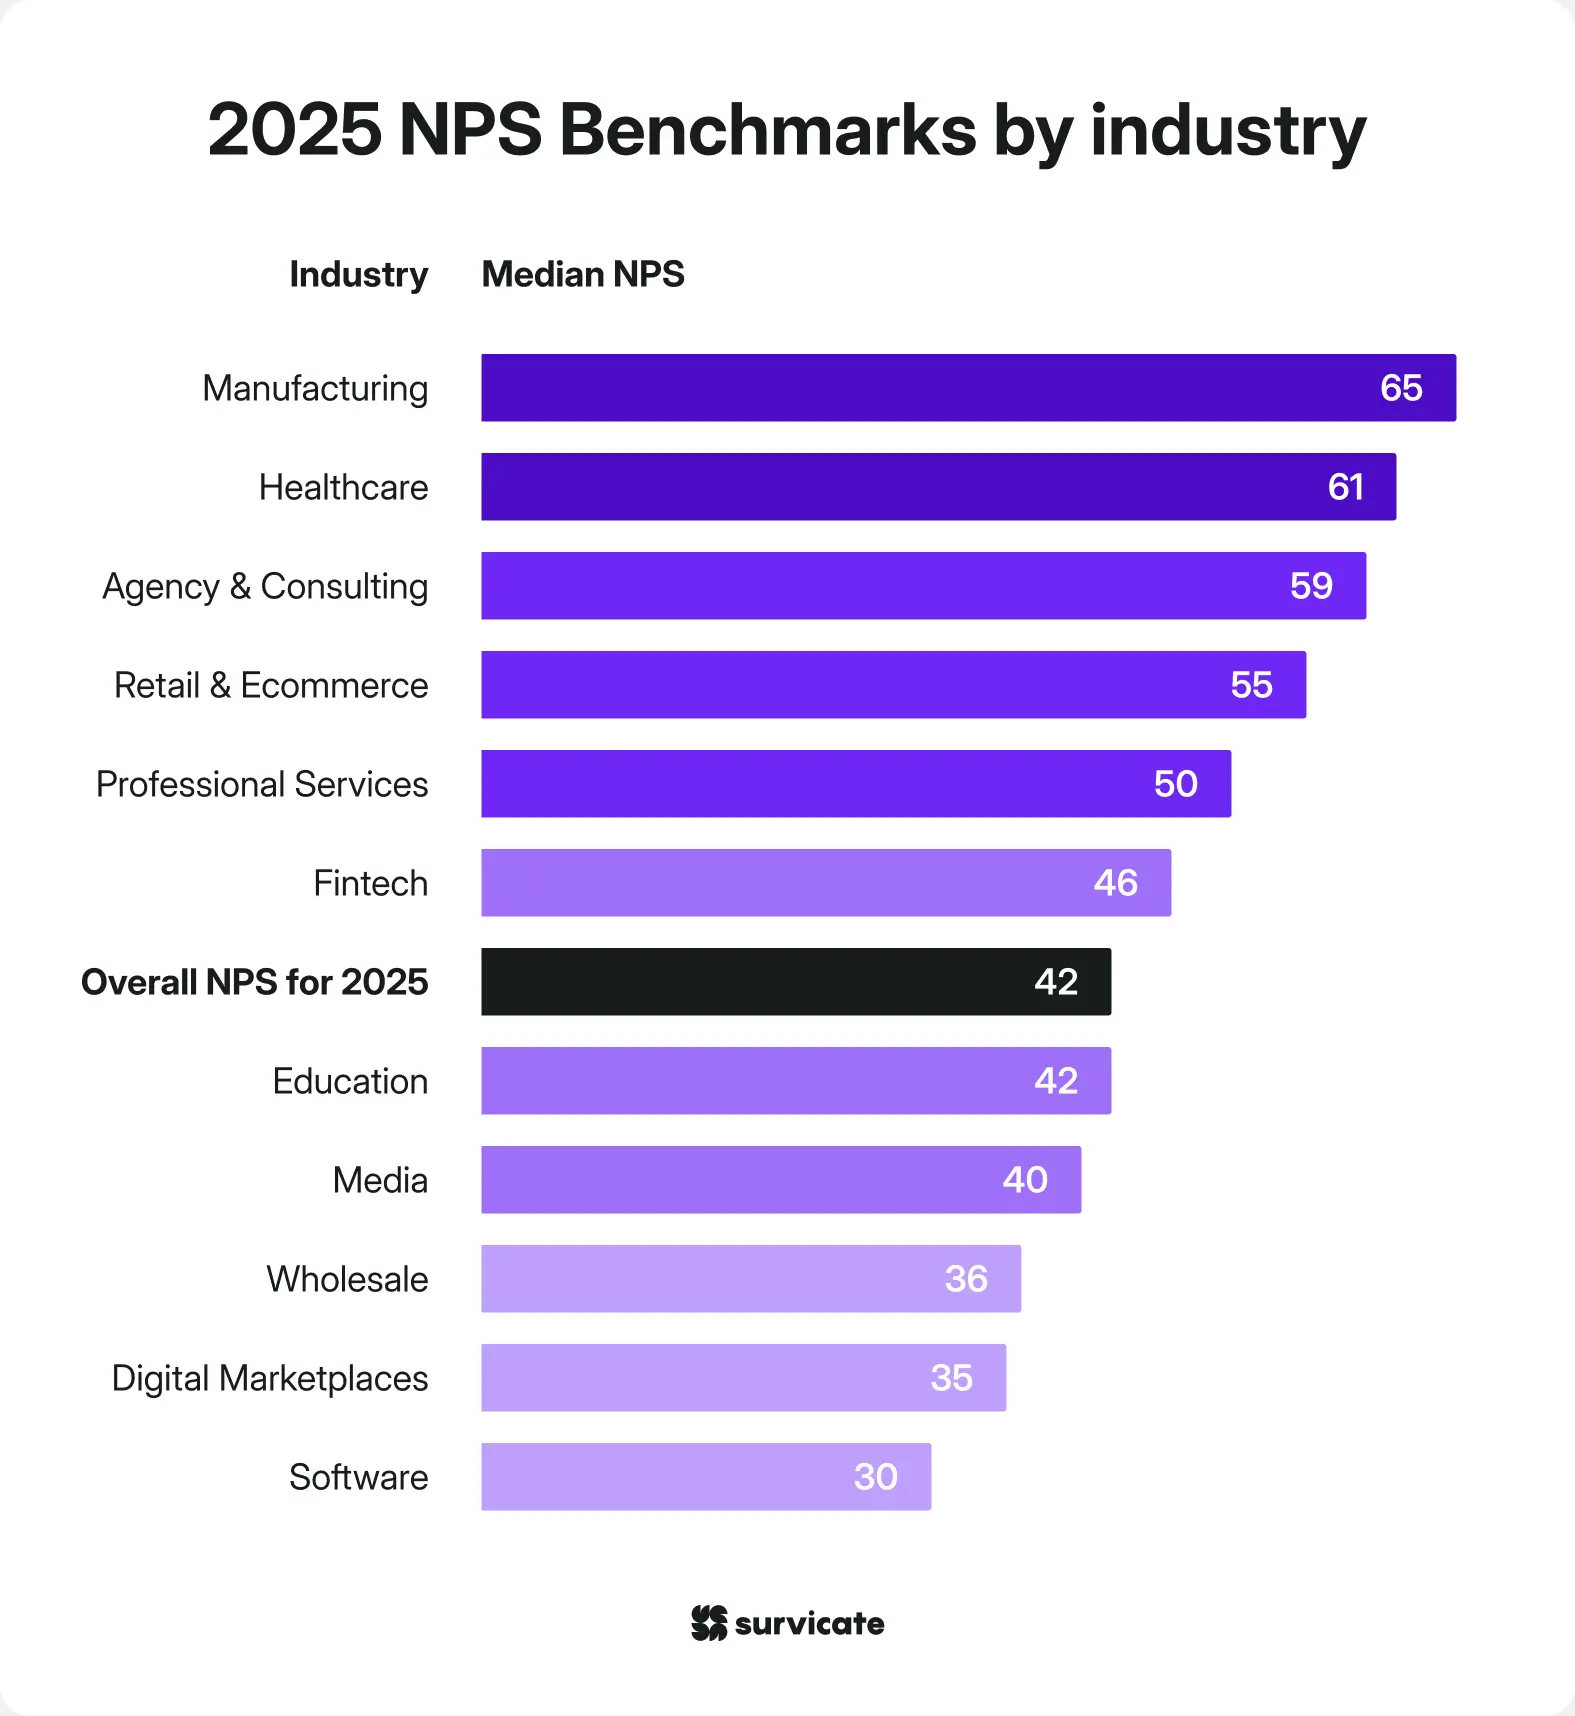
2025 NPS benchmarks by industry
Looking at median scores for 2025, Manufacturing leads with 65, followed by Healthcare at 61 and Agency & Consulting at 59. These median figures suggest consistently positive customer experiences across most respondents in these sectors.
Software sits at the bottom again with a median NPS of 30.
Median NPS 2025: B2B vs. B2C performance by industry
We compared median NPS scores across all 11 industries by business model. The data reveals significant performance variations both between B2B and B2C and across sectors.
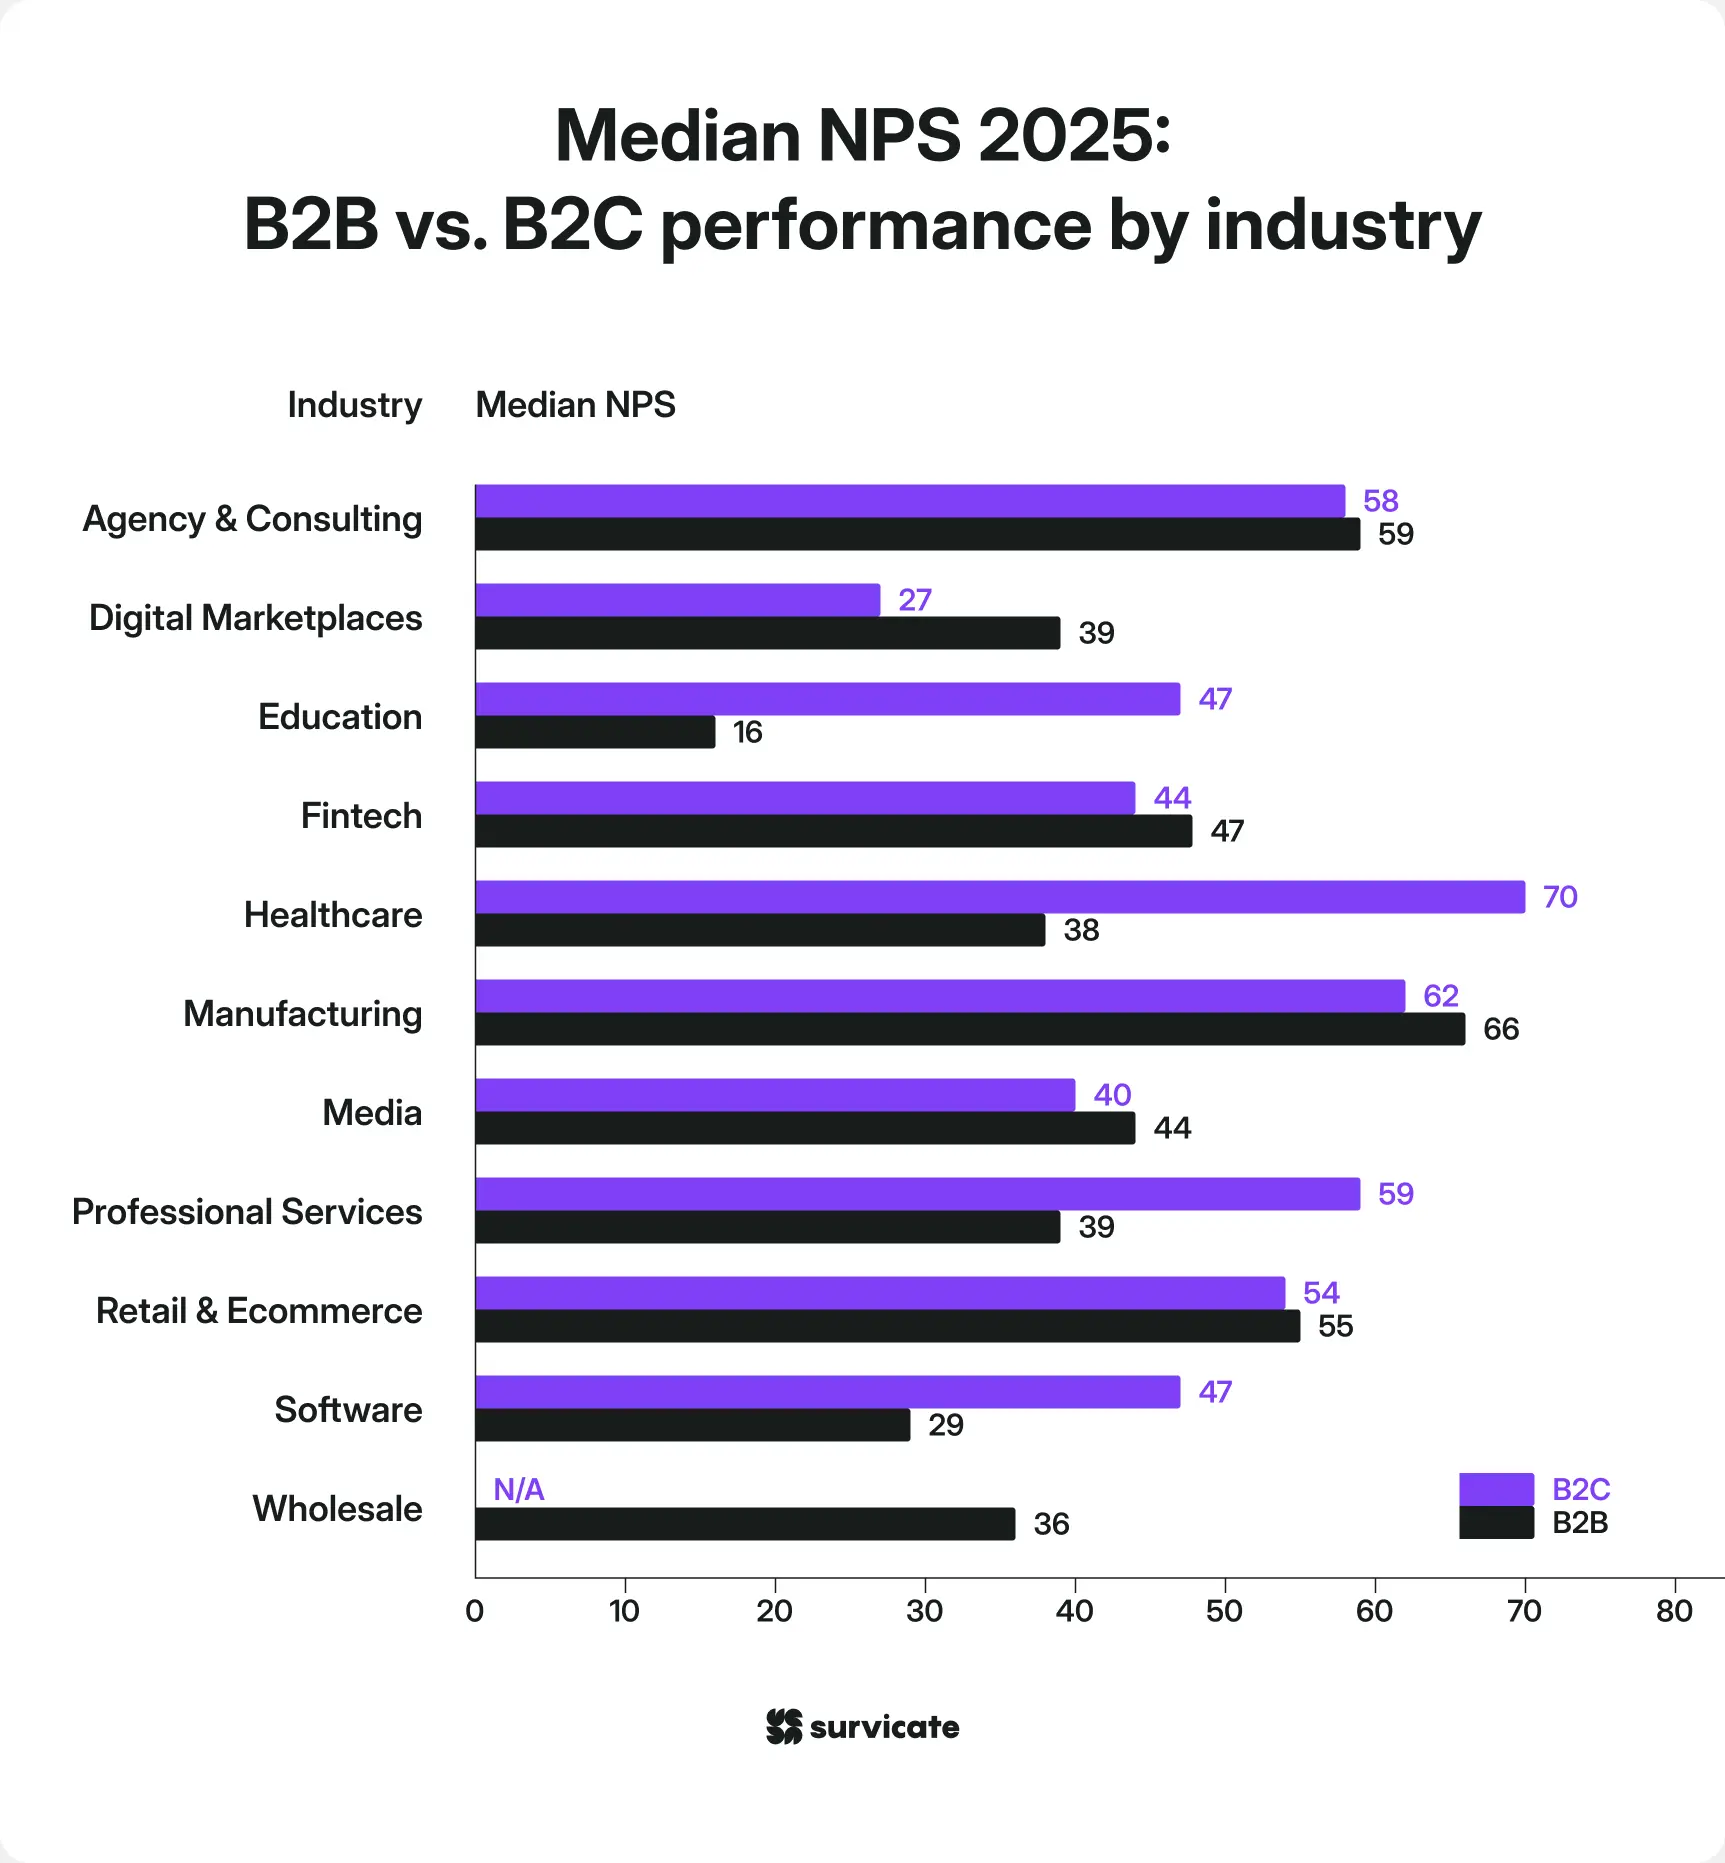
Industries where B2C outperforms B2B
Healthcare shows the largest gap (32 points), with B2C at 70 vs. B2B at 38. When services directly impact personal wellbeing, consumer satisfaction runs significantly higher than in business healthcare contexts.
Software shows a big difference between B2C (47) and B2B (29). That's nearly an 18-point gap in favor of consumer-facing software companies.
The difference could be explained by the fact that consumer apps prioritize simplicity and user experience, while B2B software faces higher expectations for enterprise features, integrations, and support, making satisfaction harder to achieve.
B2C Education (47) dramatically outperforms B2B (16), a 31-point gap. Direct-to-consumer learning (online courses, educational apps) generates much stronger customer loyalty than corporate training or B2B learning solutions, possibly due to personal investment and choice vs. mandatory corporate programs.
Industries where B2B outperforms B2C
In 2025, Manufacturing favors B2B with 66 compared to B2C's 62, though both scores are strong.
Digital Marketplaces show B2B at 39 versus B2C at 27, suggesting business-focused marketplaces deliver better experiences than consumer platforms.
Media slightly favors B2B at 44 versus B2C at 40, indicating relatively close performance between business and consumer media services.
Near-equal performance
Agency & Consulting shows virtually identical performance with B2B at 59 and B2C at 58, suggesting customer satisfaction is equally strong in the industry regardless of whether serving businesses or consumers.
Retail & Ecommerce is nearly tied with B2B at 55 and B2C at 54, indicating consistent customer experiences across both business models.
To sum up, the business model doesn't determine the NPS ceiling, customer expectations do. B2C outperforms when experience, simplicity, and emotional connection matter most. B2B wins when reliability and operational value drive satisfaction. Success comes from understanding and meeting specific audiences' priorities, not from a business model label.
Year-over-year NPS change by industry: 2024 to 2025
Using our data, we analyzed median NPS performance across 11 industries from 2024 to 2025.
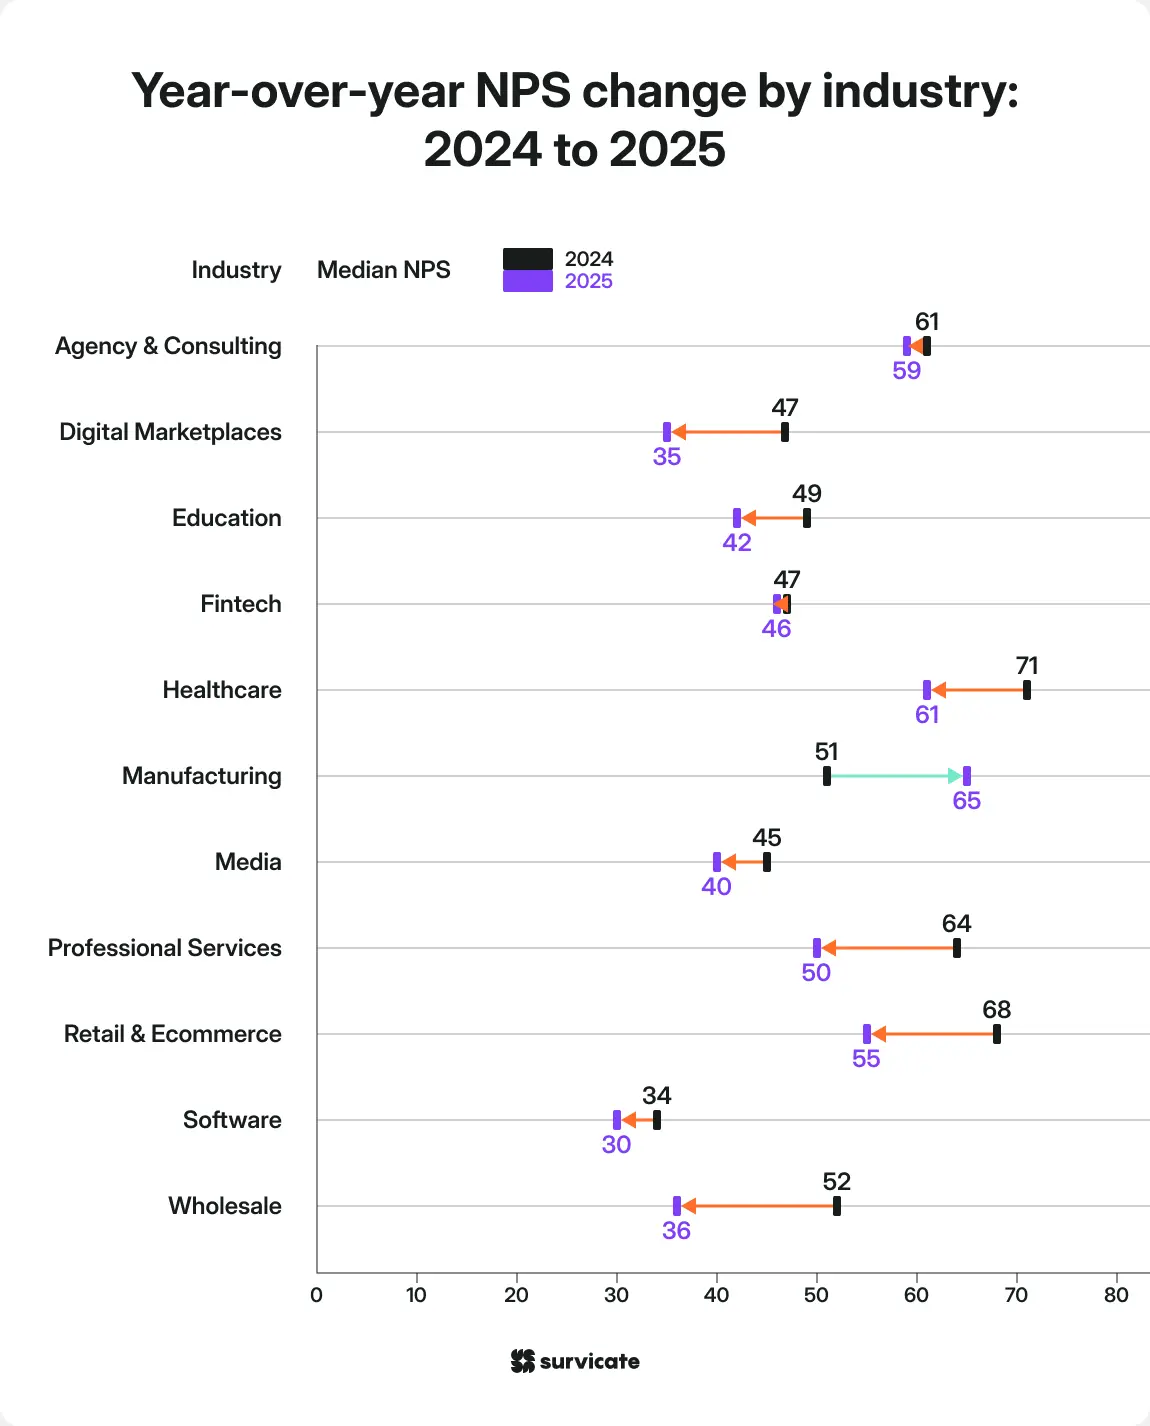
The overall picture is that customer satisfaction is slipping nearly everywhere. The median NPS remained the same at 42, but this masks some dramatic swings at the industry level.
10 out of 11 industries saw NPS decline, and only Manufacturing improved.
Wholesale, Retail & Ecommerce, and Digital Marketplaces all took double-digit hits. These businesses share some common challenges: they handle high transaction volumes where every interaction matters, customers expect speed and convenience as table stakes, and there's always a competitor one click away.
What we found is that having a great NPS in 2024 didn't protect companies from decline this year. Healthcare had the highest score in 2024 at 71, but dropped 10 points. Retail & Ecommerce started at a strong 68 and fell to 55.
This suggests that past success doesn't create immunity. If anything, customers of high performers might have higher expectations, making it harder to maintain those scores when conditions change.
NPS benchmarks by industry: 25th, 50th, and 75th percentiles
The data shows a clear divide: Manufacturing (65), Healthcare (61), and Agency & Consulting (59) lead in customer loyalty, while Software (30), Digital Marketplaces (35), and Wholesale (36) struggle.

We found a huge gap between top and bottom performers within the same industry. Manufacturing companies range from 29 to 75, a 46-point spread, while Digital Marketplaces span 49 points.
This means your execution is more important than your industry. Even bottom performers in generally successful industries score poorly, while top performers in challenging sectors like Software reach 52.
Median NPS performance analysis: B2C vs. B2B
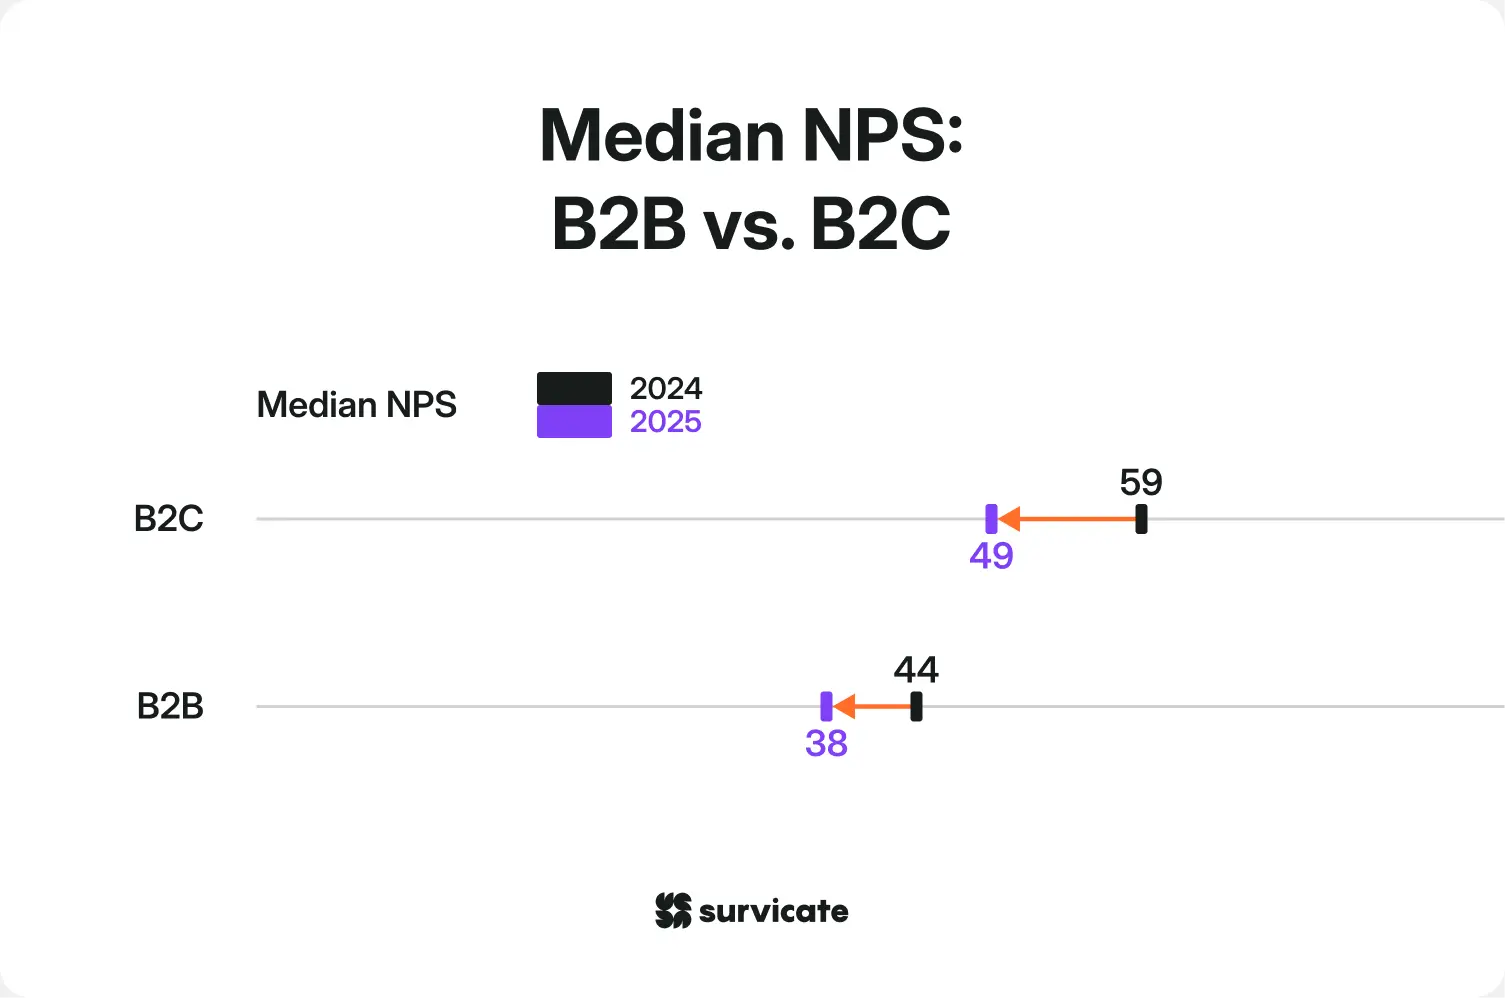
B2C companies experienced a 10-point drop compared to B2B's 6-point decline.
B2C still outperforms B2B in 2025 (49 vs. 38), maintaining a 9-point advantage.
The sharper B2C decline year-on-year suggests consumer expectations rose faster than business buyer expectations, or that consumer-facing companies faced greater operational challenges in meeting 2024-level service standards.
While B2B's absolute performance remains lower, its more modest decline suggests business relationships, longer sales cycles, and established vendor relationships may provide some buffer against satisfaction erosion.
NPS distribution by percentile: 2024 vs. 2025
We analyzed NPS distribution by percentile across both years and noticed a widening performance gap.

We analyzed NPS distribution by percentile across both years and noticed a widening performance gap.
We found that struggling companies fell further behind. The bottom 10% of companies saw their NPS drop from -0.3 in 2024 to -4 in 2025. If they were already dealing with unhappy customers, things got tougher this year.
However, top performers held steady. Companies in the 90th percentile remained at 78. The best companies kept doing what they do best, even as others struggled.
The key insight we see from the data is that the best companies are staying ahead while struggling ones fall further behind. It’s getting more and more difficult to gain customers’ loyalty, and customer experience is becoming an even bigger differentiator.
Industries
Here’s a list of all sectors that appear in the report, along with short descriptions.
We categorized software into Fintech, Digital Marketplaces, and Software, and then placed software services within Agency & Consulting, as we had a strong representation of these in our database and enough companies to conduct a relevant breakdown analysis.
Agency & Consulting
Companies that offer specialized professional services to other businesses, such as marketing, advertising, design, strategy, IT management consulting, or technical implementation services, as well as software houses.
Digital Marketplaces
Online platforms that connect buyers and sellers to facilitate transactions.
Education
Organizations that provide learning services, training programs, educational content, or academic instruction to students, professionals, or businesses.
Fintech
Apps and software products for the financial sector.
Healthcare
Organizations that provide medical services, healthcare products, wellness solutions, or health-related technology to patients or other healthcare providers.
Manufacturing
Companies that produce physical goods, components, or materials through industrial processes for sale to other businesses or consumers.
Media
Companies that create, distribute, or publish content including news, entertainment, streaming services, broadcasting, or digital media platforms.
Professional Services
Businesses that provide specialized expertise and knowledge-based services to clients, such as financial services, insurance, real estate and others.
Retail & Ecommerce
Businesses that sell physical or digital products directly to consumers, either through online stores (ecommerce) or physical locations (retail).
Software
Companies that develop and sell software products, SaaS platforms, consumer apps for b2b and b2c
Wholesale
Companies that purchase goods in bulk from manufacturers and sell them in large quantities to retailers, businesses, or other resellers rather than directly to end consumers.
What is a good Net Promoter Score, then?
When you check out industry benchmarks, one question inevitably comes to mind: what is a good Net Promoter Score?
There’s no definitive answer to this question.
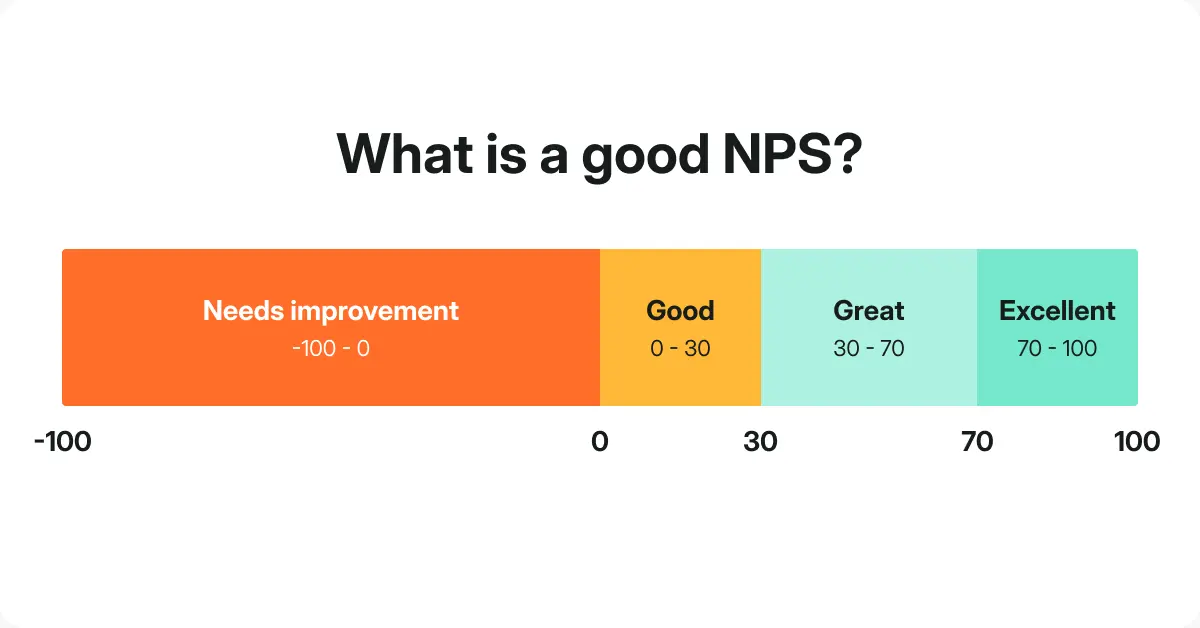
Generally speaking, any NPS above 0 is positive since it indicates you have more fans than haters.
If you have a score of 30 or more, you’re doing well. The number of happy customers exceeds the number of unhappy customers. However, there’s still room for improvement!
If your score exceeds 70, it means you’re among the best. Your customers love you, and you’re generating a lot of positive word-of-mouth. Your customer experience is superb, and it’s your market differentiator.
If you have a high NPS, leverage it:
- Ask satisfied customers for testimonials and feature them in your marketing
- Interview top customers and publish their success stories
- Launch a referral or affiliate program
- Turn your high NPS into a unique selling proposition
Important: Don't settle for any score below 0, even if your industry average is lower. A negative NPS means the majority of your customers are dissatisfied with your services.
You can max out the value of your NPS survey by adding a follow-up question, as in the template below:
The best benchmark? Your own historical performance.
After your first NPS survey, track your score over time. Work on improving customer satisfaction between surveys, then compare new results against previous ones. Consistent improvement means you're on the right track.
Maximize the value of your NPS surveys by including a follow-up question that asks why customers gave their score.
Factors to consider before benchmarking your NPS
Now that you know the NPS industry benchmarks, here's how to use them effectively.
Before benchmarking your NPS, recognize that multiple factors influence scores beyond your direct control:
Competition intensity matters
NPS tends to be lower in industries with fierce competition, where customers have less tolerance for mistakes and more alternatives. Conversely, when switching brands is difficult (due to limited competition or high-stakes purchases), customers rate their current choices higher.
External conditions impact satisfaction
Economic downturns, political instability, pandemics, and environmental crises all affect customer sentiment. Average NPS scores dropped across industries during COVID-19, regardless of individual company performance.
Cultural and regional differences exist
Customer scoring patterns vary by country and region. Some cultures are more conservative with top scores than others. However, don't use this as an excuse. If you're scoring particularly poorly in a specific region, it signals that your customer experience doesn't resonate with that audience and needs attention.
The bottom line: Treat industry benchmarks as reference points, not absolute goals. Context matters when evaluating your performance.
How to create an NPS survey
Now that you know what the NPS landscape looks like for your industry, it's time to run your own survey.
Make sure you follow NPS survey best practices:
- Keep surveys concise and logical
- Respond to and act on customer feedback
- Distribute surveys through your audience's preferred channels
- Include open-ended questions so customers can explain their scores and provide suggestions
- Run surveys regularly to track trends over time
Use customer feedback software for better results
Running NPS surveys with a dedicated platform like Survicate makes the entire process more efficient and sustainable. Customer feedback platforms let you collect feedback across multiple channels, analyze it from all sources, and take action through integrated tools, turning NPS benchmarking into an ongoing process that doesn't require a dedicated research team.
Then, you can monitor your results using an analytics dashboard, without havin to prepare separate reports or calculating your Net Promoter Score manually or with a separate NPS calculator.
Collecting your NPS score is just the beginning. To truly understand the “why” behind your promoters and detractors, and turn that feedback into action, you need a system for analyzing and interpreting those responses. That’s where Survicate’s built-in analytics and research tools come in.
Centralize and categorize feedback with Insights Hub
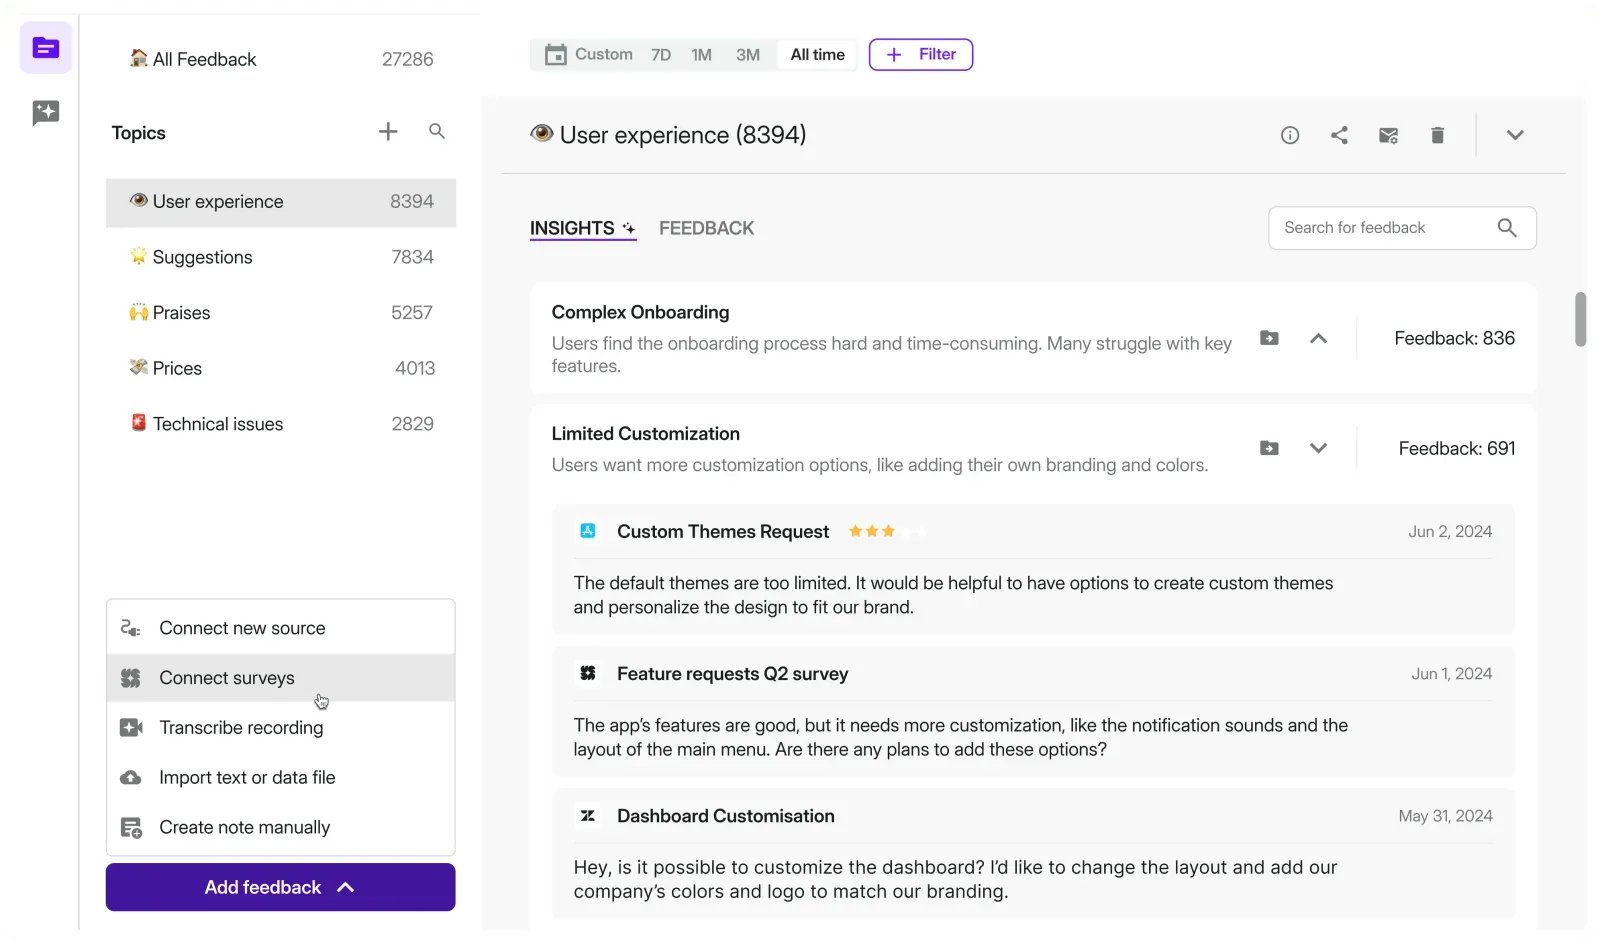
Insights Hub automatically collects and organizes open-ended NPS responses alongside other feedback sources, like support tickets, app store reviews, and survey responses. Using AI, it groups them into relevant topics (e.g., onboarding, pricing, UX bugs), so you can spot trends, uncover blind spots, and validate product assumptions, without spending hours manually tagging feedback.
This is especially useful if you're running NPS surveys across multiple channels or teams. Whether you’re gathering feedback from your website, app, or email campaigns, Insights Hub gives you a full picture of your customer sentiment in one place.
Monitor performance with real-time dashboards
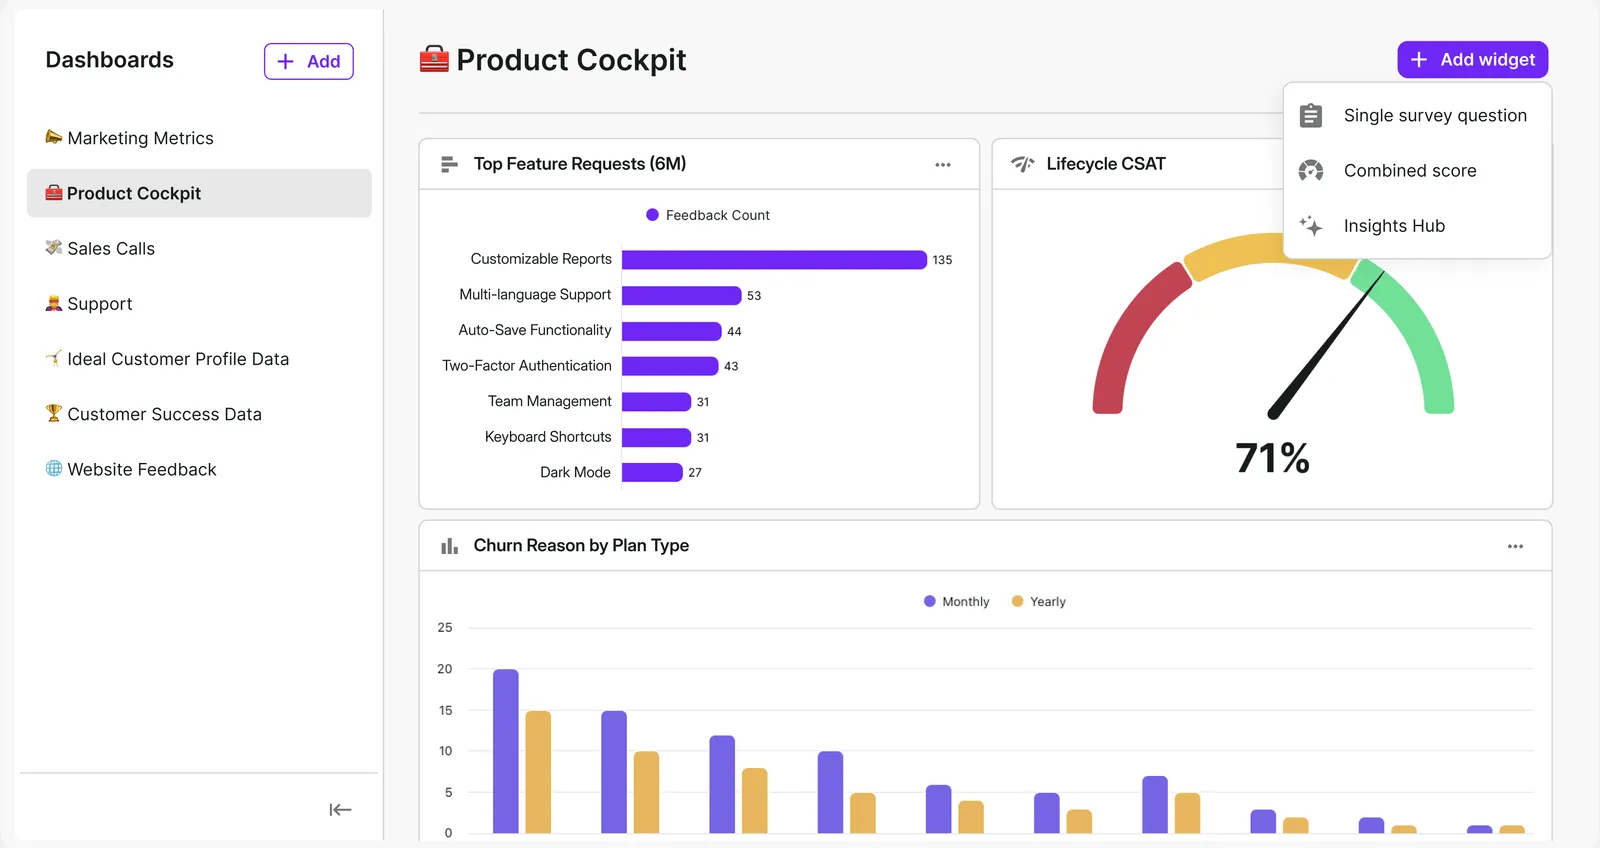
Need a quick snapshot of your latest NPS campaign? Survicate’s dashboards visualize everything in real time, from score trends and response volume to segment-level breakdowns. You can track how your NPS fluctuates over time, compare performance across campaigns, and quickly surface issues that need immediate attention.
Dashboards also help your team stay aligned. Share them with stakeholders or use them to benchmark progress during product sprints, marketing launches, or post-support improvements.
Go deeper with Research Assistant
For deeper analysis, Survicate’s Research Assistant helps you make sense of unstructured, open-text responses.
Just ask a question like “What are the main reasons for low NPS this month?” and you’ll get a clear, AI-generated summary backed by real customer quotes. It’s an easy way to get quick answers, identify actionable insights, or generate ideas for follow-up initiatives.
Support for multilingual NPS surveys
If you're collecting NPS feedback across different markets, Survicate also supports multilingual surveys with automatic translations. That means you can create a single NPS survey, deliver it in your respondent’s preferred language, and still analyze all feedback in a unified, translated dashboard. Insights Hub and Research Assistant work across languages too, helping you spot patterns globally, without losing local nuance.
.webp)
And with a variety of available integrations, like HubSpot or Intercom, you can put your survey data in context, get deeper information on your client base, and, most importantly, act on the customer feedback you've collected.
.webp)
Set up your own NPS benchmarks
Ultimately, your NPS is “good” only when it’s better than your previous one.
After running your first NPS survey, do your best to improve your customer experience, sort out the issues pointed out by your respondents, and make changes according to customer feedback. Then, re-run your survey and see if the NPS score rises.
If you notice significant NPS score improvements (over 5%), you’re on the right track. Continue delighting your customers, minimizing their effort, and re-checking if your score keeps rising. This way, you’ll likely grow your business, increase retention rate, and boost revenue.
If your score is continuously dropping, it’s time for you to act. Run follow-up surveys to figure out which parts of your business perform the worst and try to fix them.
If you’d like to share the findings from the report on social media, feel free to use the assets below: