.webp)


-min.png)


.svg)
.svg)
.svg)

.svg)


.svg)


-min.png)


.svg)

.svg)


.svg)

.svg)


.svg)


.svg)


Wouldn’t it be irritating if your physician said you’re perfectly healthy just because you have a pretty face? I bet it would because if you’re doing regular checkups (by the way, please do so), you expect the doctor to take at least your blood samples.
And even if your app has a uniquely designed interface, a modern look, and all the features in the world, it doesn’t mean it’s doing fine. That’s why you must go beyond surface-level observations and use some diagnostic tools.
That’s when mobile app metrics and KPIs come into play. After reading this article, you will know the difference between mobile app KPIs and mobile app metrics and be able to choose the mobile app KPIs that support your business goals.
What are the mobile app KPIs?
You’ve built an app, but don’t know how to assess its performance? Mobile app KPIs are metrics that will help you measure aspects such as user acquisition, engagement, and growth rate, among others.
By analyzing the right KPIs, you’ll be able to assess if your app is on track to meet your business goals as well as learn what improvements you need to make if you fall short.
The selection of mobile app KPIs isn't a one-size-fits-all deal. It depends on your organization’s goals, industry, and specific business objectives. Before establishing how to set KPIs, you first need to clarify the outcomes you expect from your strategy.
Running a survey could be a great way to gather user feedback that will inform your strategy.
Why are mobile app KPIs important?
Selecting KPIs aligned with your business goals makes it easy for you to ensure you’re going in the right direction. Let’s take a look at some of the benefits you can expect.
Providing strategic insights
Use mobile app metrics aligned with business goals to gain insights into user behavior, helping you understand what’s effective and what needs adjustment.
Supporting data-driven decisions
Mobile app KPIs guide your strategic decision-making, allowing you to allocate resources effectively and prioritize improvements.
Tracking user satisfaction
Monitoring your mobile app performance KPIs is a valuable source of user insights, aiding in enhancing retention and loyalty.
Growing revenue
More and more CMOs and marketing leaders set revenue targets as their primary objective because well-optimized KPIs impact revenue streams generated by the mobile app.

The difference between mobile app KPIs and mobile app metrics
Mobile app KPIs and mobile app metrics are closely related concepts. While they are often used interchangeably in various sources, each serves a unique role and purpose.
Mobile app metrics provide specific information about various aspects of app performance, user behavior, and technical attributes.
These metrics can include information about app download counts, average session duration, or crash rates.
To simplify, mobile app metrics are unprocessed data points that paint a picture of how an app is doing and how users engage with it. They don’t provide a comprehensive picture but are instead a granular view of an app’s performance.
Mobile app KPIs, on the other hand, are a subset of metrics that are most critical to your app’s success. They are directly related to your organization’s overall goals and objectives and are continuously monitored to make sure you achieve the goals.
If your product strategy lacks a clear goal, it’s good to take a step back, determine your app goals, and create a successful mobile app strategy incorporating the right mobile app KPIs.
Most popular mobile app KPIs
Now, let's look at mobile app KPIs and the specific business goals they measure. But here's a golden rule - don't rush to implement all of them at once. Stick with the ones that will impact your business goals directly. After all, there's no sense in boosting metrics that won't bring you any real benefits, right?
Mobile app KPIs to measure acquisition
One of the core objectives of any mobile app is to acquire new quality users who can be converted into paying customers. Let’s take a look at the mobile app KPIs that can help you track this goal.
Customer Acquisition Cost (CAC)
Customer Acquisition Cost, or CAC, is a crucial mobile app KPI. It evaluates the profitability of your marketing and acquisition efforts.
A climbing CAC means you might be over-investing to obtain each user.
The CAC formula is very straightforward: take the total cost you invested in acquiring new users in a specific time period and divide it by the number of new users you’ve got.
CAC = Total Cost of Acquisition / Number of New Users Acquired
But here’s the catch: acquiring customers is not just about saving money. It’s also about attracting users who stick around and become loyal and engaged customers.
So, how do you reduce your CAC and get more high-quality customers? Start by rethinking your target audience and make sure your messaging and acquisition channels are adjusted accordingly. You want users who aren’t just passing through but are here to stay, isn’t that right?
Moreover, try to make the most out of your organic channels. Trim down your spending on paid ads and campaigns, and put your efforts into creating benefit-driven SEO content that resonates with your audience.
Lifetime Value (LTV)
To shed light on the long-term financial value of your app’s users, track their Lifetime Value. It’s the overall revenue users generate throughout their use of your app. This is a critical app KPI to optimize your acquisition strategy and monetization efforts.
For a broader perspective, compare your CAC and LTV. When the Lifetime Value exceeds the Customer Acquisition Cost, you’re nailing it! This means your acquisition tactics are attracting engaged and profitable users.
To calculate LTV, estimate the average revenue generated by a user throughout their entire app journey:
LTV = Average Revenue Per User (ARPU) x Average Customer Lifespan
To boost the LTV, you must dive into strategies like enhancing user engagement, promoting in-app purchases, upselling premium features, and reducing churn rates.
Cost Per Acquisition (CPA)
CPA (Cost Per Acquisition) provides a detailed breakdown of the expenses associated with acquiring individual users through specific channels.
To calculate CPA, simply divide the total cost of acquiring new users by the number of new users obtained:
CPA = Total Cost of Acquisition / Number of New Users Acquired
While both CPA and CAC are key performance indicators in the mobile app world, they have unique roles, and you should know the difference.
CPA hones in on the precise cost of particular actions, whereas CAC provides a more comprehensive perspective on the overall expenses tied to user acquisition for your business.
Return on Investment (ROI)
Essentially, ROI is the measure of profit in relation to the expenses incurred during app development, maintenance, and marketing efforts.
ROI is calculated by subtracting the initial investment cost from the total revenue it generated. The ROI formula is:
ROI = (Net Gains or Returns - Initial Investment Cost) / Initial Investment Cost
A positive ROI is a great sign. It means that your app not only returns what you invested but also generates more income. ROI is a versatile KPI that you can use for different campaigns or channels.
Tracking changes in ROI will help you pinpoint the strategies that generate the best returns, so you can ensure your resources are wisely invested.
User Growth Rate
Diving into User Growth Rate is a further step of mobile app performance optimization. By keeping a close watch over this KPI, your product and marketing teams can gain invaluable insights into the app's growth journey.
User Growth Rate can be calculated by subtracting the total number of users from this month from the total number of users from the previous month, and then dividing the result by the total from the previous month:
((Present User Amount – Past User Amount) / (Past User Amount)) X 100
User Growth Rate as a mobile app KPI that evaluates the efficacy of user acquisition strategies and ascertains the market’s appetite for your mobile app.
Beyond just a growing number of users, this KPI gives you an overview of trends in user retention. Pay attention to boosting engagement and killing churn to maximize the mobile app's success.
This granular analysis shows you the potential of strategies across different markets, so you can identify the best ways to grow.
App Install Rate / App Store Conversion Rate
This KPI helps you measure the number of times your app was installed, making it essential to gauge the effectiveness of your acquisition efforts.
Regularly measuring and tracking App Store Conversion Rates can serve as a valuable checkpoint. You can use it to assess your promotional materials and messaging, ensuring an alignment with the product-market fit.
The formula for App Install Rate is:
App Install Rate = (Number of App Installs / Total Number of Users Exposed to the App) x 100
Additionally, consider running product-market fit surveys to ensure that your product aligns with the needs of your users.
Done that already? Maybe it’s time to revamp your messaging or visuals to resonate with your audience better.
App Store Ranking
Algorithms used by app stores determine this mobile app metric based on various factors, such as app reviews, ratings, download metrics, frequency of updates, user engagement, and the relevance of keywords in descriptions and titles.
A high ranking guarantees visibility, but crafting an app product page that resonates with your target audience is also important. Make sure to deliver all essential information to convert more visitors into customers. To increase your App Store Ranking, you can choose one of the strategies to increase your App Ratings.
Monitoring and refining your App Store Ranking is not mere vanity; it's a strategic move to increase your app's visibility and discoverability, and, subsequently, your customer acquisition potential.
.png)
Looking for ways to get more positive reviews in the App Store? Run NPS surveys and set a custom thank you screen for all Promoters. Offer them an incentive and ask them to leave positive feedback online. Then, watch your ratings and ranking improve.
Mobile app KPIs to measure conversion
If your goal is to have more users or paid customers, pay close attention to these KPIs.
Daily Active Users (DAU) / Monthly Active Users (MAU)
DAU and MAU are crucial mobile app KPIs for all mobile app development and marketing teams. Whether you're a developer, product manager, designer or marketer, measuring mobile app performance will be challenging without tracking Daily or Monthly Active users.
DAU quantifies the number of unique users actively interacting with your app on any given day, while MAU encapsulates those who engage at least once during a specific calendar month.
To calculate these metrics, use the following formulas:
DAU = [Unique new users] + [unique returning users]
MAU= [Number of unique new users in a month] + [Number of Unique Returning Users in a Month]
If your MAU and DAU KPIs are consistently high, this indicates healthy user retention, suggesting that users perceive significant value in your app and keep using it.
For a deeper understanding of your product's stickiness or the likelihood of returning, you can measure the DAU/MAU ratio. This gives you a comparative perspective on daily and monthly user engagement. This is crucial if you aim to build sticky products and consistently increase your revenue by converting and keeping more customers.
Conversion Rate
Conversion refers to a specific action or goal you want your users to take in-app, whether it’s in-app purchases, upgrading to a higher plan or taking a particular activity. To get a clear picture of the results, you can track conversion rates. These are the percentages of users who complete that specific action.
Here’s how you calculate it:
CR = (Number of Conversions / Total Number of Users) x 100
The higher the conversion rates, the better you are at guiding users toward valuable interactions.
What if your conversion rates are low? This may signal usability issues or friction points across customer experience. You can use session recording tools or survey software to detect what stops your users from converting.
You can also ask your users what stops them from purchasing or evaluate if your product meets their needs to optimize the user funnel and identify the real reason behind the drop-offs with this survey:
Retention Rate
This KPI helps you measure the percentage of users who continue to use your app over a specific period. Tracking how many people stick with your product can let you estimate the long-term success of your mobile app.
To calculate the retention rate, use this formula:
Retention Rate = (Number of Returning Customers / Total Number of New Users) x 100
A high retention rate signifies that your app is successfully meeting user needs and providing a positive user experience, while a declining rate should be treated as a warning signal, suggesting issues that require your attention.
Churn Rate
You should not underestimate churn rate as a mobile app KPI when your goal is to convert and keep more paid customers. The churn rate is the number of users who stop using your app or cancel a subscription over a specific time frame.
Churn Rate = (Lost Customers ÷ Total Customers at the Start of Time Period) x 100
A low churn rate means that you are converting users to see real value in your app. Therefore, they are loyal and satisfied with your product.
If you identify the opposite, meaning many of your customers are unsatisfied or think they don’t need your app anymore, you might want to work on improving the churn rate.
First, you’ll need to identify the reason behind this to decrease your churn rate.
Whether it’s an unsatisfactory user experience, inefficient pricing strategy or missing features, you can use feedback surveys such as the one below to track why customers are leaving your service or product.
Average Revenue Per User (ARPU)
ARPU is another mobile app KPI supporting you to convert and keep more customers. This metric quantifies the average revenue generated by each user of your app.
Here’s the ARPU formula:
ARPU = MRR / active paying users
To elevate Average Revenue Per User, you should focus on evaluating your pricing strategy and efficient upsell efforts. Learn how your pricing works with this in-app pricing template.

Mobile app KPIs to measure app performance
When it comes to measuring app performance, there are KPIs you can use to have a holistic view of your apps’ success. Here are some common KPIs you can consider implementing.
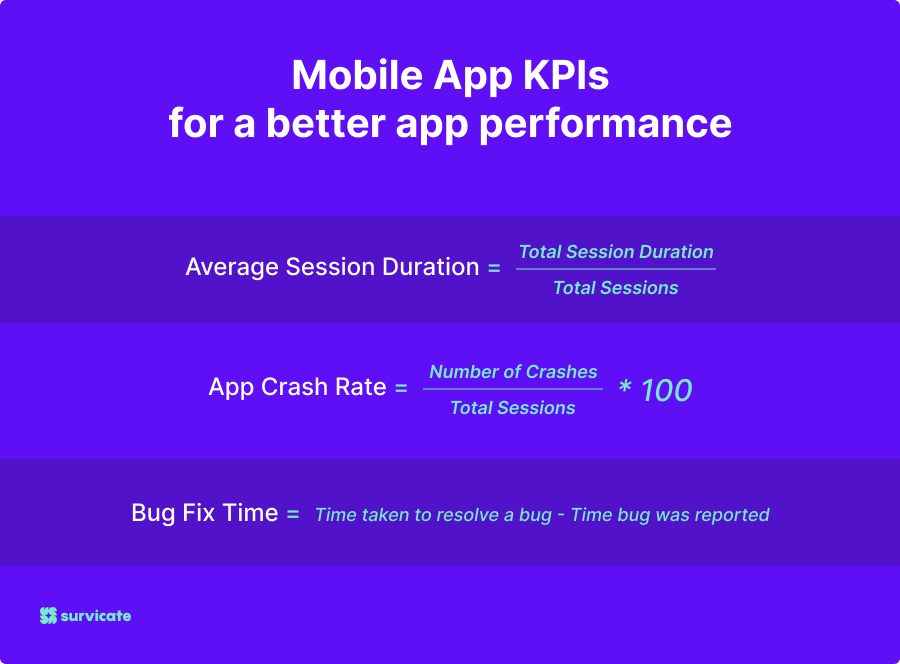
Average Session Duration
By measuring the average time users spend in each app session, this KPI provides insights into user engagement.
Here’s how to calculate it:
Average Session Duration = (Total Session Duration / Total Sessions)
To extend the Average Session duration and improve your user engagement, you’ll need to create interactive and engaging experiences within your app.
Make sure your app brings real value to the users. Get to know your persona, their challenges and needs so you can prioritize the features and improvements that matter.
Feedback surveys can play a pivotal role here. Try asking users what their expectations are and what they appreciate the most. Collecting customer feedback continuously is a great way to detect if they are encountering difficulties using your app effectively.
App Load Time
App Load Time measures the time it takes for the app to launch and become usable after a user initiates it.
In a modern, fast-paced world, you must deliver value immediately and frictionlessly. If your app takes a long time to load and work properly, there’s a chance your users will uninstall it and look for an alternative.
To improve the App Load Time, you can review and minimize unnecessary app permissions, reduce server response times, and optimize your app's code, among other measures.
App Crash Rate
This KPI tracks the percentage of app sessions that result in a crash or error.
App Crash Rate = (Number of Crashes / Total Sessions) x 100
To identify the significance of crash rates for your users, you can launch in-product event-triggered surveys or send email surveys after support tickets are closed. Try to learn more about the crash circumstances and help your development team proactively address stability issues.
Bug Fix Time
Bug Fix Time measures how quickly the development team resolves reported bugs or issues.
Bug Fix Time = (Time taken to resolve a bug - Time bug was reported)
To reduce Bug Fix Time, establish a streamlined bug reporting and tracking system. You should also assign clear responsibilities within your development team for bug resolution and maintain transparent communication with users by providing updates on bug fixes in progress.
Measure your app performance with Survicate
Developing a mobile app in 2024 isn’t easy. Prioritizing the roadmap, improving user engagement, and ensuring high-quality app performance are valid challenges.
What makes it even more challenging is not knowing whether the changes you implement are moving you closer to your goals.
To validate your progress, consider introducing in-app surveys. Alongside tracking KPIs, it’s another way to ensure you’re identifying pain points and removing all roadblocks along the user journey.
A good survey tool such as Survicate will allow you to set recurring or event-triggered surveys and ensure your user experience is spot-on.
Ready to start? Sign up for our 10-day free trial to get access to all Business plan features today!


.svg)

.svg)