TL;DR
- 67% of CES surveys ask about ease. Only 7% ask about clarity.
- Ease questions score higher (78.3 vs. 66.0), which inflates CES industry benchmarks.
- 57% of companies never check if customers understood the experience or found what they needed.
- Only 5 out of 151 companies in our dataset use CES for support, its original purpose.
A published “average CES” might look better than the experience actually is.
The reason for this, in my opinion, is that companies overwhelmingly use it to ask whether something was easy to do in a digital product, but rarely whether customers understood an in-app process or task. That distinction matters – measuring ease alone may overlook a significant part of the customer experience.
To understand how companies use CES today and what that means for industry benchmarks, at Survicate, we analyzed 389 English-speaking CES surveys from 151 companies. The findings raise questions about what published averages actually tell us about customer effort, and what they might be missing.
If a CES survey is already in place, changing the question can be a simple first step towards a more complete picture. It won't fix the process behind a poor score, but it can help identify which process needs attention.
For a closer look at the fundamentals, see our guide to Customer Effort Score.
Underused: 57% of companies never ask if customers understood the experience
Of the 151 companies in our dataset, 86 (57%) never asked a CES question about clarity or findability. They asked whether something was easy, but never checked if customers could find what they needed or understand the information they received.
Which CES questions companies actually ask
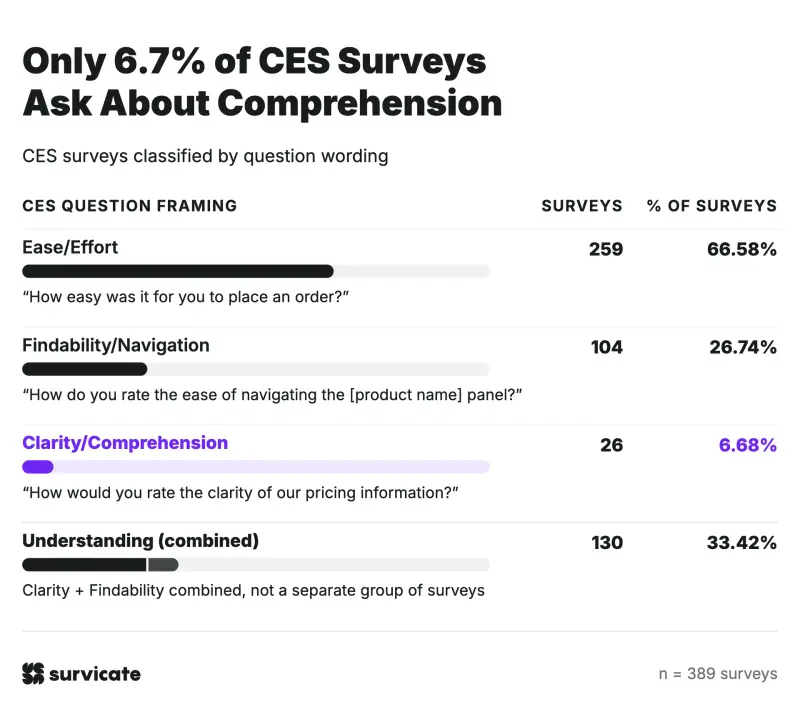
We classified 389 CES surveys by question wording. Two-thirds focused on ease or effort. Just 6.7% asked specifically about clarity or comprehension.
| CES Question Framing | Surveys | % of Surveys | Real CES Survey Examples |
|---|---|---|---|
| Ease/Effort | 259 | 66.58% | “How easy was it for you to place an order?” |
| Findability/Navigation | 104 | 26.74% | “How do you rate the ease of navigating the [product name] panel?” |
| Clarity/Comprehension | 26 | 6.68% | “How would you rate the clarity of our pricing information?” |
| Understanding (combined) | 130 | 33.42% | Clarity + Findability |
Note: Understanding combines Findability/Navigation and Clarity/Comprehension. It is not a separate group of surveys.
Looking at companies rather than surveys gives us a similar picture.
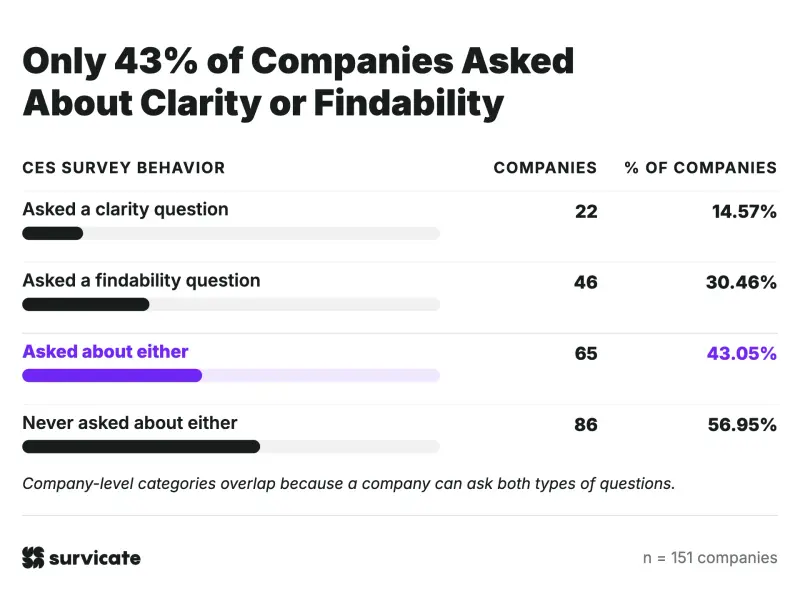
Only 65 companies (43%) asked about clarity or findability at least once. The other 86 (57%) never asked about either.
| Company CES Survey Behavior | Companies | % of companies |
|---|---|---|
| Asked a clarity question | 22 | 14.57% |
| Asked a findability question | 46 | 30.46% |
| Asked about either | 65 | 43.05% |
| Never asked about either | 86 | 56.95% |
Note: Company-level categories overlap because a company can ask both types of questions.
A good CES score can mean you’ve missed the problem

We ran into this recently. A customer upgraded their plan in one click. They thought it would be billed monthly, but it was annual. If we had asked how easy the upgrade was, I think we would have gotten a good score, because it was one click. The customer completed the task quickly and still misunderstood the terms.
A question about whether the changes to their plan and invoice were clear could have surfaced that misunderstanding. If the customer hadn't contacted us, we might never have known. In the worst-case scenario, the confusion could eventually have led to churn.
That is why I think the question in a CES survey needs to reflect what the team actually wants to learn. Ease tells you how much effort a task took. Clarity can tell you whether the customer understood the information they needed to make a decision. Both are useful, but a good score on one doesn't tell you much about the other.
I also think there is a balance to strike with the questions themselves. If answering takes no thought at all, people might give you a quick rating without recalling the details of their experience. Sometimes, asking a question that makes people stop and think a little is useful.
There's an article I've had bookmarked for a while, by Tarik Covington, that splits friction into two kinds. Destructive friction is unnecessary stuff, like a confusing or leading question. Constructive friction is a question that makes people stop and think, like recalling their experience instead of just giving a score. If you make a question too easy to answer, you don't get detailed answers.
Know what happens to the feedback once you collect it
Gathering responses can be straightforward if a survey is already in place. Doing something about the answer can take more work. In the plan upgrade story, we might have needed to change the upgrade process itself, rather than just rewrite the copy.
I also think that CES is useful alongside CSAT here, because they tell you different things that could suggest what steps to take next. CES measures the effort involved in completing a task, while CSAT tells you how satisfied someone was with the experience. A negative CES score can be a good starting point for a conversation about what made the task difficult and what needs to change.
Ask what you're actually wondering.
If I suspect people are confused by a workflow, I would ask about clarity. If I want to know how difficult it was to get something done, I would ask about ease. And if I want to know whether people found a support chat option, I would ask whether they found it. That is a different problem from understanding what happens during a purchase or an upgrade.
I would start with what I want to learn and what I plan to do with the answer. If there is no next step, I don't see much point in asking the question in the first place.
Self-flattering by default: the industry CES number has a built-in cushion
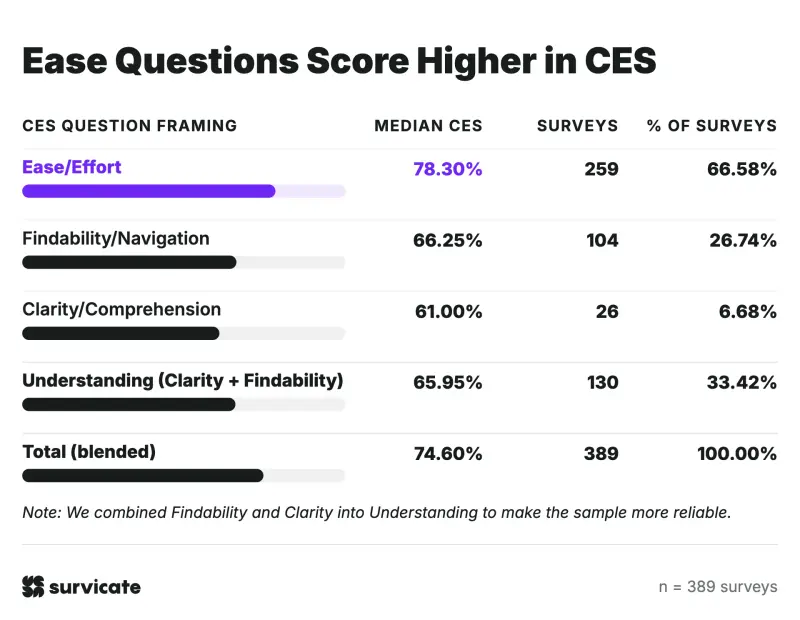
Most companies use the same survey templates, and they ask how easy something was, which scores higher. I checked ours, and it does, too. Templates set the norm, so the industry number looks better than the experience is.
Ease questions score higher, partly because the wording leads respondents
| CES Question Framing | Surveys | % of Surveys | CES Median | CES P25 | CES P75 |
|---|---|---|---|---|---|
| Ease/Effort | 259 | 66.58% | 78.30% | 64.00% | 86.80% |
| Findability/Navigation | 104 | 26.74% | 66.25% | 37.80% | 78.35% |
| Clarity/Comprehension | 26 | 6.68% | 61.00% | 47.10% | 84.45% |
| Understanding (Clarity + Findability) | 130 | 33.42% | 65.95% | 38.02% | 79.40% |
| Total (blended) | 389 | 100.00% | 74.60% | 58.20% | 85.70% |
Note: We combined Findability and Clarity into Understanding to make the sample more reliable.
Ease-framed questions have a median CES of 78.3, compared with 66.0 for questions about understanding. I think there are a couple of reasons for this gap.
First, the wording can lead people toward a positive answer. If you ask whether a product made something easy, people tend to agree rather than disagree. That's a form of acquiescence bias. A question about how easy or difficult something was makes people think a little more about the experience instead of simply agreeing with a statement.
There is also a memory effect. Once someone has completed a task successfully, the sense of achievement can stay with them longer than the effort it took to get there. Unless something went particularly badly, they may remember the outcome as easy.
Equal weighting lowers the median by 6.1 points
The blended median is 74.6, close to the Ease/Effort median of 78.3. That makes sense because Ease/Effort accounts for 66.6% of surveys and has the highest median. If each question framing carried equal weight, the median would be 68.5, a difference of 6.1 points.
I would treat that gap as a reason to question the benchmark, not as a target score to correct for. In fact, I always tell our clients at Survicate to take global benchmarks with a grain of salt. The question wording is one factor, but country, language, audience, and the point in the customer journey when a survey appears can also affect the results.
It's tempting to compare results with another brand that's similar to ours. But I'd first ask – did they run with the exact same question? Did they survey the same audience and measure the same moment in the customer journey? Comparing customers in the US with customers in Japan, for example, can miss important differences in how people respond to surveys.
Benchmarks can still give you a sense of how other companies perform, but I wouldn't rely on one number to judge the quality of a customer experience. I would focus on improving your own results quarter over quarter or year over year. That tells you more about whether customers are having a better experience.
Companies that never test understanding score higher
| Company CES Group | Companies | % of Companies | Median Company CES |
|---|---|---|---|
| Never tests understanding | 86 | 56.95% | 80.00% |
| Tests understanding at least once | 65 | 43.05% | 70.50% |
| All companies | 151 | 100.00% | 77.30% |
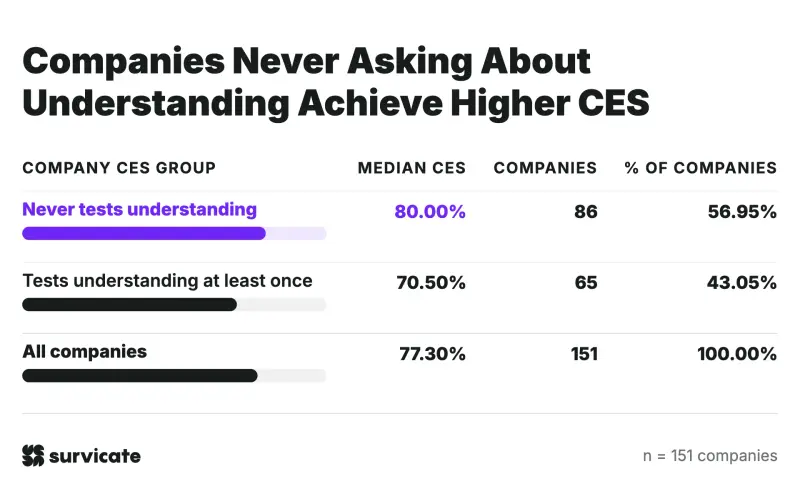
Companies that never ask about clarity or findability have a median score of 80.0, compared with 70.5 for companies that test understanding at least once.
I think this fits with what we see in the question-level data. Ease questions tend to produce higher scores, while questions about understanding can make customers think more carefully about their experience. The lower score doesn't necessarily mean these companies provide a worse experience. Their questions may simply reveal problems that other companies don't measure.
A lower score than another company's doesn't have to mean you're doing worse. Your question may just be finding more friction. Look at the feedback first and see what people struggled with.
A higher score shouldn't be your main goal
While it’s technically possible, I haven't personally seen a team improve its CES score simply by changing the question. If all you care about is getting a higher number, there are easy (albeit questionable) ways to do it. You could ask only customers who successfully completed a task, or change the wording to encourage more positive answers.
The problem is that the score can improve while the feedback becomes less useful. If customers who couldn't complete a task never receive the survey, the team misses the very people who may have experienced the most friction. And if a team drops a clarity question because it brings down the average, the trend line may look better without the experience getting any better.
I would be careful about interpreting a rising CES score without checking if the survey has changed. If something had changed in the audience or how and where we run the survey, the results may no longer be comparable.
For me, the point of CES is to understand where customers struggle and what we can improve. A lower score with specific, actionable feedback can be more valuable than a higher score that tells us very little. If the goal is to improve the product, we need to be willing to hear what isn't working.
Drifted: only 5 of 151 companies ask CES the way it was designed
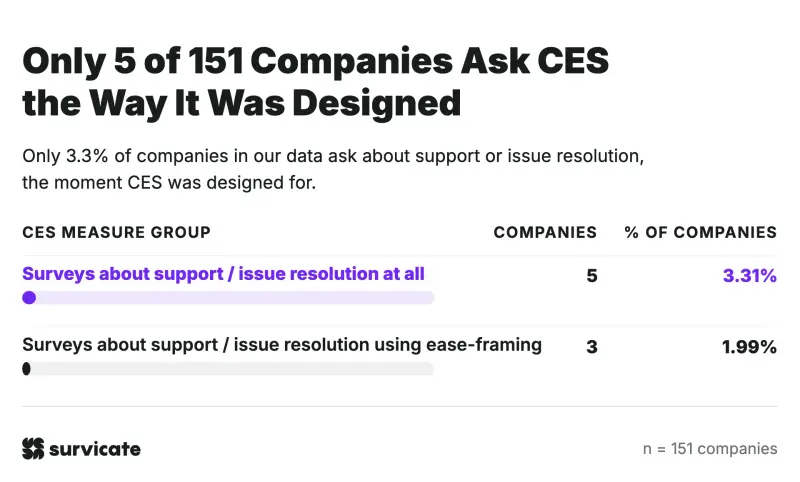
Only 3.3% of companies in our data ask about support or issue resolution, the moment CES was designed for.
| CES Measure Group | Company Count | % of Companies |
|---|---|---|
| Surveys about support / issue resolution at all | 5 | 3.31% of 151 |
| Surveys about support / issue resolution using ease-framing | 3 | 1.99% of 151 |
Customer Effort Score started with CEB and Gartner in The Effortless Experience. It was built for one job – measuring how much friction a customer faced resolving a problem through support. That narrow moment mattered because it gave you a score you could tie directly back to a team that actually owned the workflow and could fix it.
Over time, effort turned into "easy" or "ease", and support moved into the product, so CES now gets asked about onboarding, adoption and getting started.
Where CES goes instead
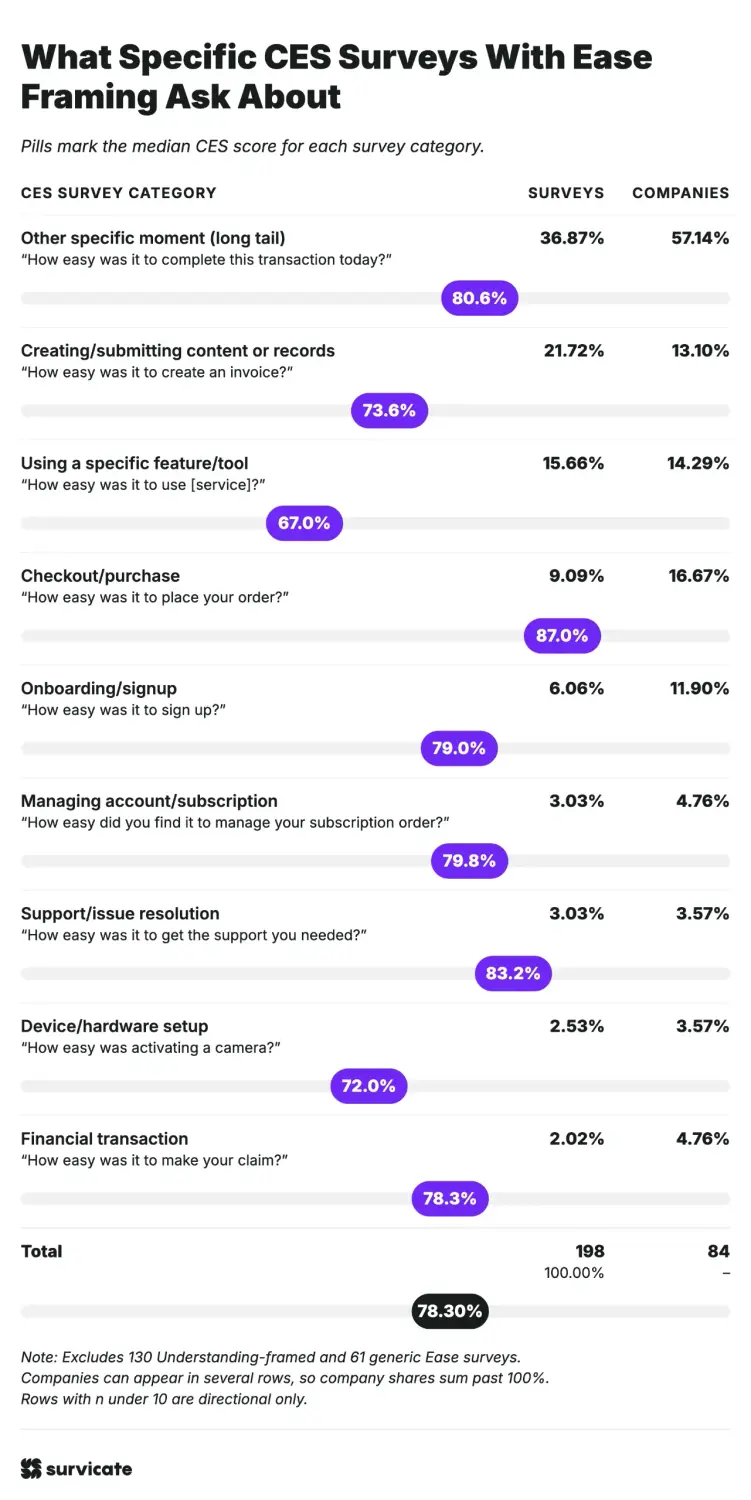
| CES Survey Category | Surveys | % of surveys | Companies | % of Companies | CES Median | CES P25 | CES P75 | Real CES Survey Example |
|---|---|---|---|---|---|---|---|---|
| Other specific moment (long tail) | 73 | 36.87% | 48 | 57.14% | 80.6% | 70.6% | 86.1% | “How easy was it to complete this transaction today?” |
| Creating/submitting content or records | 43 | 21.72% | 11 | 13.10% | 73.6% | 57.9% | 80.4% | “How easy was it to create an invoice?” |
| Using a specific feature/tool | 31 | 15.66% | 12 | 14.29% | 67.0% | 59.7% | 81.2% | “How easy was it to use [service]?” |
| Checkout/purchase | 18 | 9.09% | 14 | 16.67% | 87.0% | 82.9% | 91.6% | “How easy was it to place your order?” |
| Onboarding/signup | 12 | 6.06% | 10 | 11.90% | 79.0% | 70.6% | 93.9% | “How easy was it to sign up?” |
| Managing account/subscription | 6 | 3.03% | 4 | 4.76% | 79.8% | 51.0% | 84.9% | “How easy did you find it to manage your subscription order?” |
| Support/issue resolution | 6 | 3.03% | 3 | 3.57% | 83.2% | 76.8% | 87.8% | “How easy was it to get the support you needed?” |
| Device/hardware setup | 5 | 2.53% | 3 | 3.57% | 72.0% | 70.0% | 81.4% | “How easy was activating a camera?” |
| Financial transaction | 4 | 2.02% | 4 | 4.76% | 78.3% | 70.0% | 86.6% | “How easy was it to make your claim?” |
| Total | 198 | 100.00% | 84 | – | 78.30% | 64.40% | 85.9% |
Note: Excludes 130 Understanding-framed and 61 generic Ease surveys. Companies can appear in several rows, so company shares sum past 100%. Rows with n under 10 are directional only.
Most of the specific questions in the long tail ask about one-off tasks and content creation. The sample size for support is just 8 surveys, which is too small for score claims – so we have to argue from rarity. Of those eight, six are Ease-framed and two are Findability-framed ("find the Customer Service page").
If you are picking a metric for a very one-off case, like how easy it was to read a piece of content, CES is actually the right tool. Customer effort is universal. If you have to choose between NPS, CSAT, or CES for a standalone action, I'd go with CES, because effort applies to almost any task and the other two don't stretch that far. The catch is that "how easy was it" is easy to turn into a leading question.

Compare that to Customer Satisfaction. If you ask whether someone is satisfied with putting water into a glass and they say no, asking why they are unsatisfied is much more complex. It is not as direct as asking about where the friction actually lies.
A 20-point spread hiding inside one metric
Checkout scores highest at 87.0 across 18 surveys and 14 companies, while everyday feature use sits at the bottom at 67.0. I'd guess checkout scores highest because teams watch conversions closely and have already removed most of the friction. Day-to-day use gets measured less, and it has the lowest score in our data.
Two different companies can both report a Customer Effort Score of 75 while measuring moments that sit 20 points apart.
I'd name what you measure, like Checkout CES or Support CES. It's the same data, but you know what each number is about before you compare it with anyone else's. It won't fix small samples, like our 8 support surveys, and it only works if the question and audience match, too.
Why support took a backseat to product in CES surveys
Originally, CES was meant for measuring support and then it extended into how easy it is to do ‘X’. That shift is likely related to how software and products changed. The support side of products generally moved into the product itself. Right now, teams talk more about in-app onboarding, guides, and help centers.
Because of that, more companies evaluate ease of doing or ease of achieving things in customer experience areas like adoption and onboarding instead of just a support interaction inside the product. Effort became more of a product growth metric.
Another reason is that effort is universal and easy to stretch. You can measure the effort of doing something for anything. That flexibility makes CES easy to use for multiple purposes and use cases, smoothing the transition from support to other areas.
At the same time, feedback literacy plays a role. A lot of teams simply copy the format without necessarily knowing what it was built for. They see a question like "how easy is it to do X" and realize ‘X’ can be literally anything because ease is such a universal concept. Teams can copy-paste it to any area they want to measure: how easy was it to complete a purchase, to get started, to read this article, to find what you're looking for.
Should you stick to ease and effort, or shift to clarity?
I think ease and effort should stay in the mix. It is a quick question, simple to answer, and it gives you an immediate jumping-off point to continue the conversation. Clarity questions might yield more actionable feedback, but you risk getting a lot less volume overall. Plus, some moments just do not fit. Asking how clear a support conversation was sounds odd.
Our data shows that CES is used overwhelmingly to measure ease of use and effort. That leaves a gap – companies may know how much effort customers put into completing a task, but not whether they understood the process, their options, or what happens next.
Ease and clarity measure different things, so the question should reflect what you want to learn. If customers struggle to complete a workflow, ask how easy it was. If they need to understand a purchase, compare plans, or navigate an upgrade, ask how clear the experience was. And if you want to know whether someone found the support chat, ask directly. That’s a question of discoverability, not clarity.
The bigger risk is treating CES as a score to benchmark rather than an opportunity to learn. An easy-to-answer question may generate more responses, but volume alone doesn't tell you whether you're asking the right thing. Nor does a high score necessarily mean customers understood the experience. When companies focus on chasing higher, easier-to-achieve CES scores, they risk losing sight of the metric's value as a tool for continuous learning. In the process, CES may have lost too much of its own friction.
Before choosing your question, decide what you want to find out and what you'll do with the answer. CES is most valuable when it helps you identify what to improve, not just measure how easy an experience felt.
How to write CES questions that find friction
If you want wording you can paste into a survey today, you have to build for the exact moment you are measuring.
- Use the standard statement ("[Company] made it easy for me to…", 1–5 agree scale) when you need comparability.
- If you suspect people get confused somewhere in the journey, add a clarity question there, like "Was it clear what changes on your plan and invoice from now on?" Skip it for yes/no moments, like finding the support chat.
- Ask about one named moment; let the survey name match the moment.
- Keep a fixed question set when trending CES over time.
CES questions and wording by touchpoint
1. Support & issue resolution
When you are measuring support workflows, keep it tied to the exact interaction.
- Customer Effort Score question wording: "The support team made it easy for me to resolve my issue."
- Customer Effort Score question example: "How easy was it to get the support you needed?"
- CES survey example: "How easy was it to find the customer service page today?"
2. Onboarding & account setup
For signups and initial configuration, focus on getting set up without friction.
- Customer Effort Score question wording: "Setting up my account was effortless."
- Customer Effort Score question example: "How easy was it to sign up?"
- CES survey example: "How easy was it to activate your workspace today?"
3. Purchase & checkout
When transactions happen, measure the transactional path directly.
- Customer Effort Score question wording: "The checkout process made it easy for me to complete my order."
- Customer Effort Score question example: "How easy was it to place your order?"
- CES survey example: "How easy was it to complete this transaction today?"
You can start from our CES survey template or our Customer Effort Score software if you don't want to build the survey from scratch.
Methodology
- We analyzed Survicate's CES benchmark dataset from 2024-2025. Of 644 surveys, 422 were in English. We excluded 33 that didn't meet the CES definition, leaving 389 surveys from 151 companies.
- We used the survey as the unit of analysis, with one CES rating question per survey. Where a finding refers to companies rather than surveys, we report company-level figures separately.
- One company contributed 29 surveys, so survey-level and company-level percentages can differ across certain benchmarks in this report.
- We analyzed question wording in English-language surveys only, as the language represents the vast majority of the dataset. We did not run separate classification analyses on the 222 non-English surveys.
- We included questions that measured the ease or effort involved in completing a specific task, interaction, process, or finding information. This covered wording related to ease, difficulty, effort, friction, and clarity or understandability (when directly related to processing or using information). We excluded questions measuring other concepts, including NPS, CSAT, usefulness, helpfulness, effectiveness, value, perceived importance, future purchase intent, and respondents' own knowledge or state.
We classified questions into three categories:
- Ease/Effort: Questions using terms such as easy, hard, difficult, effort, friction, or smooth, without a more specific clarity or findability focus.
- Findability/Navigation: Questions about finding, locating, searching for, or navigating to something.
- Clarity/Comprehension: Questions assessing the clarity or understandability of information provided by a company, rather than respondents' self-reported understanding.
Note: Clarity/Comprehension accounts for only 26 surveys, with a wide score distribution (P25: 47.1; P75: 84.4). We combined it with Findability/Navigation into a broader “Understanding” category for score comparisons.
- We retained seven questions phrased as "How satisfied are you with the ease of X" as CES. Although they used satisfaction-related wording, they measured ease rather than overall satisfaction with a product or experience.
- We report medians and the 25th and 75th percentiles (P25 and P75) instead of averages to reduce the influence of extreme values.
- Support/issue resolution accounts for only eight surveys, while several other categories contain just four to six surveys. These sample sizes are too small for reliable score comparisons, so we focus on how frequently companies measure these experiences rather than comparing their scores.
FAQs
What's a good Customer Effort Score?
A good Customer Effort Score depends on what you are measuring, because scores differ a lot between touchpoints. In our CES benchmarks data, checkout has the highest median (87.0) and everyday features use the lowest (67.0), a 20-point gap. Instead of chasing a single universal benchmark, compare your scores against the exact same workflow or moment over time.
How is Customer Effort Score measured?
Customer Effort Score is measured by asking customers to rate a specific statement or question on a numbered scale – traditionally a 1 to 5 scale ranging from "strongly disagree" to "strongly agree," or sometimes a 1 to 7 scale or 0 to 10 scale.
To calculate the CES score, take the sum of all individual response scores, divide by the total number of respondents, and normalize the result onto a 0 to 100 scale (or report the average score directly on the survey scale).
What does the CES score measure?
Customer Effort Score measures the amount of friction or effort a customer has to exert to complete a specific interaction, task, or problem resolution with a company. The metric was originally conceived to measure customer support resolution, focusing on how easily customers could resolve a problem through support. That's why the original framing focused on effort, rather than simply asking whether something was easy.
Today, CES is used much more broadly across the customer journey. Teams ask about the ease of completing a purchase, navigating a product, finding information, or using a specific feature.
Survicate's analysis of 389 CES surveys from 151 companies shows just how far this shift has gone. Only 5 companies in the dataset asked about the effort involved in resolving a problem through support. Instead, most surveys focused on the ease of completing a specific task or interaction. CES has become a general-purpose way to measure friction across customer experiences, rather than a metric focused primarily on support resolution.
Is neutral wording really necessary?
It matters less than having a plan for the feedback. Ease questions are a bit leading and score higher, so don't compare scores across different wordings. But whether you ask about clarity, ease or effort, you need to know what happens to the feedback once you collect it. If you suspect people are confused by a workflow, ask about clarity. If you are tracking a transactional task, ask about ease. Pick the phrasing that matches what you want to fix, provided you know the next step.
Why should I use a CES survey?
You should use a Customer Effort Score survey because effort is universal and provides an immediate starting point for a constructive conversation. If a customer gives a negative answer, asking what made the interaction difficult pinpoints the exact friction in a workflow much more directly than a general satisfaction question.
How is CES different from CSAT and NPS?
Customer Effort Score measures specific friction during a discrete task or interaction, whereas CSAT measures general satisfaction with a product, service, or interaction, and NPS measures overall brand loyalty and long-term customer advocacy.
What are some examples of CES survey questions for customer service?
Here are a couple of examples of CES survey questions for customer service:
"How easy was it to get the support you needed?"
"How easy was it to find the customer service page today?"
Key takeaways
- Match the CES question to the goal: ease for effort, clarity for decisions.
- Name each CES score by its moment, such as Checkout CES.
- Decide who acts on low scores before you launch the survey.
- Survey everyone who tried the task, not just those who finished.
- Measure CES to discover friction, not to collect high scores.