


Your CSAT score might be acceptable, but what if your survey setup is actually holding you back from achieving higher numbers?
Most CSAT benchmark guides give you a single industry average score and leave you to guess how your numbers stack up. This report works differently. We go beyond pure industry information and go deeper into both who run the surveys and what optimal CSAT surveys look like.
We analyzed first-party data from over a thousand CSAT surveys run by hundreds of companies on Survicate in 2025. You won't find third-party regurgitations or surface-level stats here.
Inside, you will get exact medians and the full middle 50% range for CSAT scores, response rates, and completion rates. We break down the data across every major performance factor:
- Industry & business model
- Company headcount & size
- Survey visual format & scale design
- Question count & survey length
With these benchmarks, you can compare your results against real market standards and optimize your CSAT surveys to capture higher-quality customer insights.
Methodology
This report includes data from 1,259 CSAT surveys, collected throughout 2025 from 370 companies using Survicate's paid plans. Here's how we built the dataset and calculated the benchmarks:
- A survey needed at least 30 responses to be included in the dataset. This threshold helped us reduce the influence of very small samples on the final benchmarks.
- We report category-level results only when a category contains data from 30 or more unique surveys.
- Industry benchmarks in this report appear only for industries represented by at least 8 unique companies.
- To calculate the response rate, we divided the total number of responses by the total number of survey views. So, our formula was: total # of satisfied customers / total # of responses *100.
- Page/shareable link surveys don't appear in the response rate analysis. Since they can be distributed through channels such as email or social media, there's no reliable way to measure how many people viewed them. Their audience is also self-selecting, which would naturally lead to higher response rates than other survey formats.
- The CSAT score represents the percentage of respondents who gave a satisfied rating (read our comprehensive CSAT guide to learn more).
- Not every survey in the dataset uses the same rating scale. Because of that, we didn't rely on a single definition of a "satisfied" response. Instead, we mapped satisfaction to the scale used in each survey. We followed the same logic as that inside the Survicate platform.
- To make sure the dataset included only CSAT surveys, we used AI to review the wording of every rating question. We observed that many users went with a CSAT survey template but chose to run a non-CSAT question. We included surveys asking respondents to rate their satisfaction or overall experience, while surveys measuring concepts such as NPS, CES, usefulness, or value were excluded. We then manually reviewed the results to correct false positives and false negatives.
- Median CSAT scores and completion rates are rounded to one decimal place for easier interpretation.
- We also checked how the benchmarks changed after raising the minimum response threshold. Increasing it from 30 to 100 responses reduced the dataset from 1,259 surveys across 370 companies to 763 surveys across 247 companies, while the median CSAT score changed only from 80.0% to 77.5% and the median completion rate from 78.9% to 76.9%. Since the differences remained small, the rest of the report uses the 30-response threshold.
Key findings
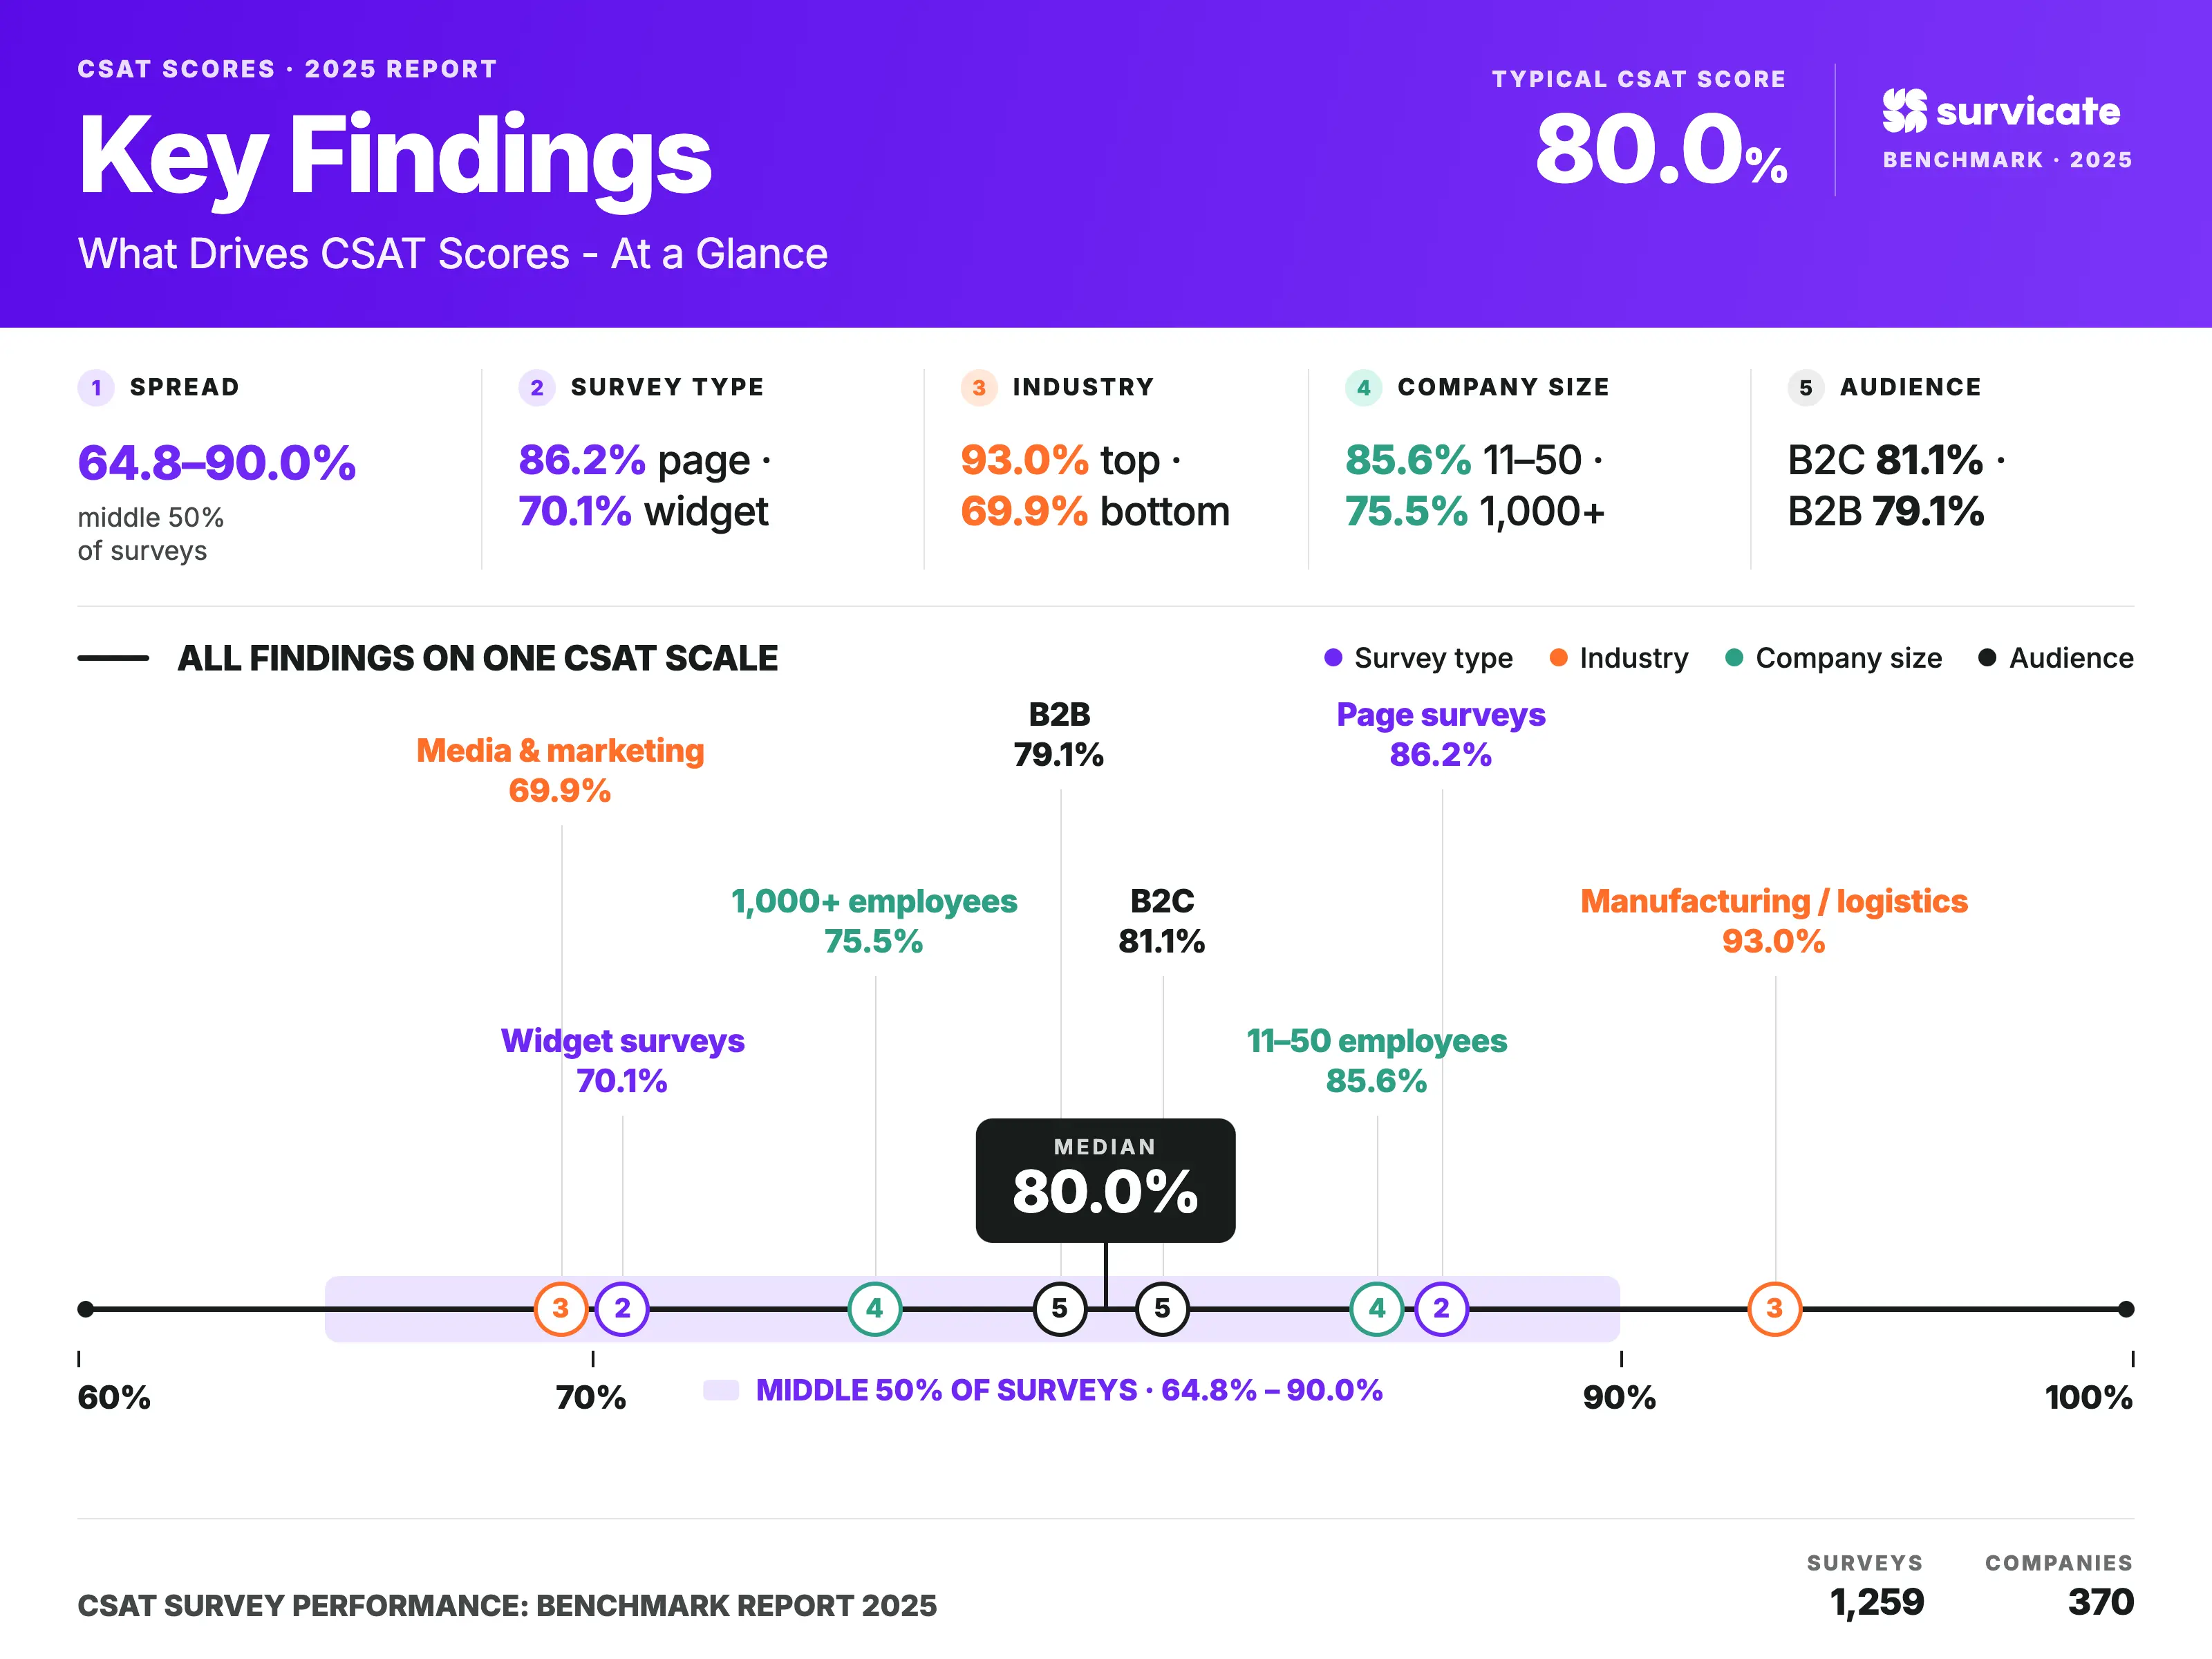
- The median CSAT score is 80.0%. Half of the surveys in our dataset scored between 64.8% and 90.0%, making 80% a useful benchmark for comparing your own results.
- Most companies use a 5-point CSAT scale. It appears in 80.6% of surveys, while 69.2% use visual rating scales such as stars, hearts, and thumbs instead of numbers or words.
- Completion rates stay remarkably consistent. The median completion rate reaches 78.9%, with the middle 50% of surveys ranging from 66.0% to 89.1%. Response rates, by comparison, vary much more across the dataset.
- Survey format has one of the strongest relationships with performance. Page surveys record the highest median CSAT (86.2%) and completion rate (85.3%), while mobile surveys achieve the highest median response rate (20.2%) among comparable survey formats.
- Industry benchmarks differ much more than business model benchmarks. Manufacturing and logistics records the highest median CSAT (93.0%), while media and marketing posts the lowest (69.9%). By contrast, the gap between B2B and B2C is just 2 percentage points, making the business model one of the smallest sources of variation in the dataset.
- Company size also shows a relationship with CSAT. Companies with 11-50 employees achieve the highest median score (85.6%), while enterprises with 1,000+ employees record the lowest (75.5%) and the widest spread of results.
What is a good CSAT score?
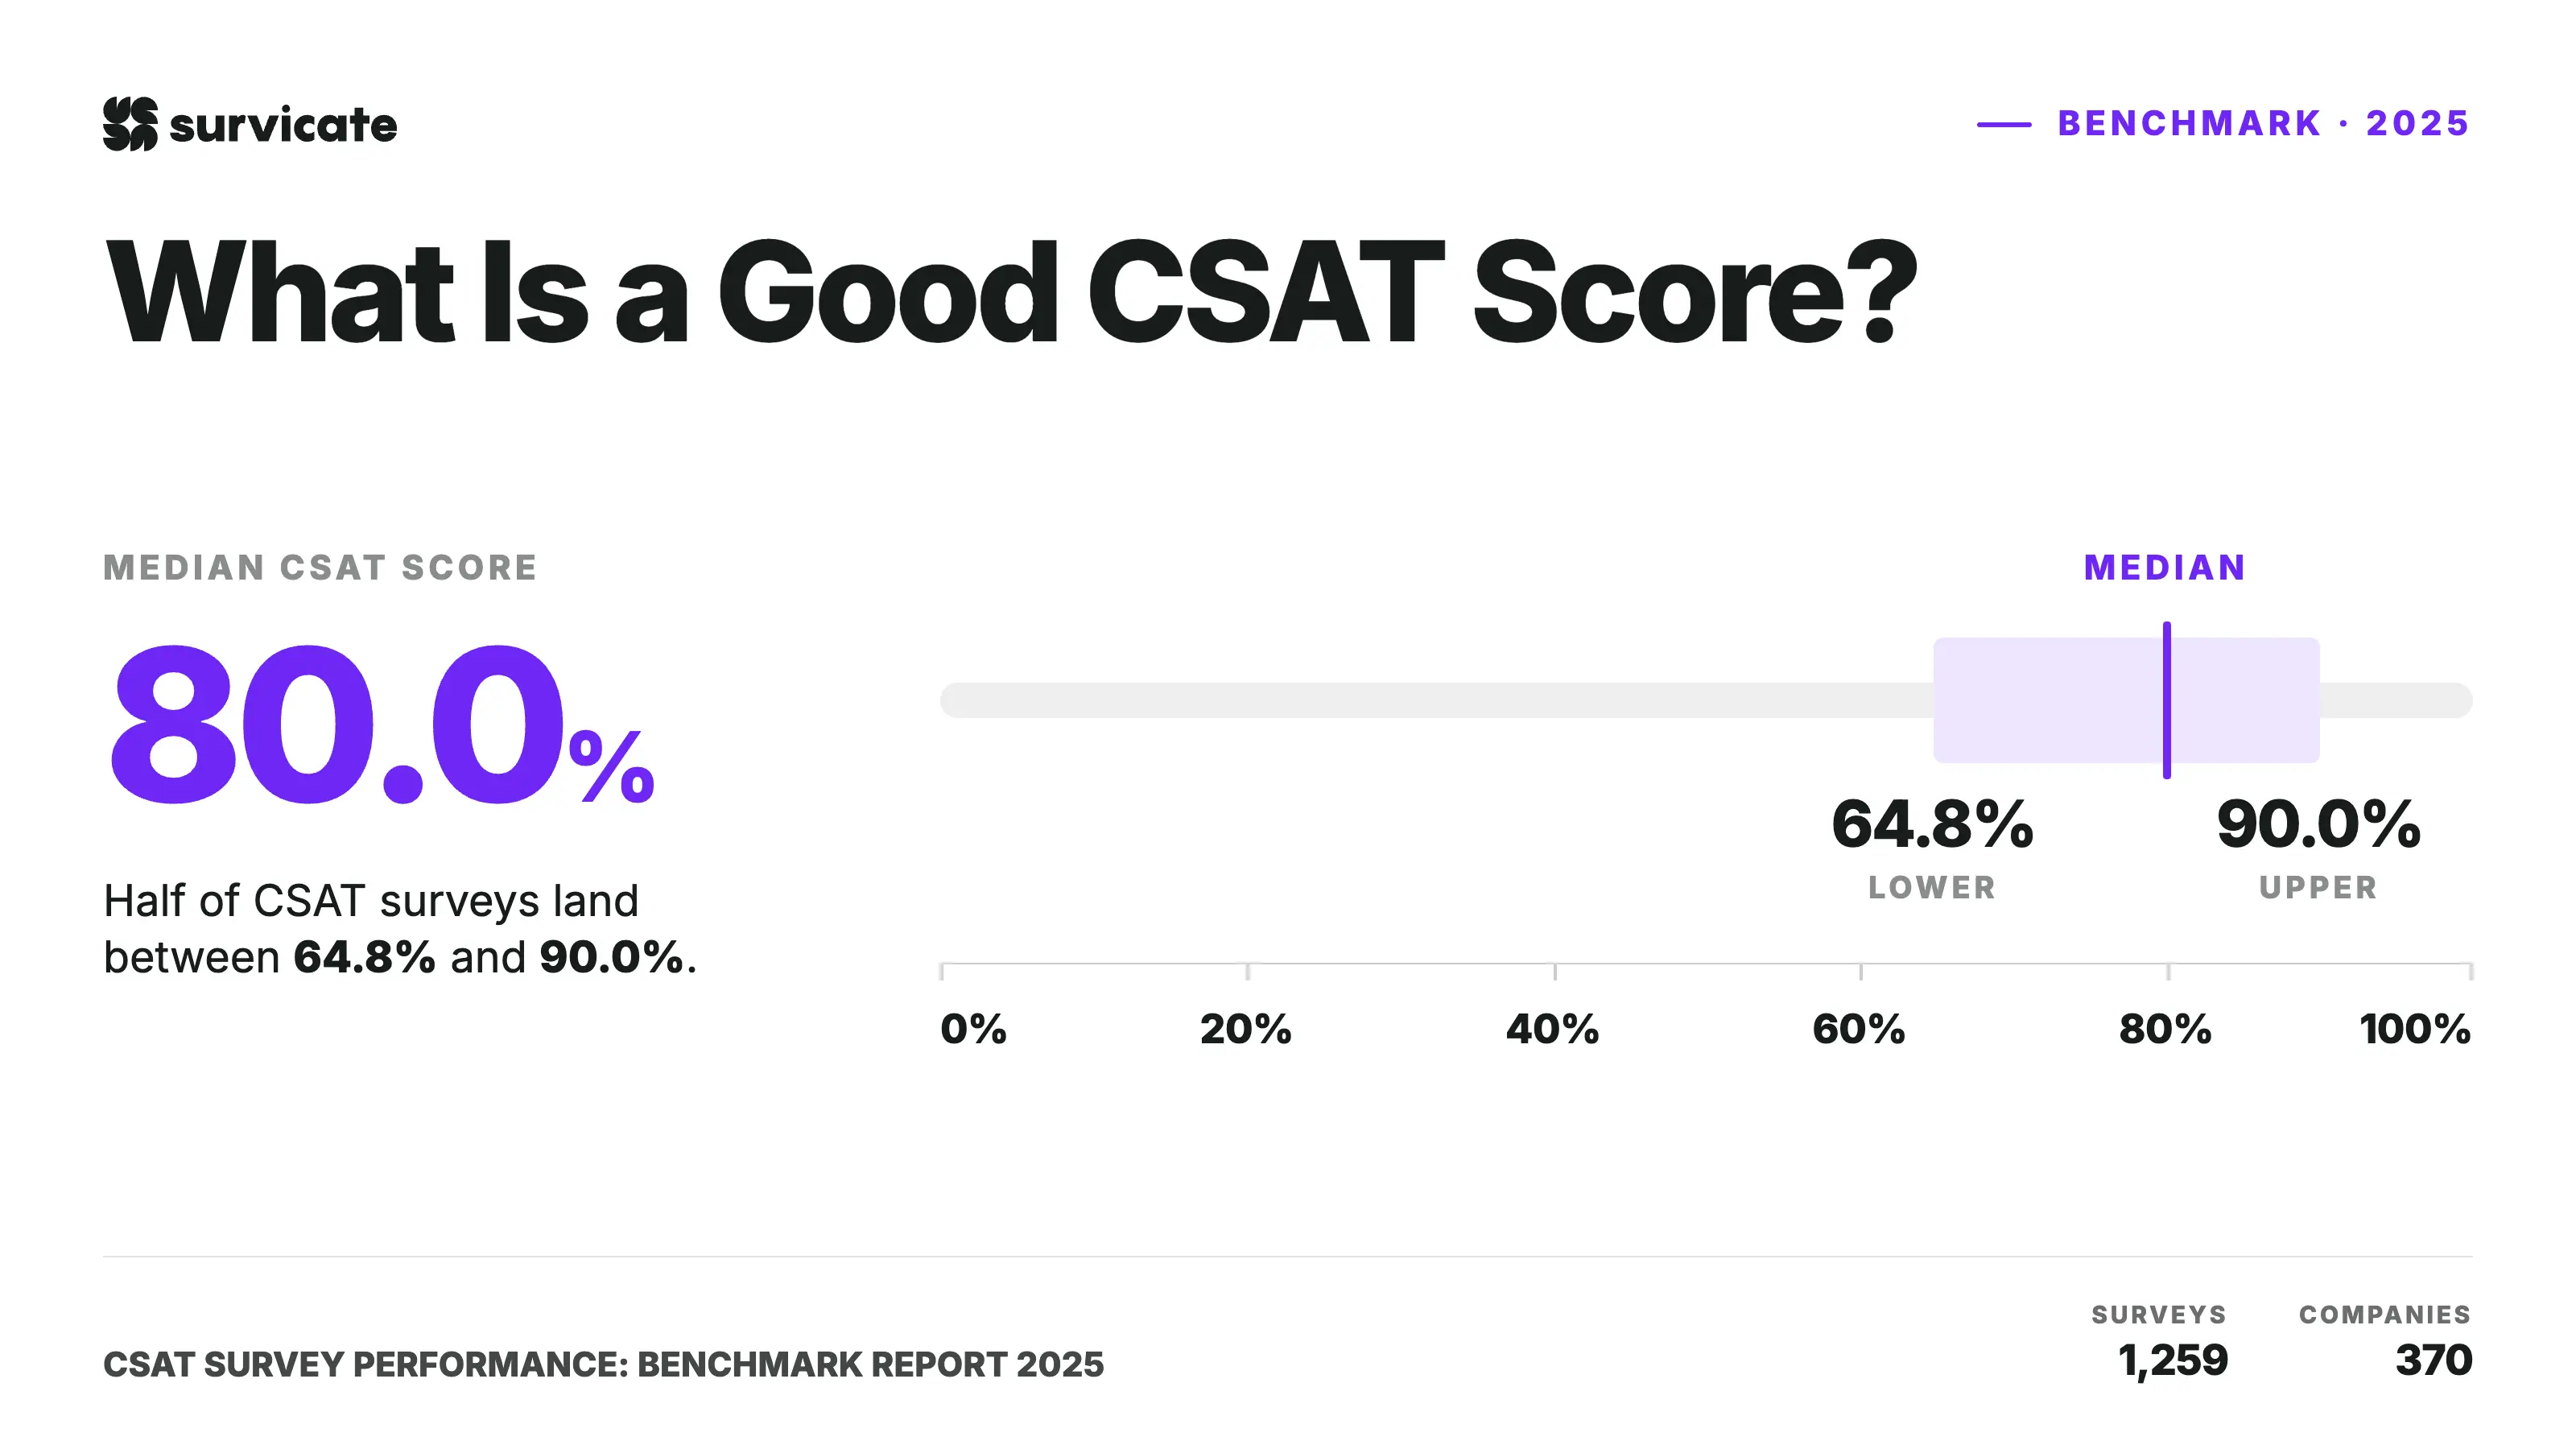
A median CSAT score sits right at 80.0%.
Before we look deeper into the numbers, let's clear up a common mix-up, i.e., scale versus score. When customers take a survey, they often pick a number on a 5-point rating scale. But an average rating, like 4.2 out of 5, is not a CSAT score. CSAT measures the percentage of total responses that fall into the satisfied range (ratings of 4 and 5).
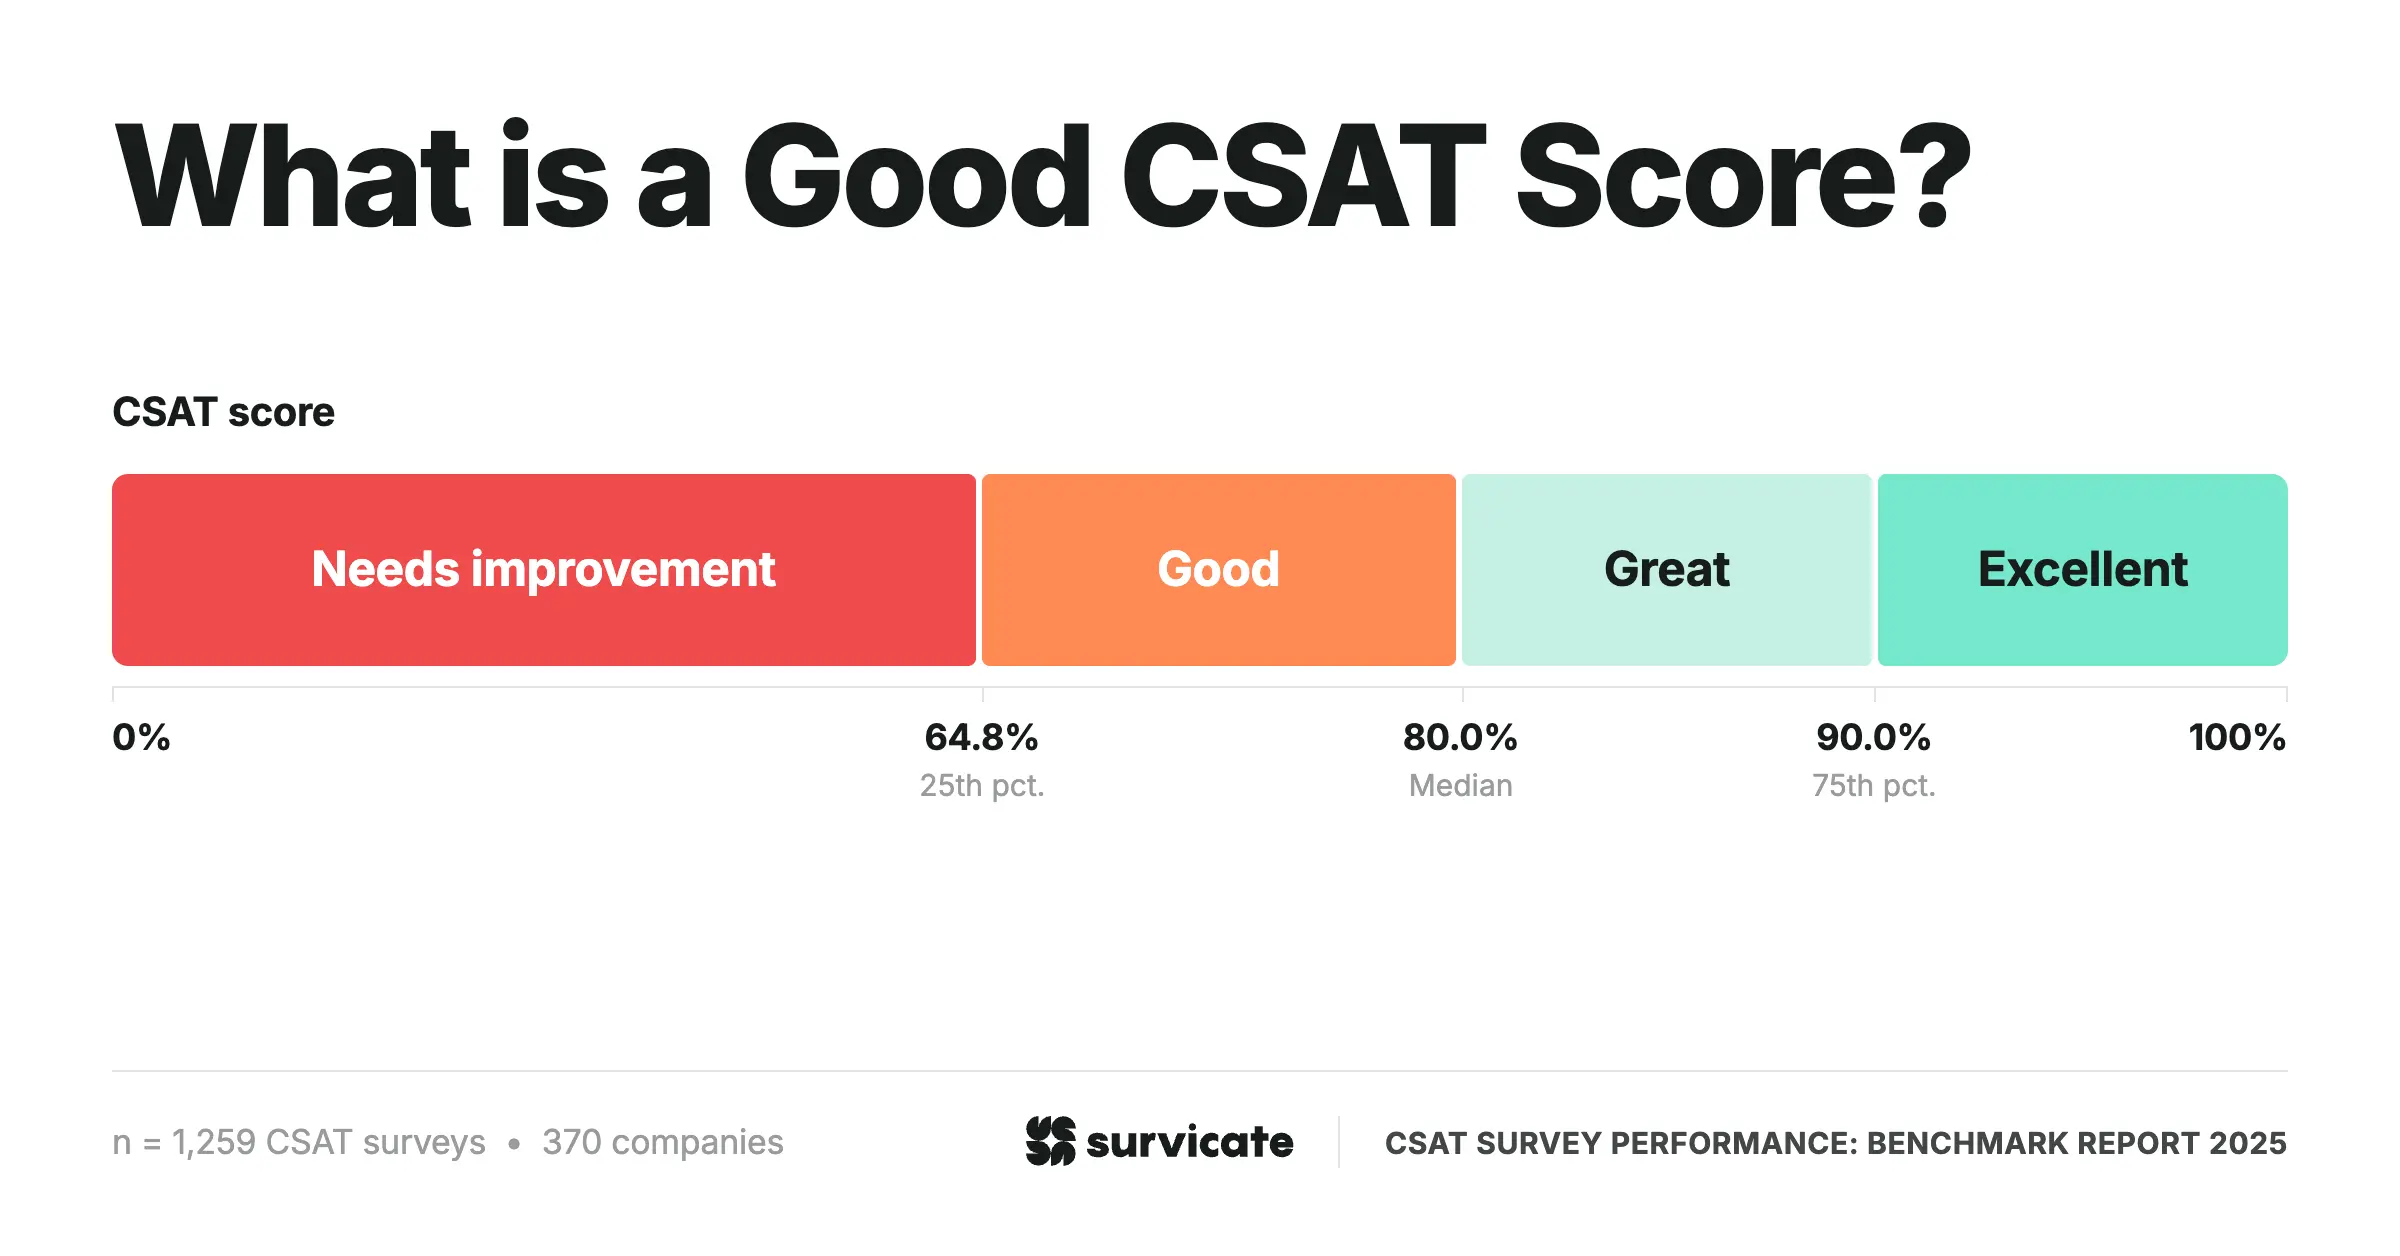
Here is how customer satisfaction breaks down across the full dataset:
If your score hits 80%, you match the middle of the pack. Drop toward 64.8%, and it's time to find where your product or service creates friction. Cross above 90.0%, and your team lands in the top quartile of companies we studied.
The 5-point rating scale dominates across CSAT questions
Before you compare scores, you need to know how companies measure satisfaction. The scale determines what counts as "satisfied," so every benchmark down the line relies on this setup.
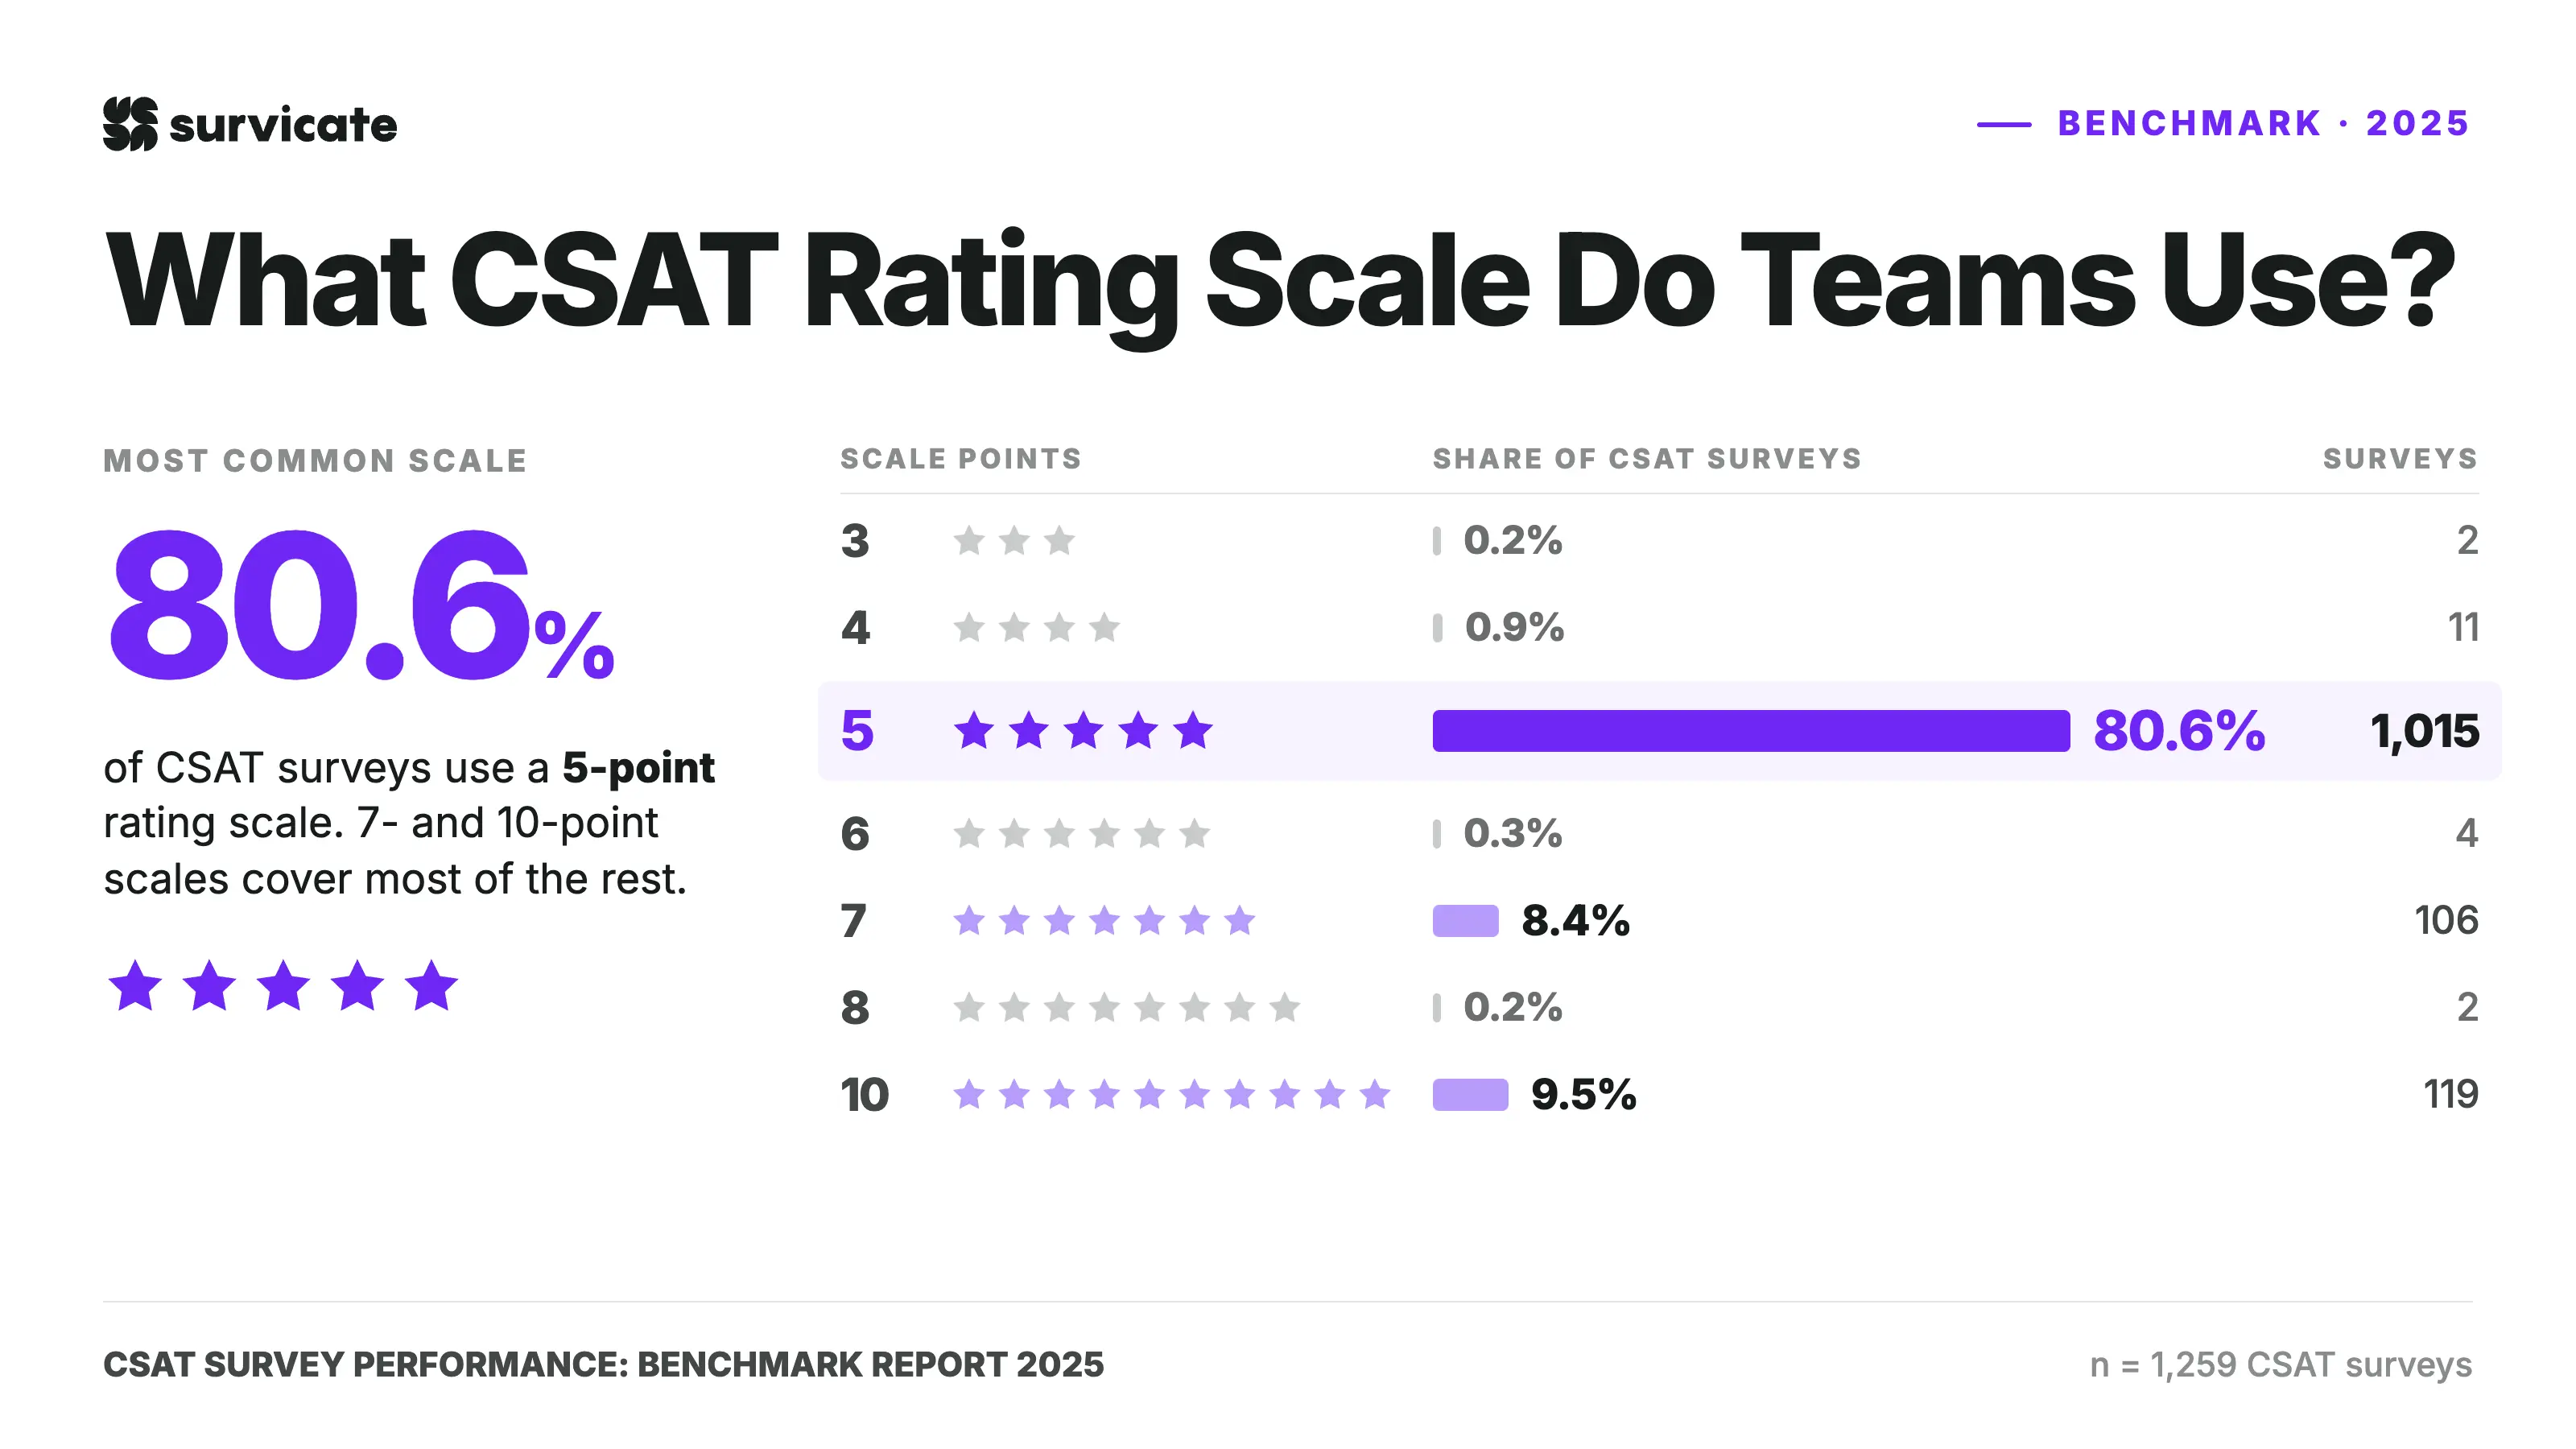
The data reveals a clear standard: 5-point scales dominate the space. Out of 1,259 surveys, 1,015 companies pick this format, which accounts for 80.6% of the entire sample.
In fact, only three scale lengths show up with any real frequency. Together, 5-, 7-, and 10-point options make up 98.5% of all surveys in our study:
Anything outside these three options amounts to a rounding error. 3-, 4-, 6-, and 8-point options total just 19 surveys combined (1.5%), while 2- and 9-point scales vanish entirely. Zero companies in our dataset used them.
When it comes to visual presentation, visual shapes like stars, hearts, and thumbs take the top spot:
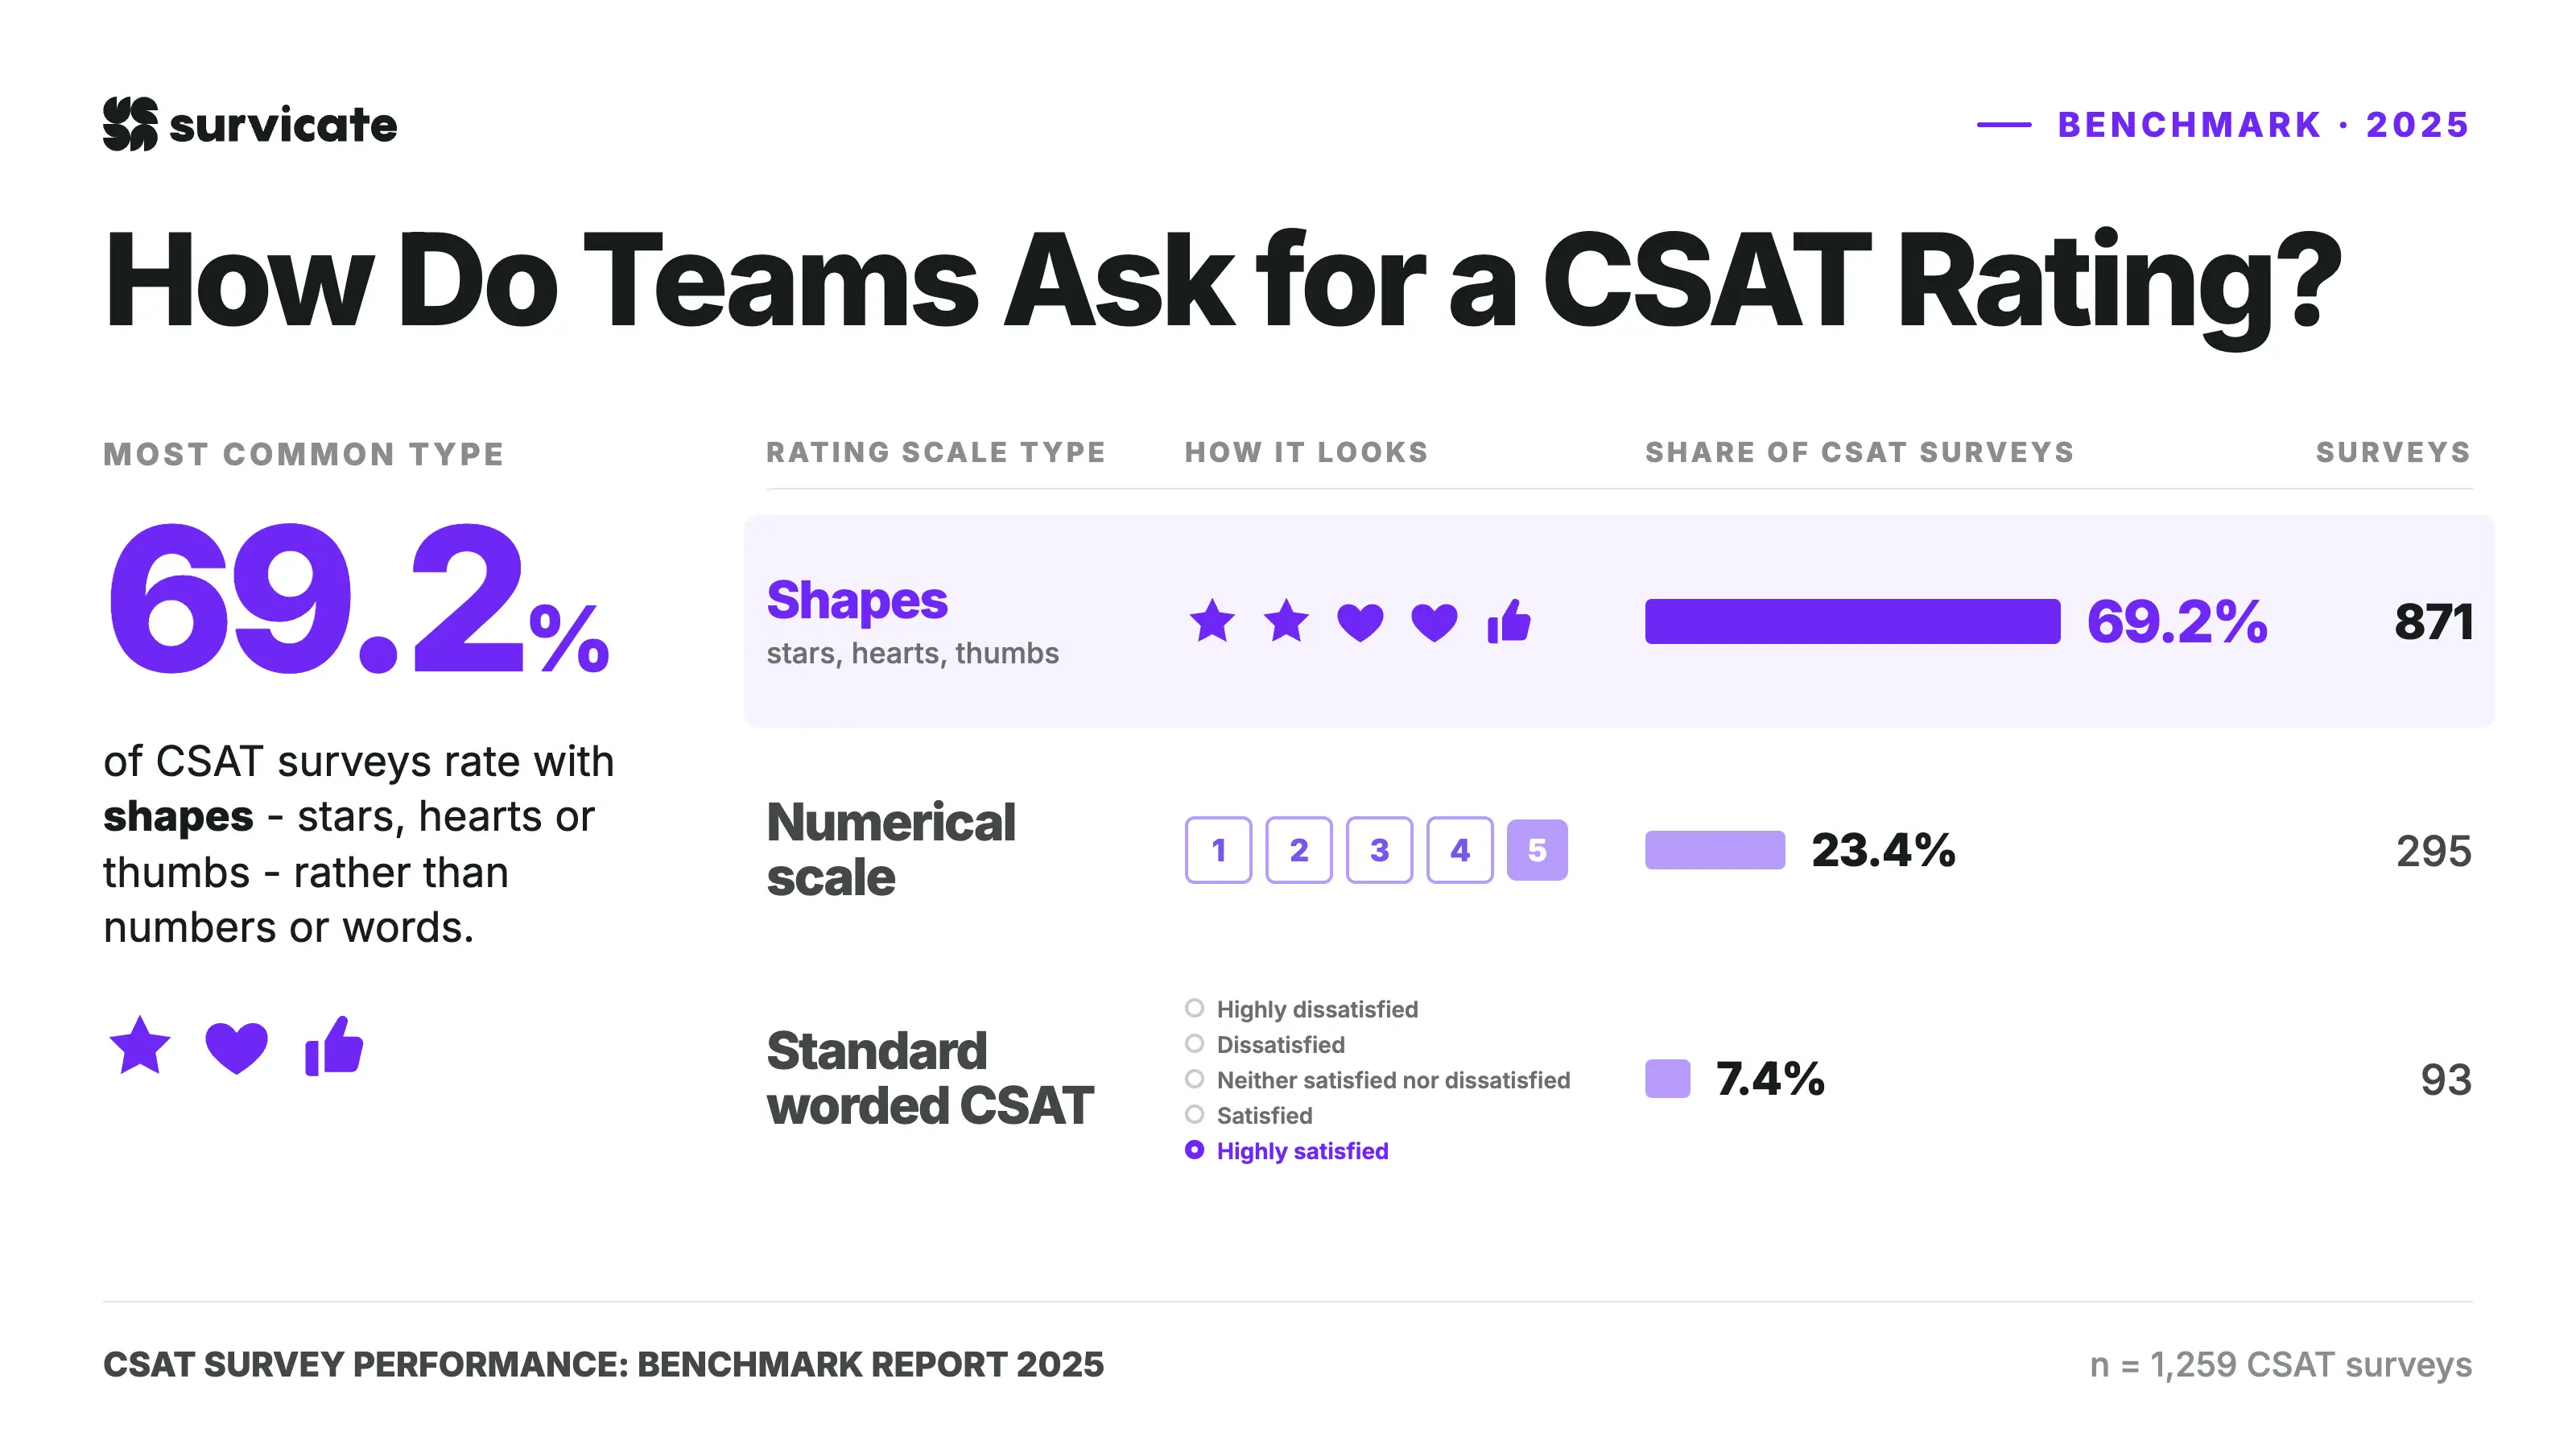
Companies choose shapes 69.2% of the time – nearly three times more often than plain numbers (23.4%) and roughly nine times more often than traditional worded options like "Very Satisfied" (7.4%). Stars, hearts, and thumbs offer quick visual context, which helps boost completion rates on web and mobile screens.
Note: In this version of the report we chose to exclude emojis as rating scale type.
Most CSAT surveys grab a 7.5% response rate
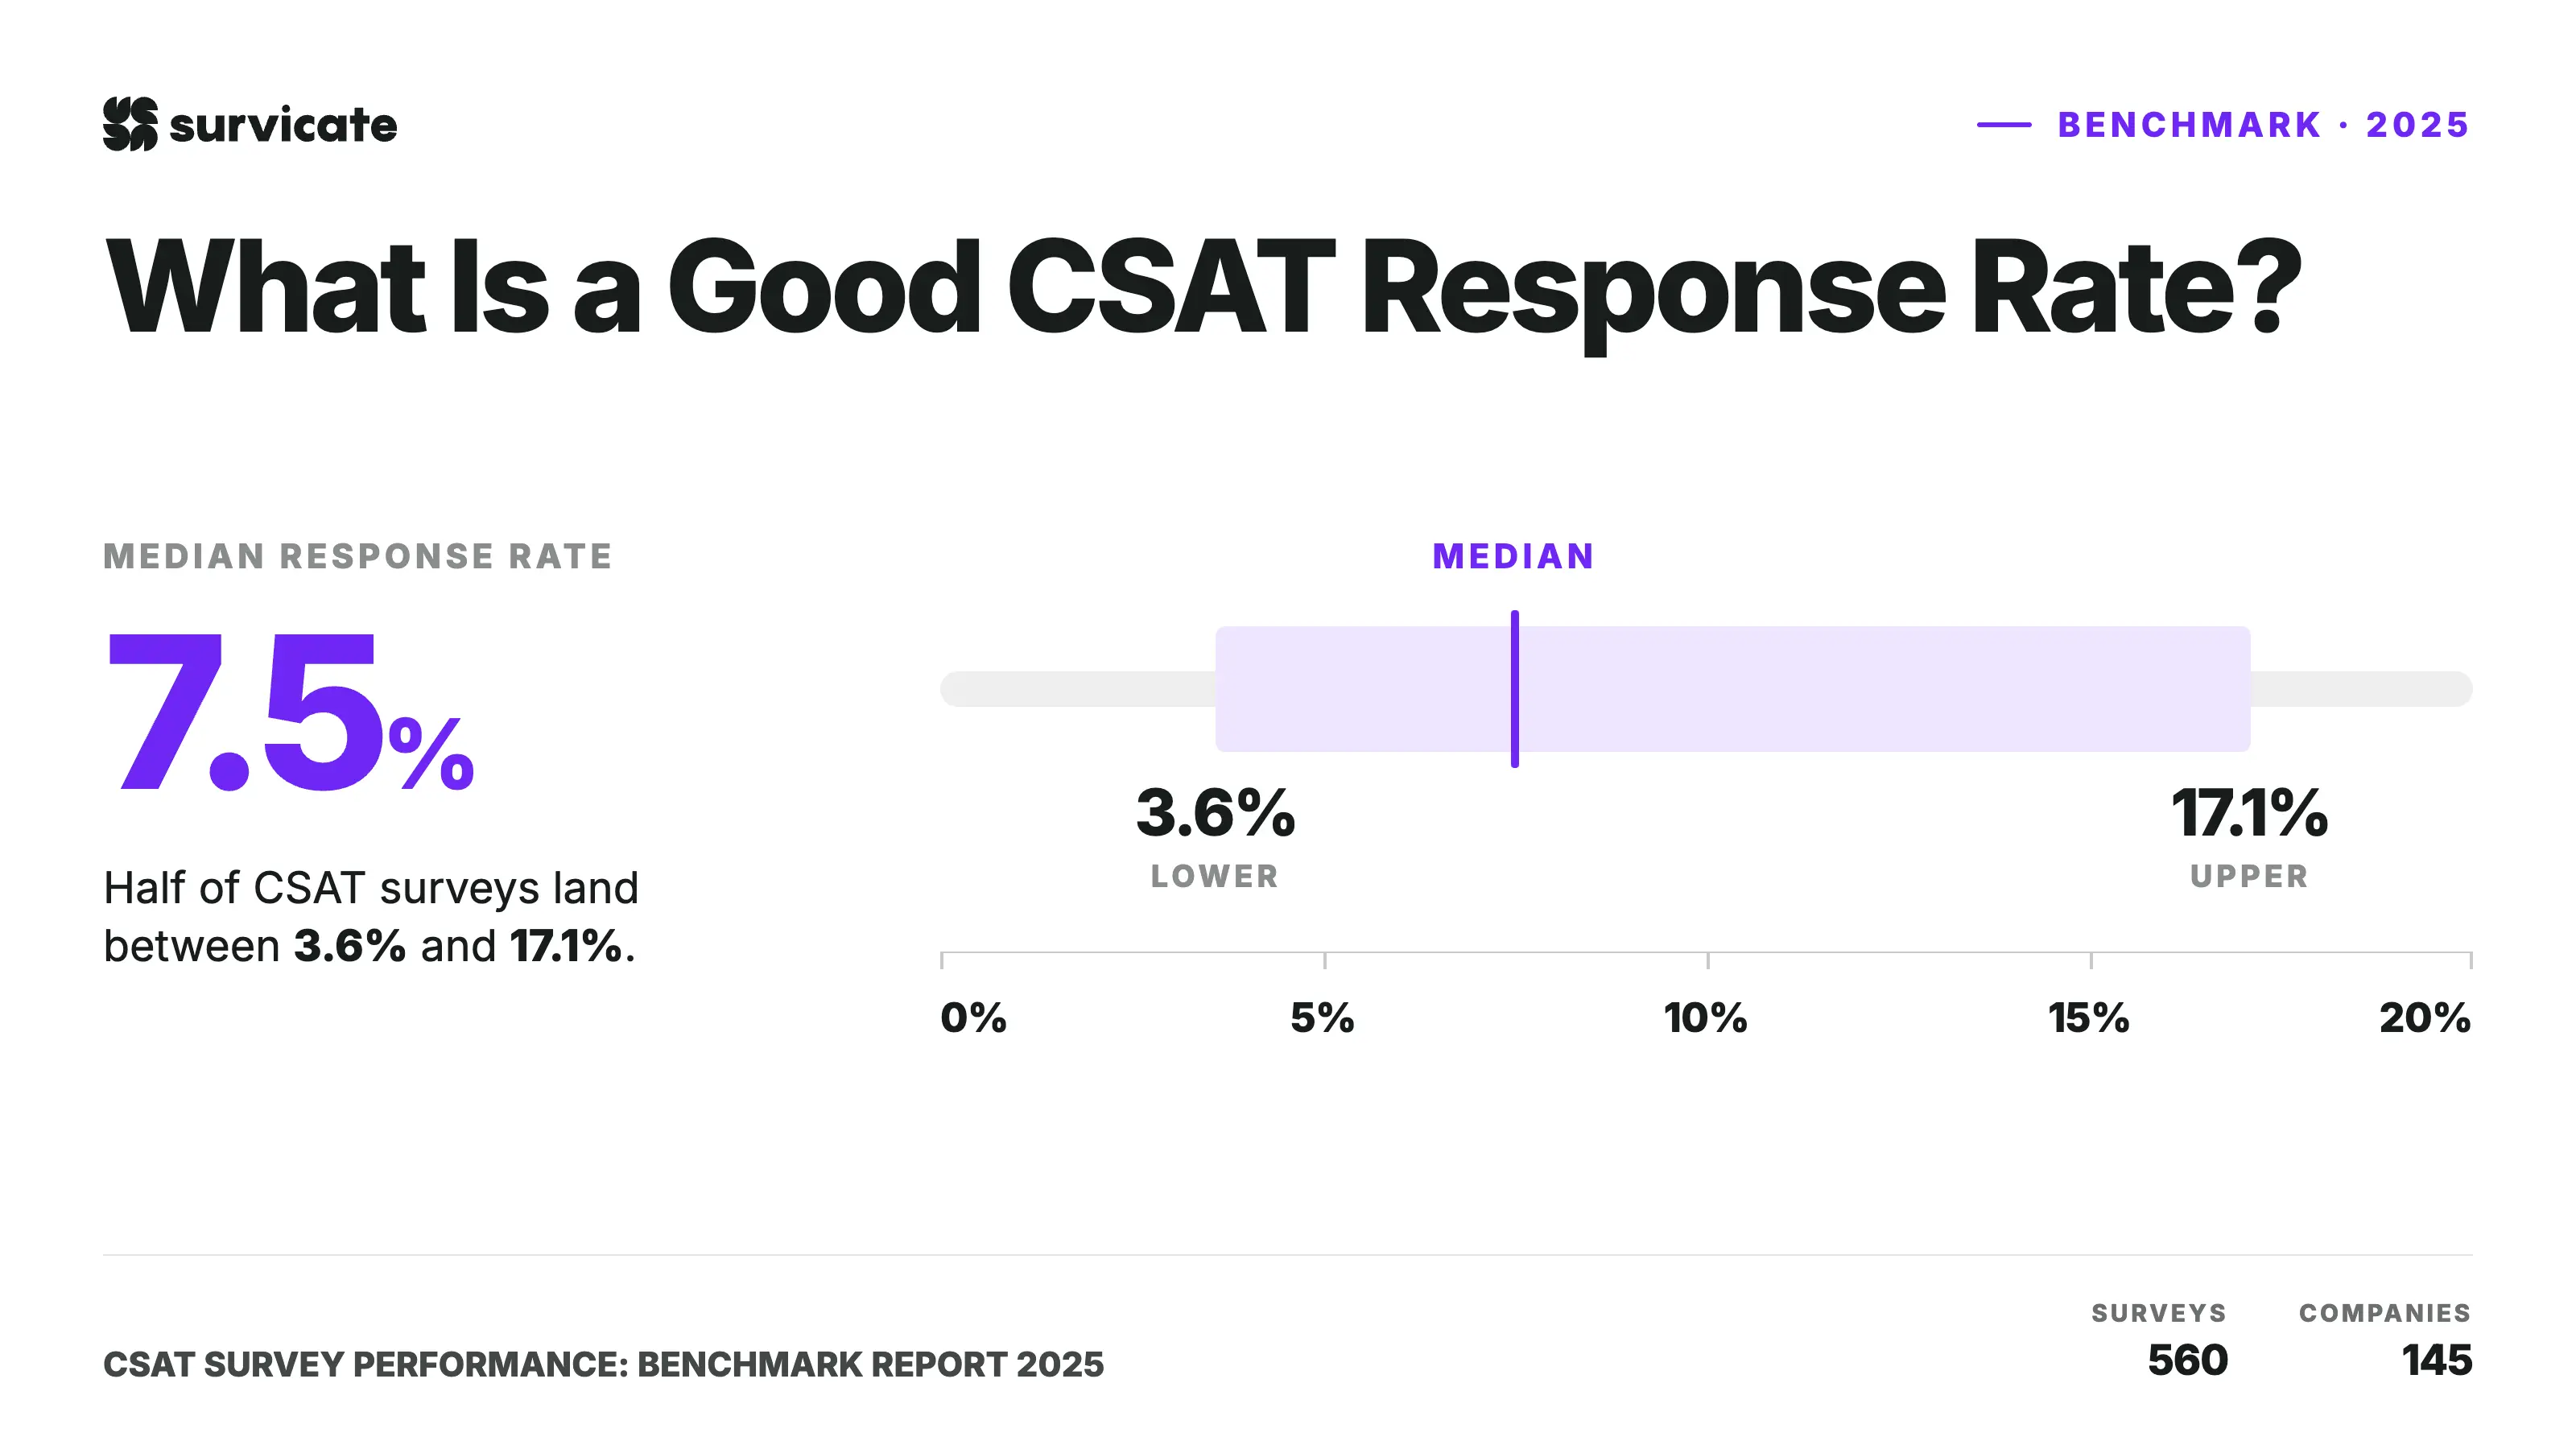
Across 560 eligible surveys and 145 companies, the median CSAT response rate lands at 7.5%.
Here is how overall performance spreads out across quartiles:
That spread shows a big gap between average execution and top performers. Surveys in the 75th percentile pull a 17.1% response rate, nearly five times higher than those in the bottom 25% (3.6%).
You will notice this dataset uses 560 surveys rather than the full 1,259 used for score calculations. That choice keeps the numbers accurate. We excluded link-based page surveys because third-party distribution masks view counts and self-selected audiences distort performance.
If your team collects replies from 7 to 8 out of every 100 people who view your survey, your performance sits right on the market average. Reach past 17%, and your distribution setup performs in the top quarter of all campaigns.
The majority of CSAT surveys achieve a completion rate of 78.9%
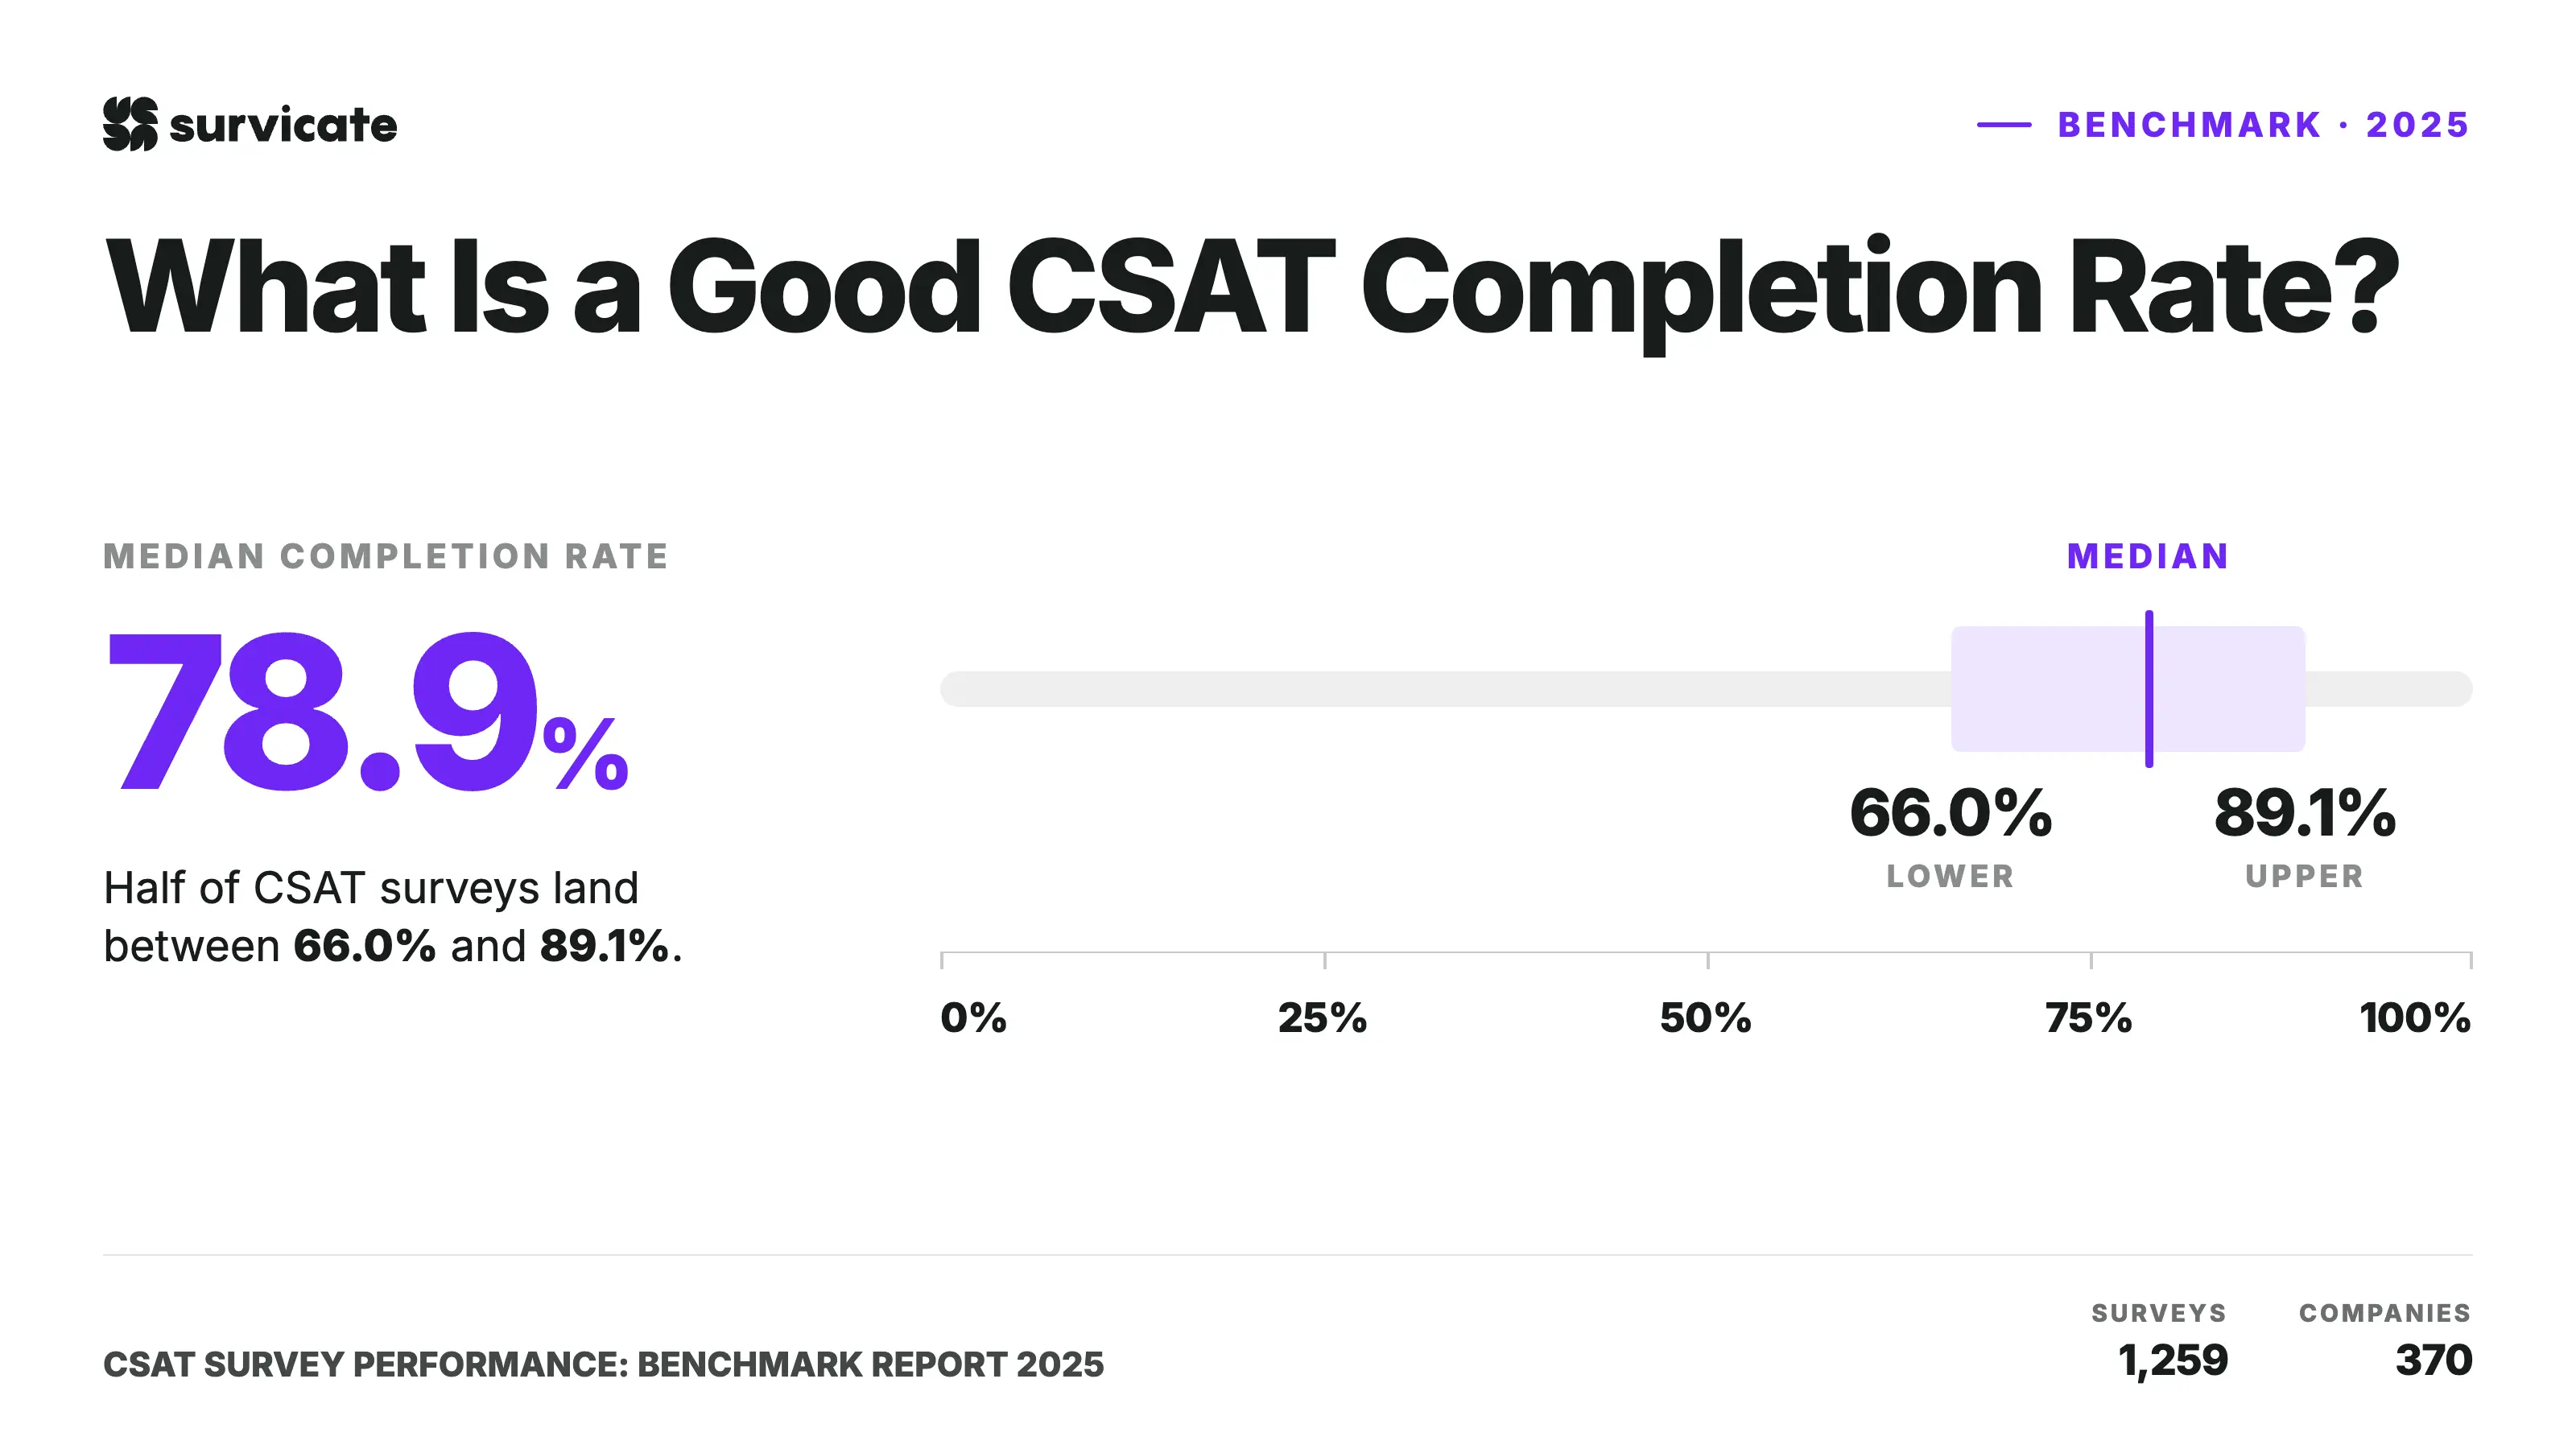
Completion rate answers a different question than response rate. While response rate measures how many people start a survey after seeing it, completion rate shows how many questions on average are answered across all respondents. Since these metrics capture different stages of the survey journey, we also analyze them separately in this report.
Across the full dataset of 1,259 CSAT surveys from 370 companies, the median completion rate is 78.9%. The middle 50% of CSAT surveys recorded completion rates between 66.0% (25th percentile) and 89.1% (75th percentile). Compared to response rates, completion rates show less variation across the dataset, suggesting that once respondents begin a CSAT survey, most go on to complete it.
Completion rates don't decline as surveys get longer
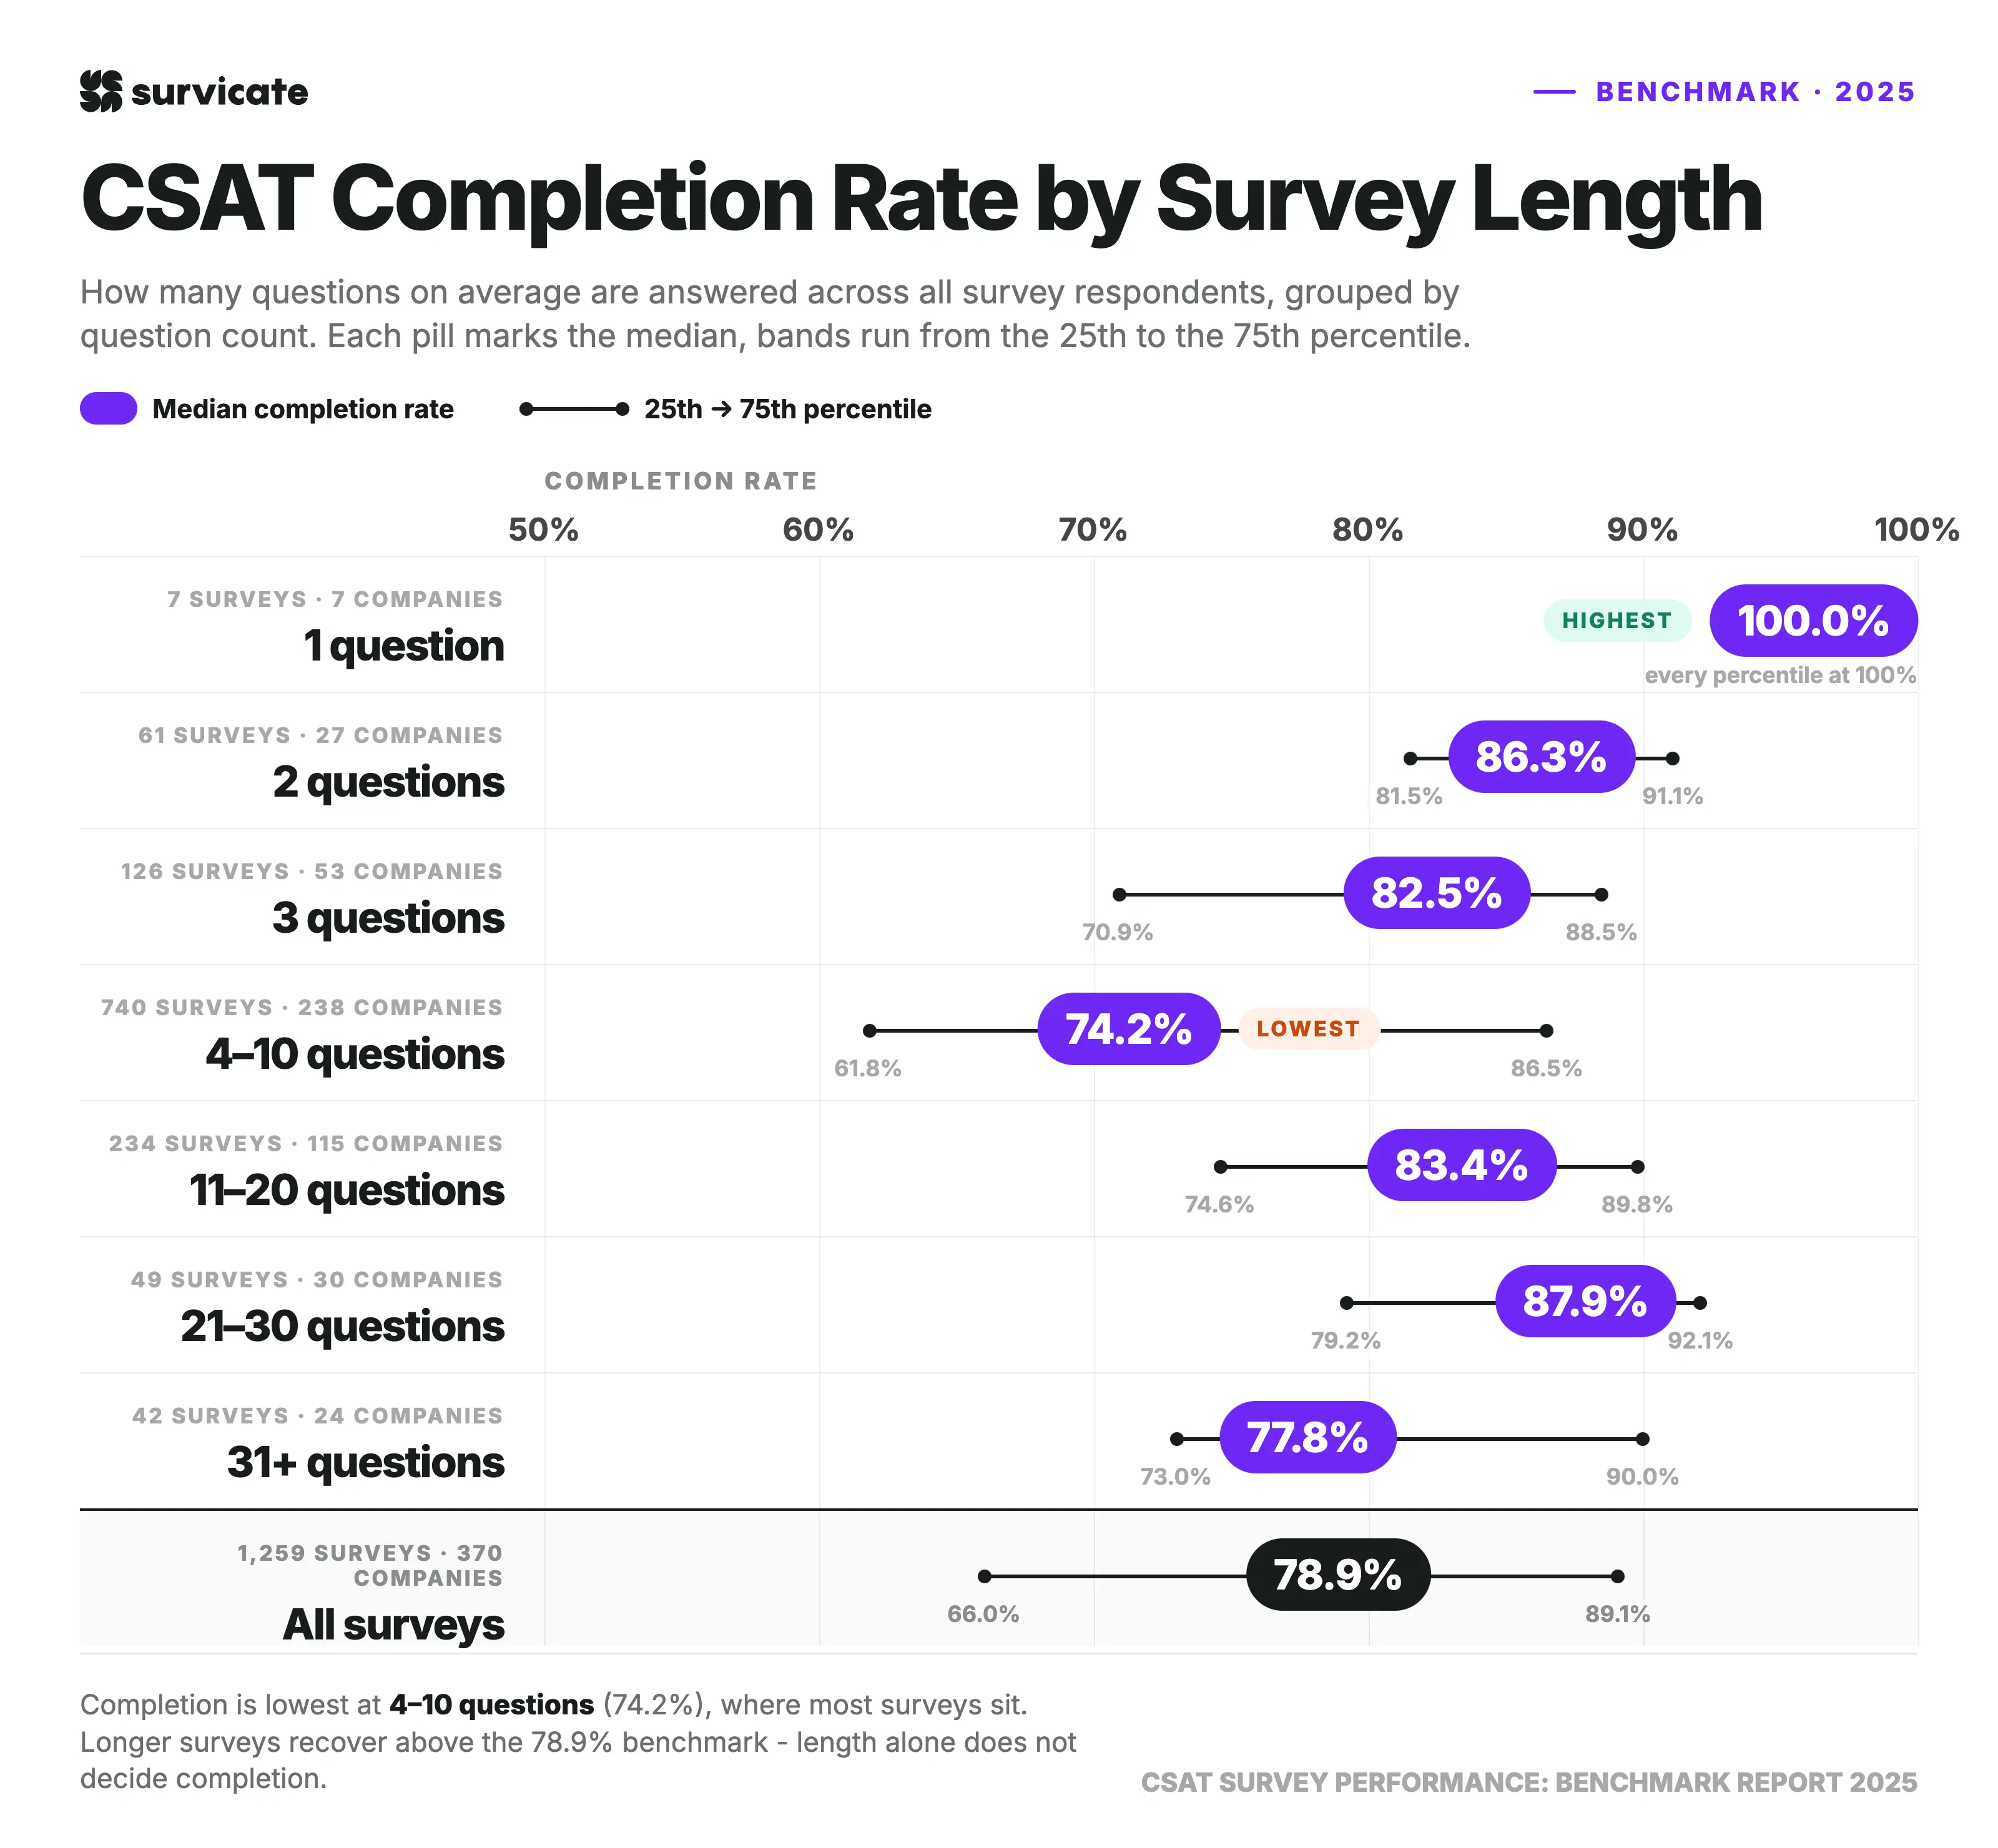
Among surveys with 2 to 30 questions, completion rates don't follow a steady downward trend. They drop from 86.3% for 2-question surveys to 74.2% for surveys with 4 to 10 questions, then climb again to 83.4% for 11 to 20 questions and 87.9% for 21 to 30 questions. Only surveys with 31 or more questions show another decline, reaching a median completion rate of 77.8%.
One result stands out in particular. Surveys with 4 to 10 questions make up nearly 59% of the dataset (740 surveys from 238 companies). Yet, they record the lowest completion rate of any multi-question category. At the same time, several longer survey groups achieve noticeably higher completion rates.
This pattern shows that survey length alone doesn't explain whether respondents finish a survey. There are other factors that are likely to influence completion, such as:
- who receives the survey,
- when they see it,
- and why they're taking it.
Longer surveys, for example, are often shared with audiences who have already agreed to participate. They’re a common choice for research panels or customers taking part in post-onboarding or feedback programs.
You'll also notice that single-question surveys reach a completion rate of 100% in most cases. That's expected, because once a respondent answers the only question, they've completed the survey by definition.
Survey format is one of the strongest predictors of CSAT, completion, and response rates
The way a survey reaches respondents is closely linked to how it performs. Below, page surveys refer to those displayed on a dedicated page within a website or app. Widget surveys appear as embedded pop-ups or slide-ins, and mobile surveys run inside mobile apps.
Page surveys achieve the highest CSAT scores
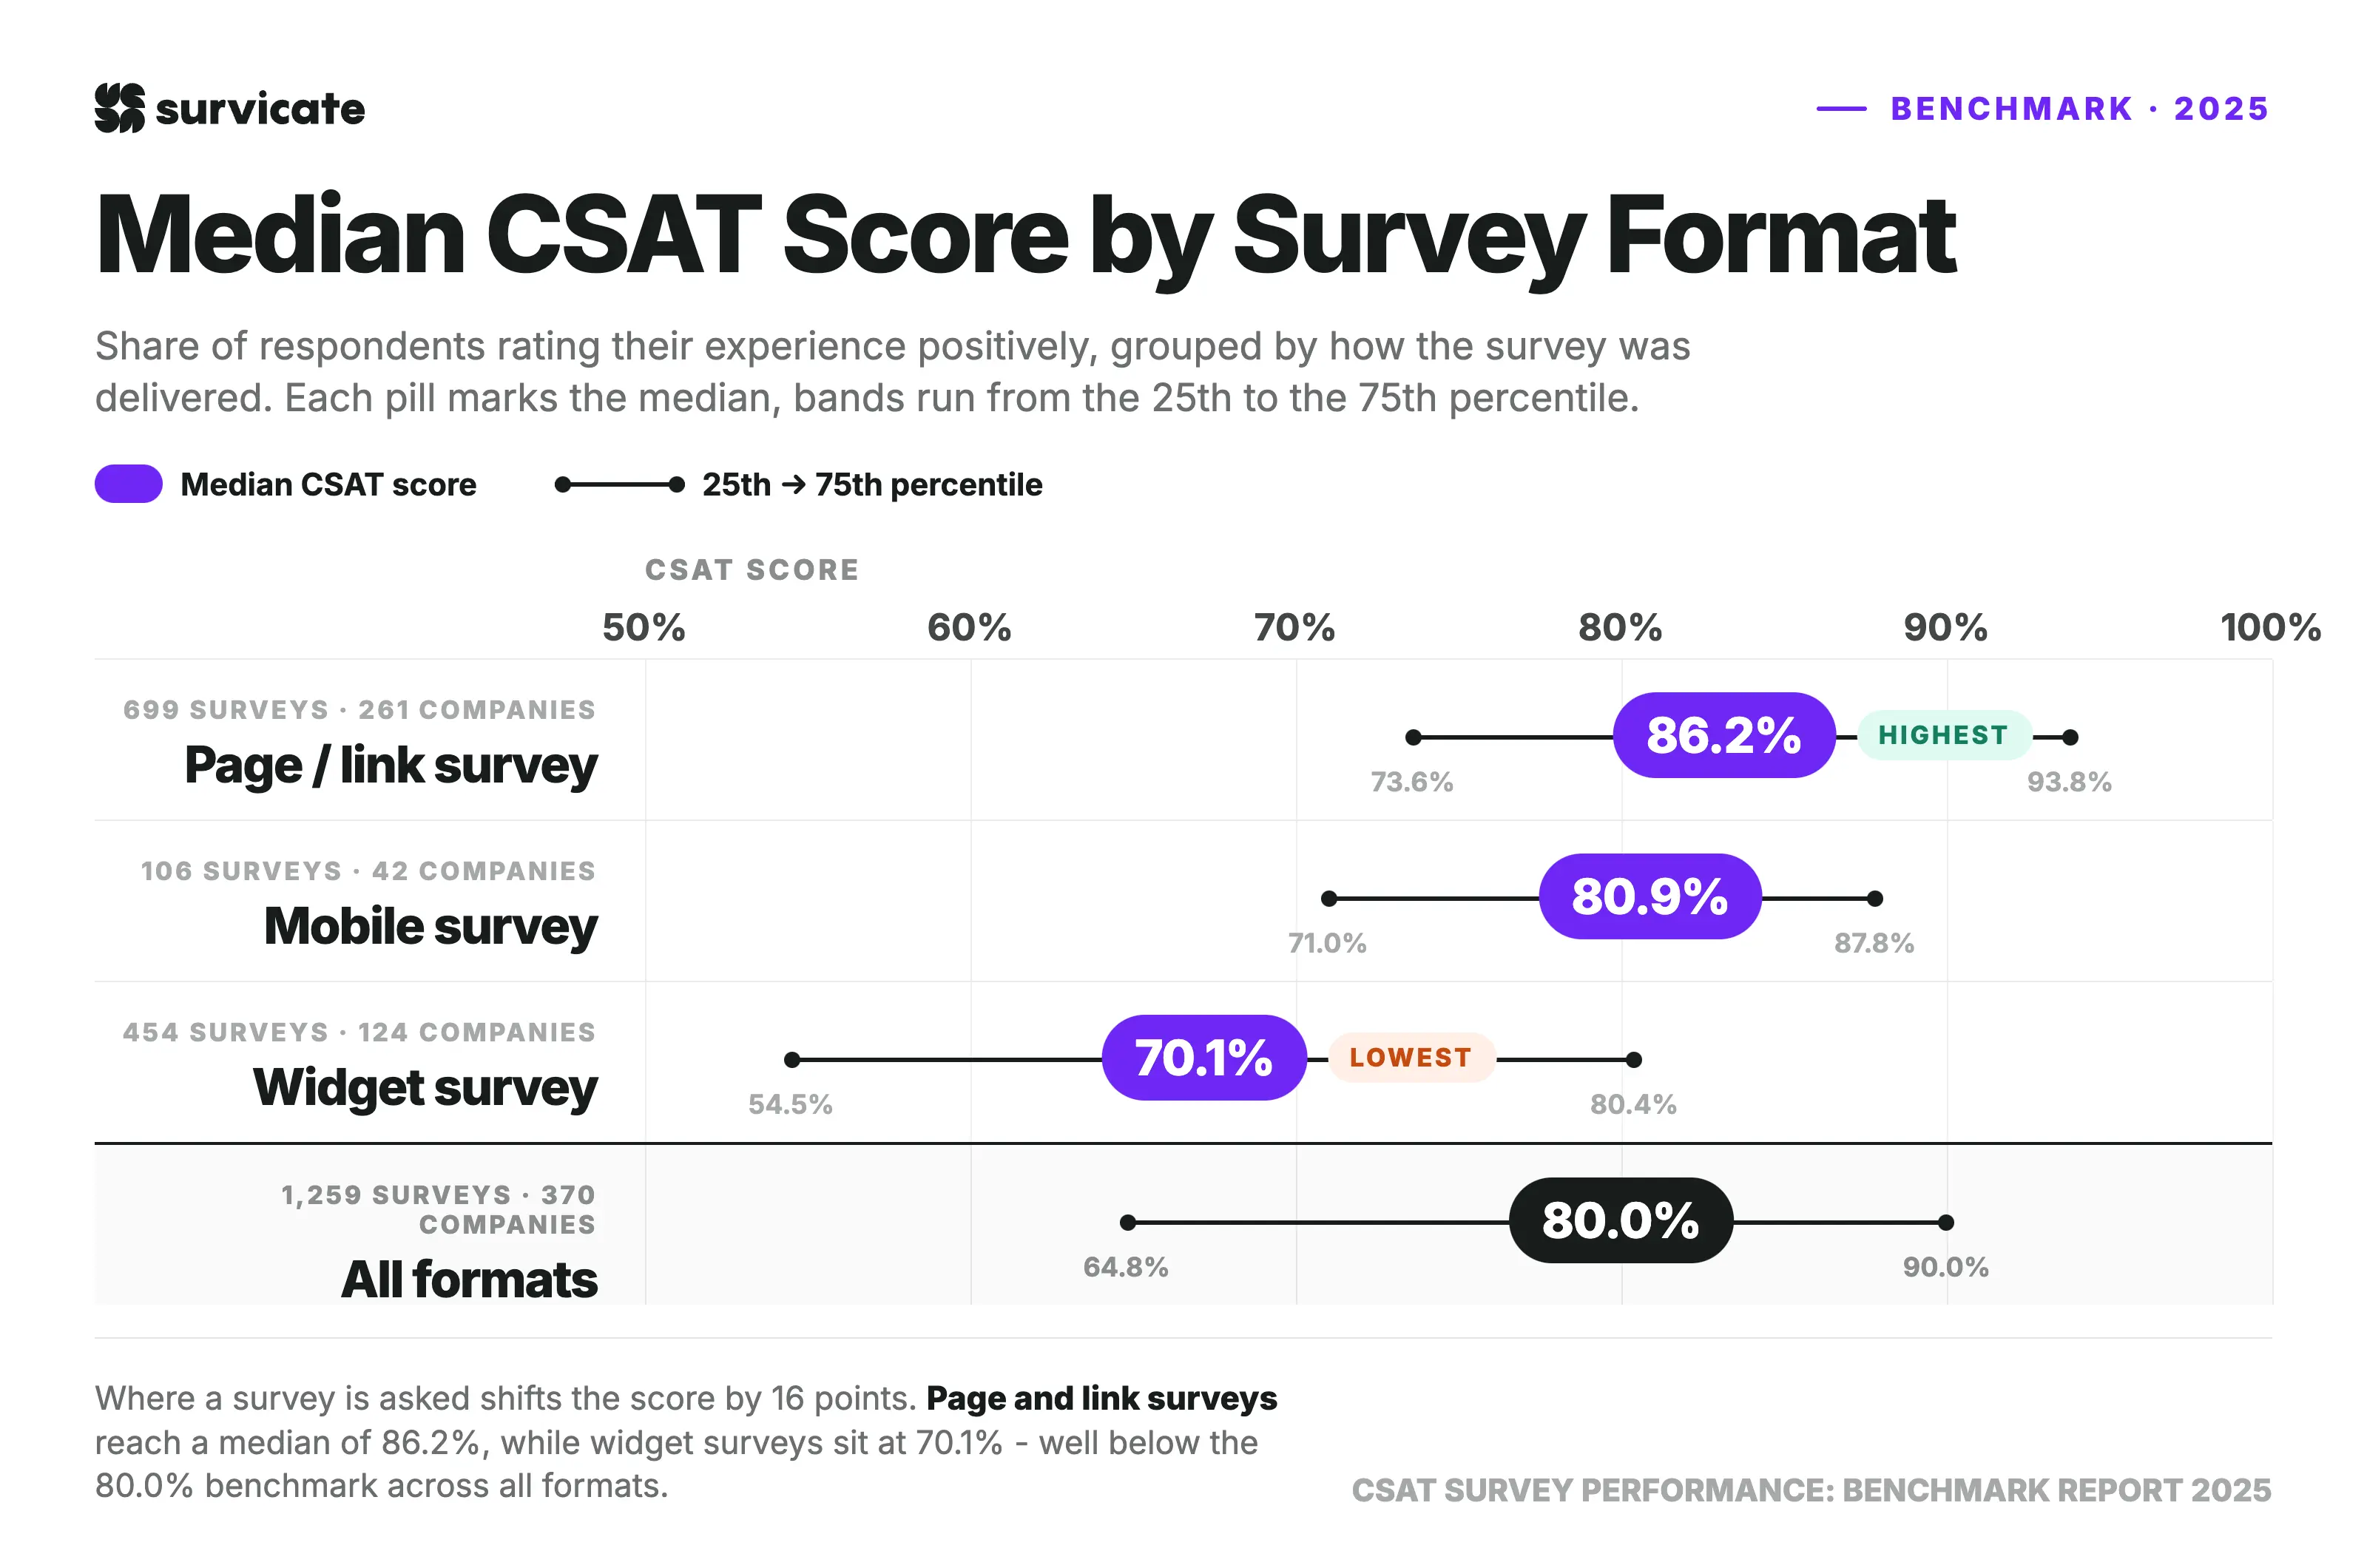
The differences are most visible in CSAT scores. Page surveys lead the dataset with a median score of 86.2%, more than six percentage points above the overall benchmark of 80.0%.
Mobile surveys follow at 80.9%, closely matching the overall median. Widget surveys record the lowest median score at 70.1% and show the widest spread of the three formats. Some widget surveys perform on par with page surveys, while others fall well below the benchmark.
Page surveys also lead completion rates
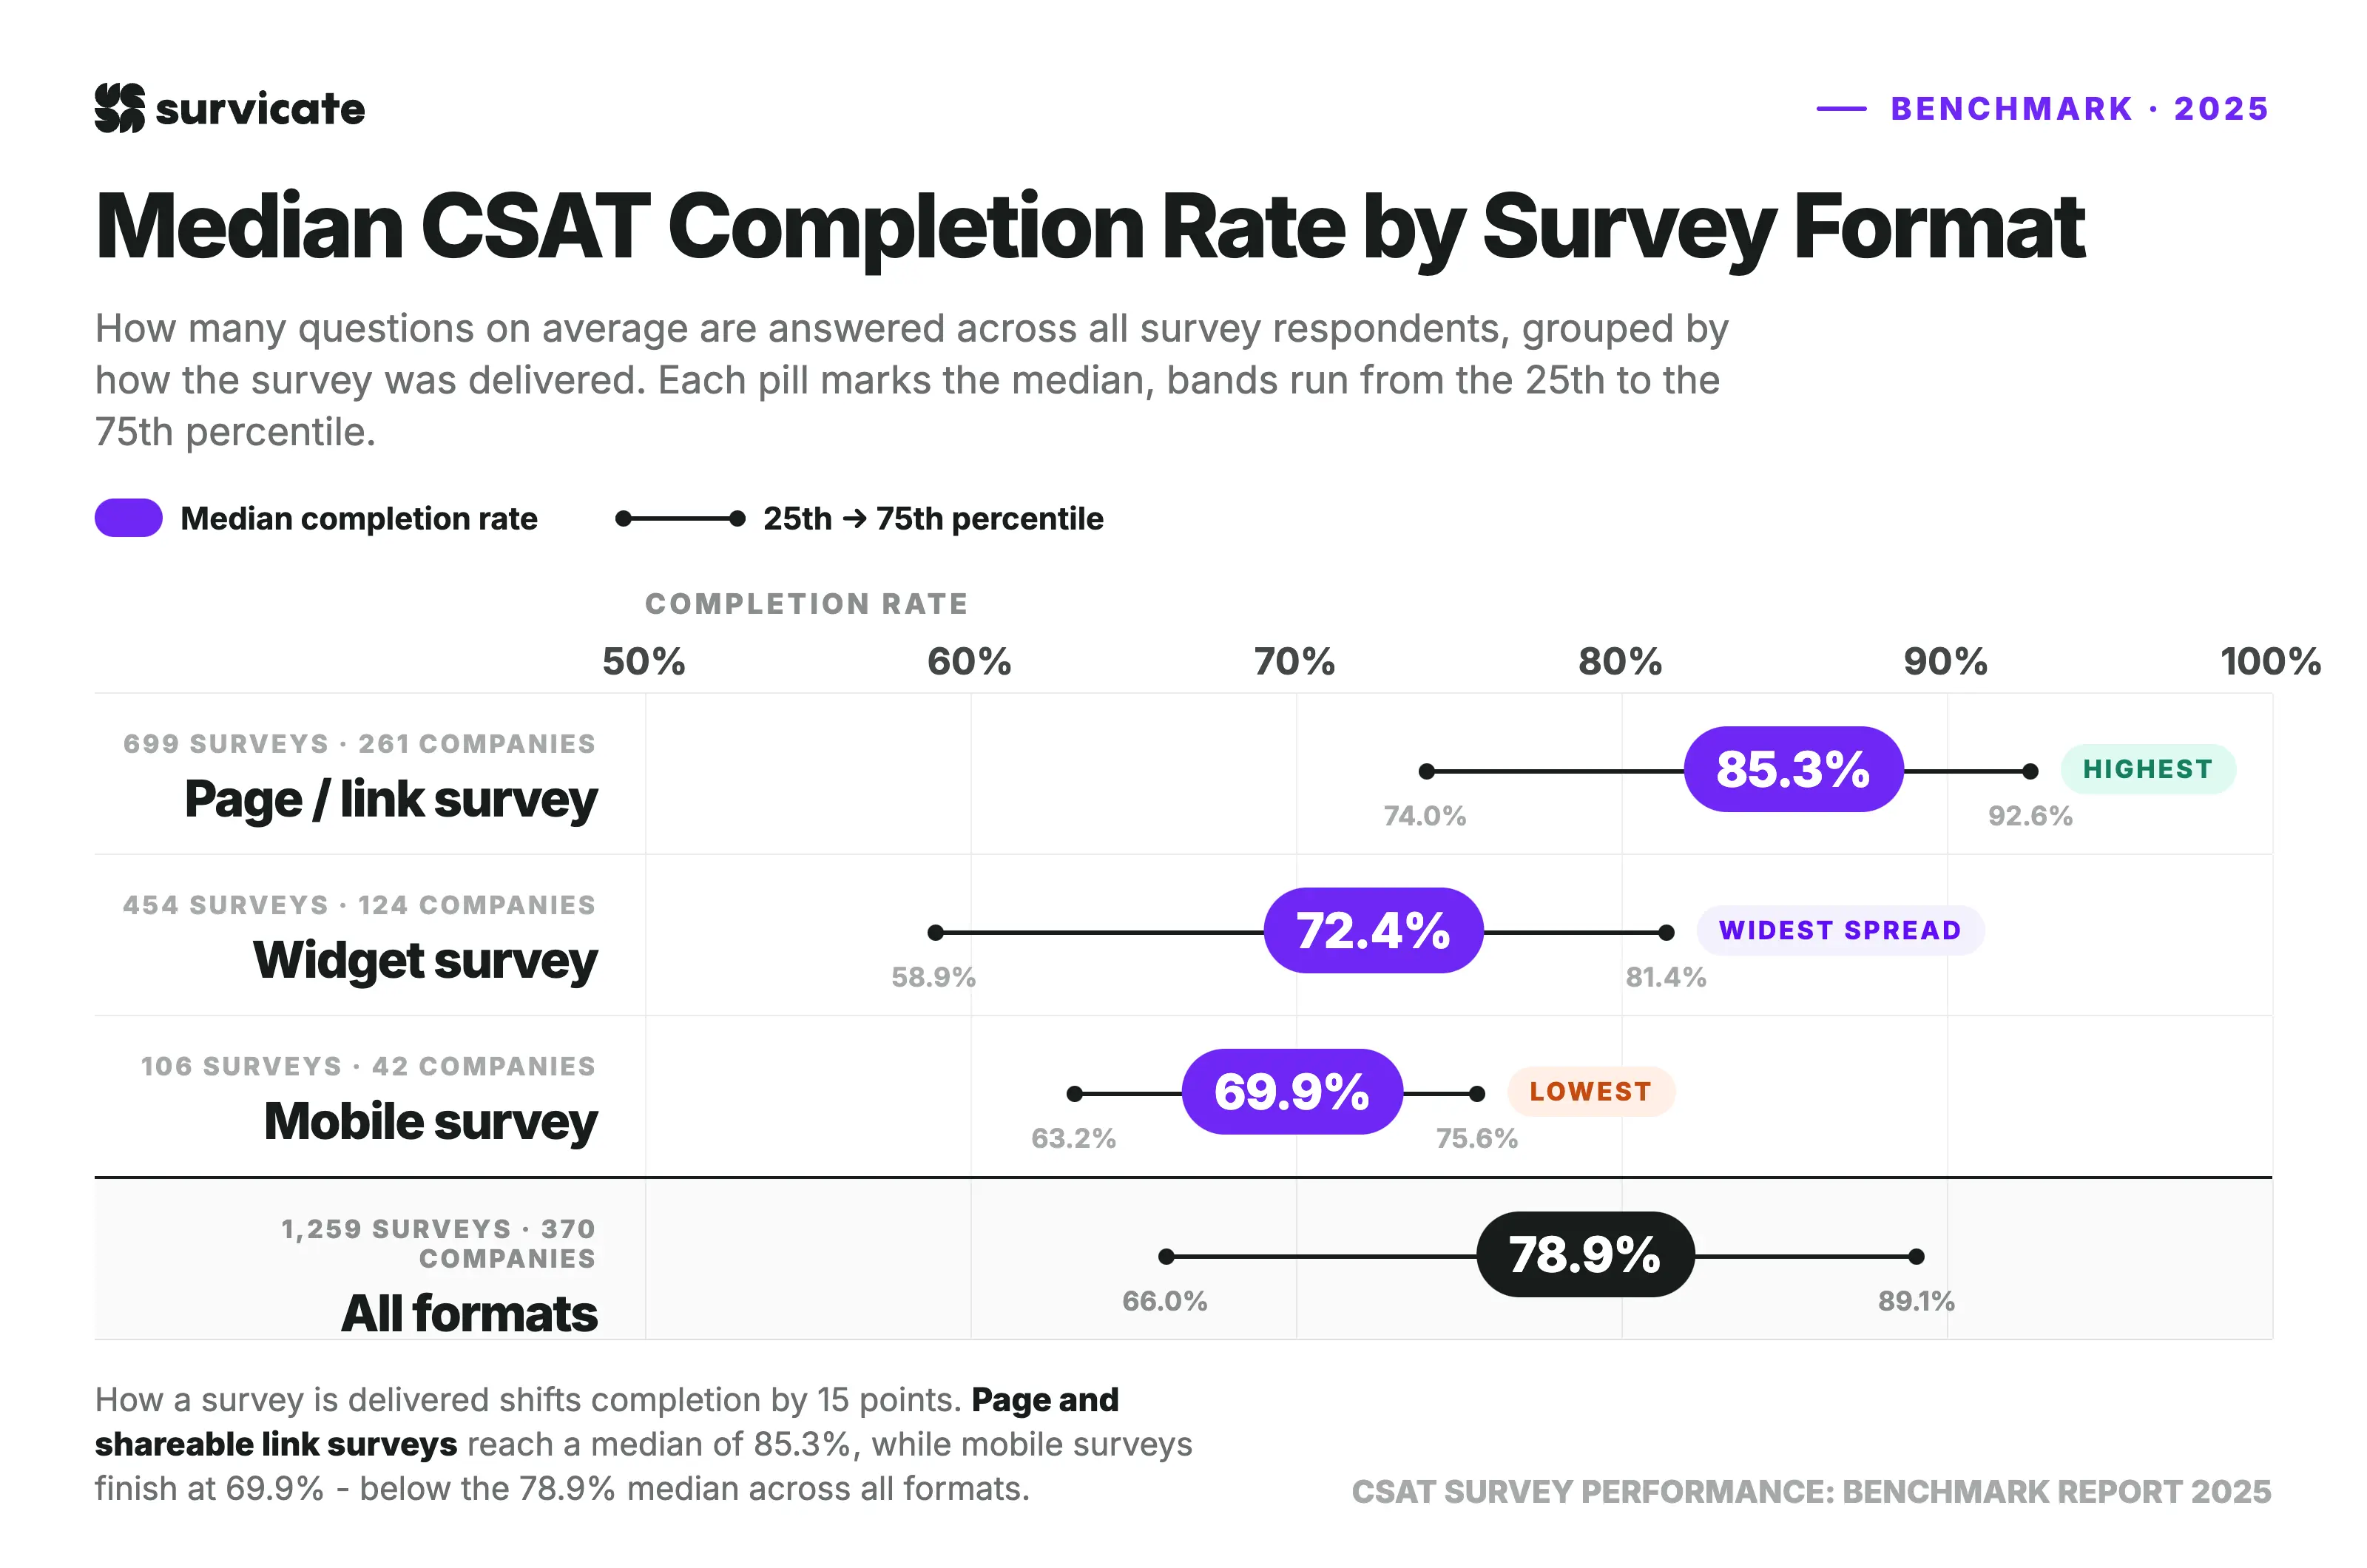
We can see a similar pattern in completion rates. Page surveys again rank first with a median completion rate of 85.3%. Widget surveys follow at 72.4%, while mobile surveys reach 69.9%. Although mobile surveys have the lowest median, they also show the narrowest spread between the 25th and 75th percentiles, suggesting more consistent performance. Widget surveys remain the most variable, with the widest gap between lower- and higher-performing results.
Mobile surveys are the winner in response rates
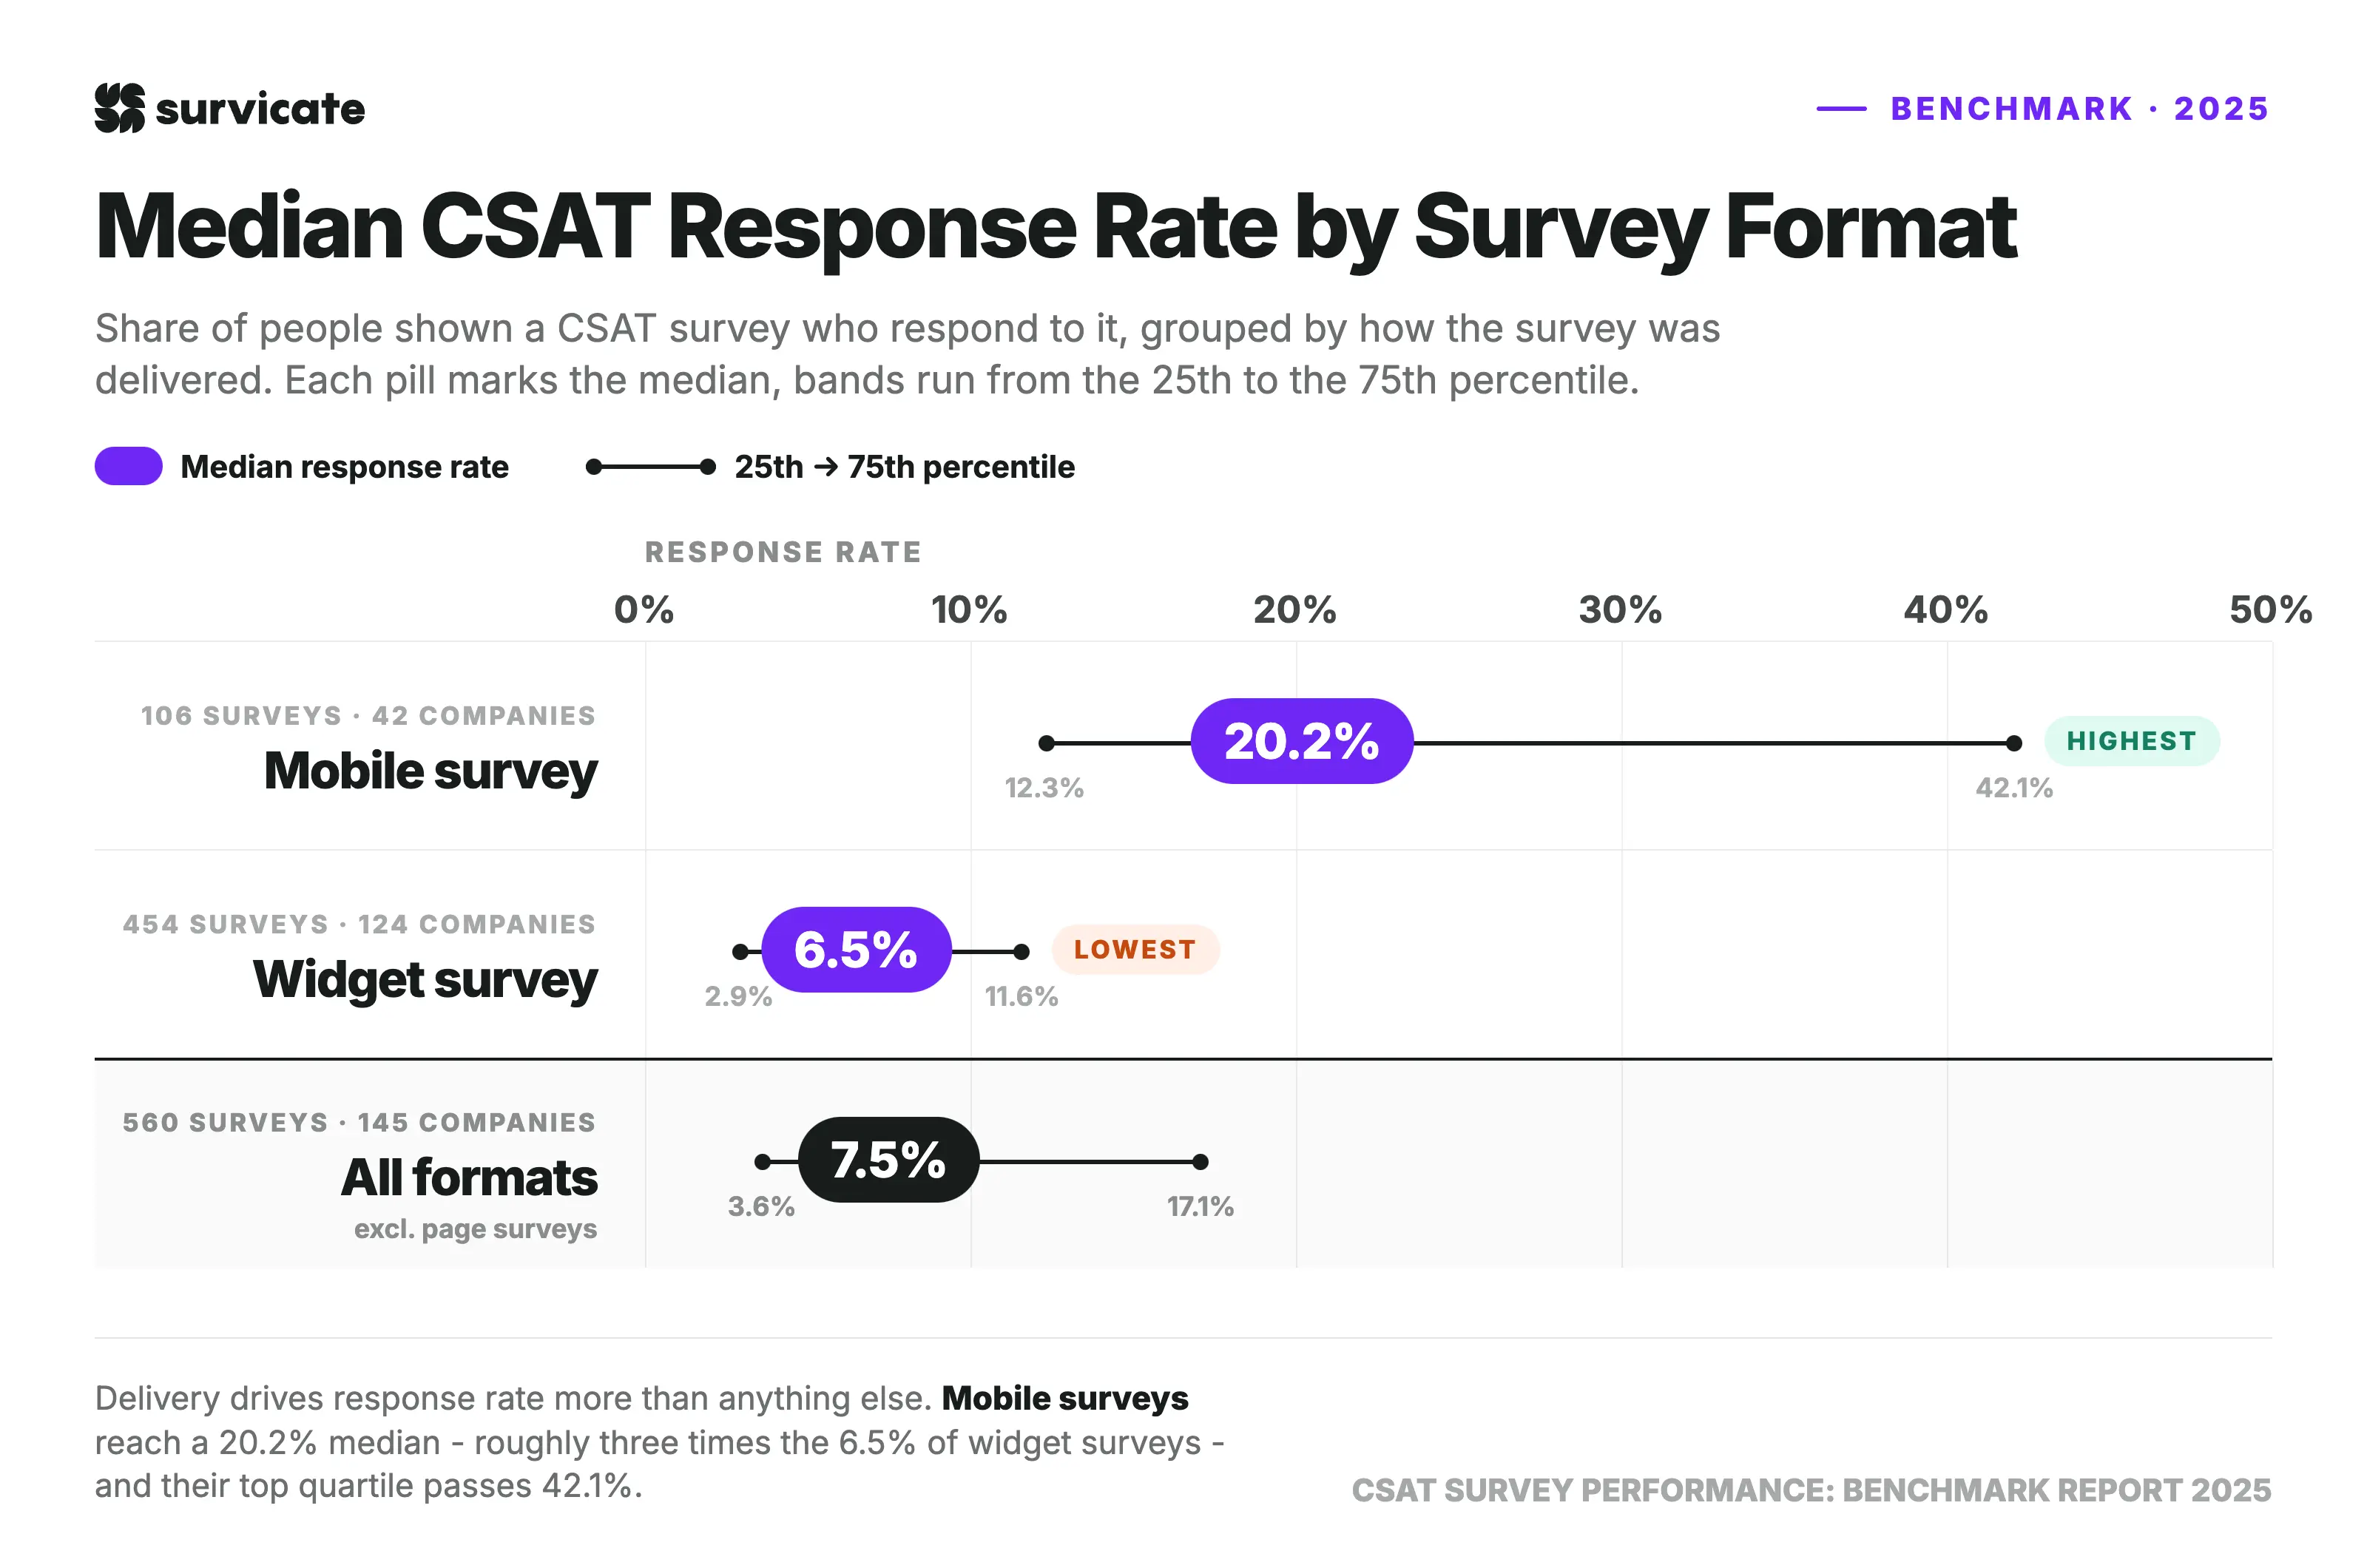
For response rates, the comparison includes only widget and mobile surveys. We decided to exclude page surveys because their view count is measured differently, making a direct comparison unreliable.
Among the remaining formats, mobile surveys achieve a median response rate of 20.2%, compared to 6.5% for widget surveys. Mobile surveys also have a much stronger upper range, with a 75th percentile of 42.1%, indicating a much larger gap between typical and top-performing implementations.
When we look at these three results, we can see that the survey format has a strong relationship with survey performance. The same CSAT question can produce noticeably different results depending on how respondents encounter it.
Manufacturing tops industry satisfaction as SaaS holds the main benchmark
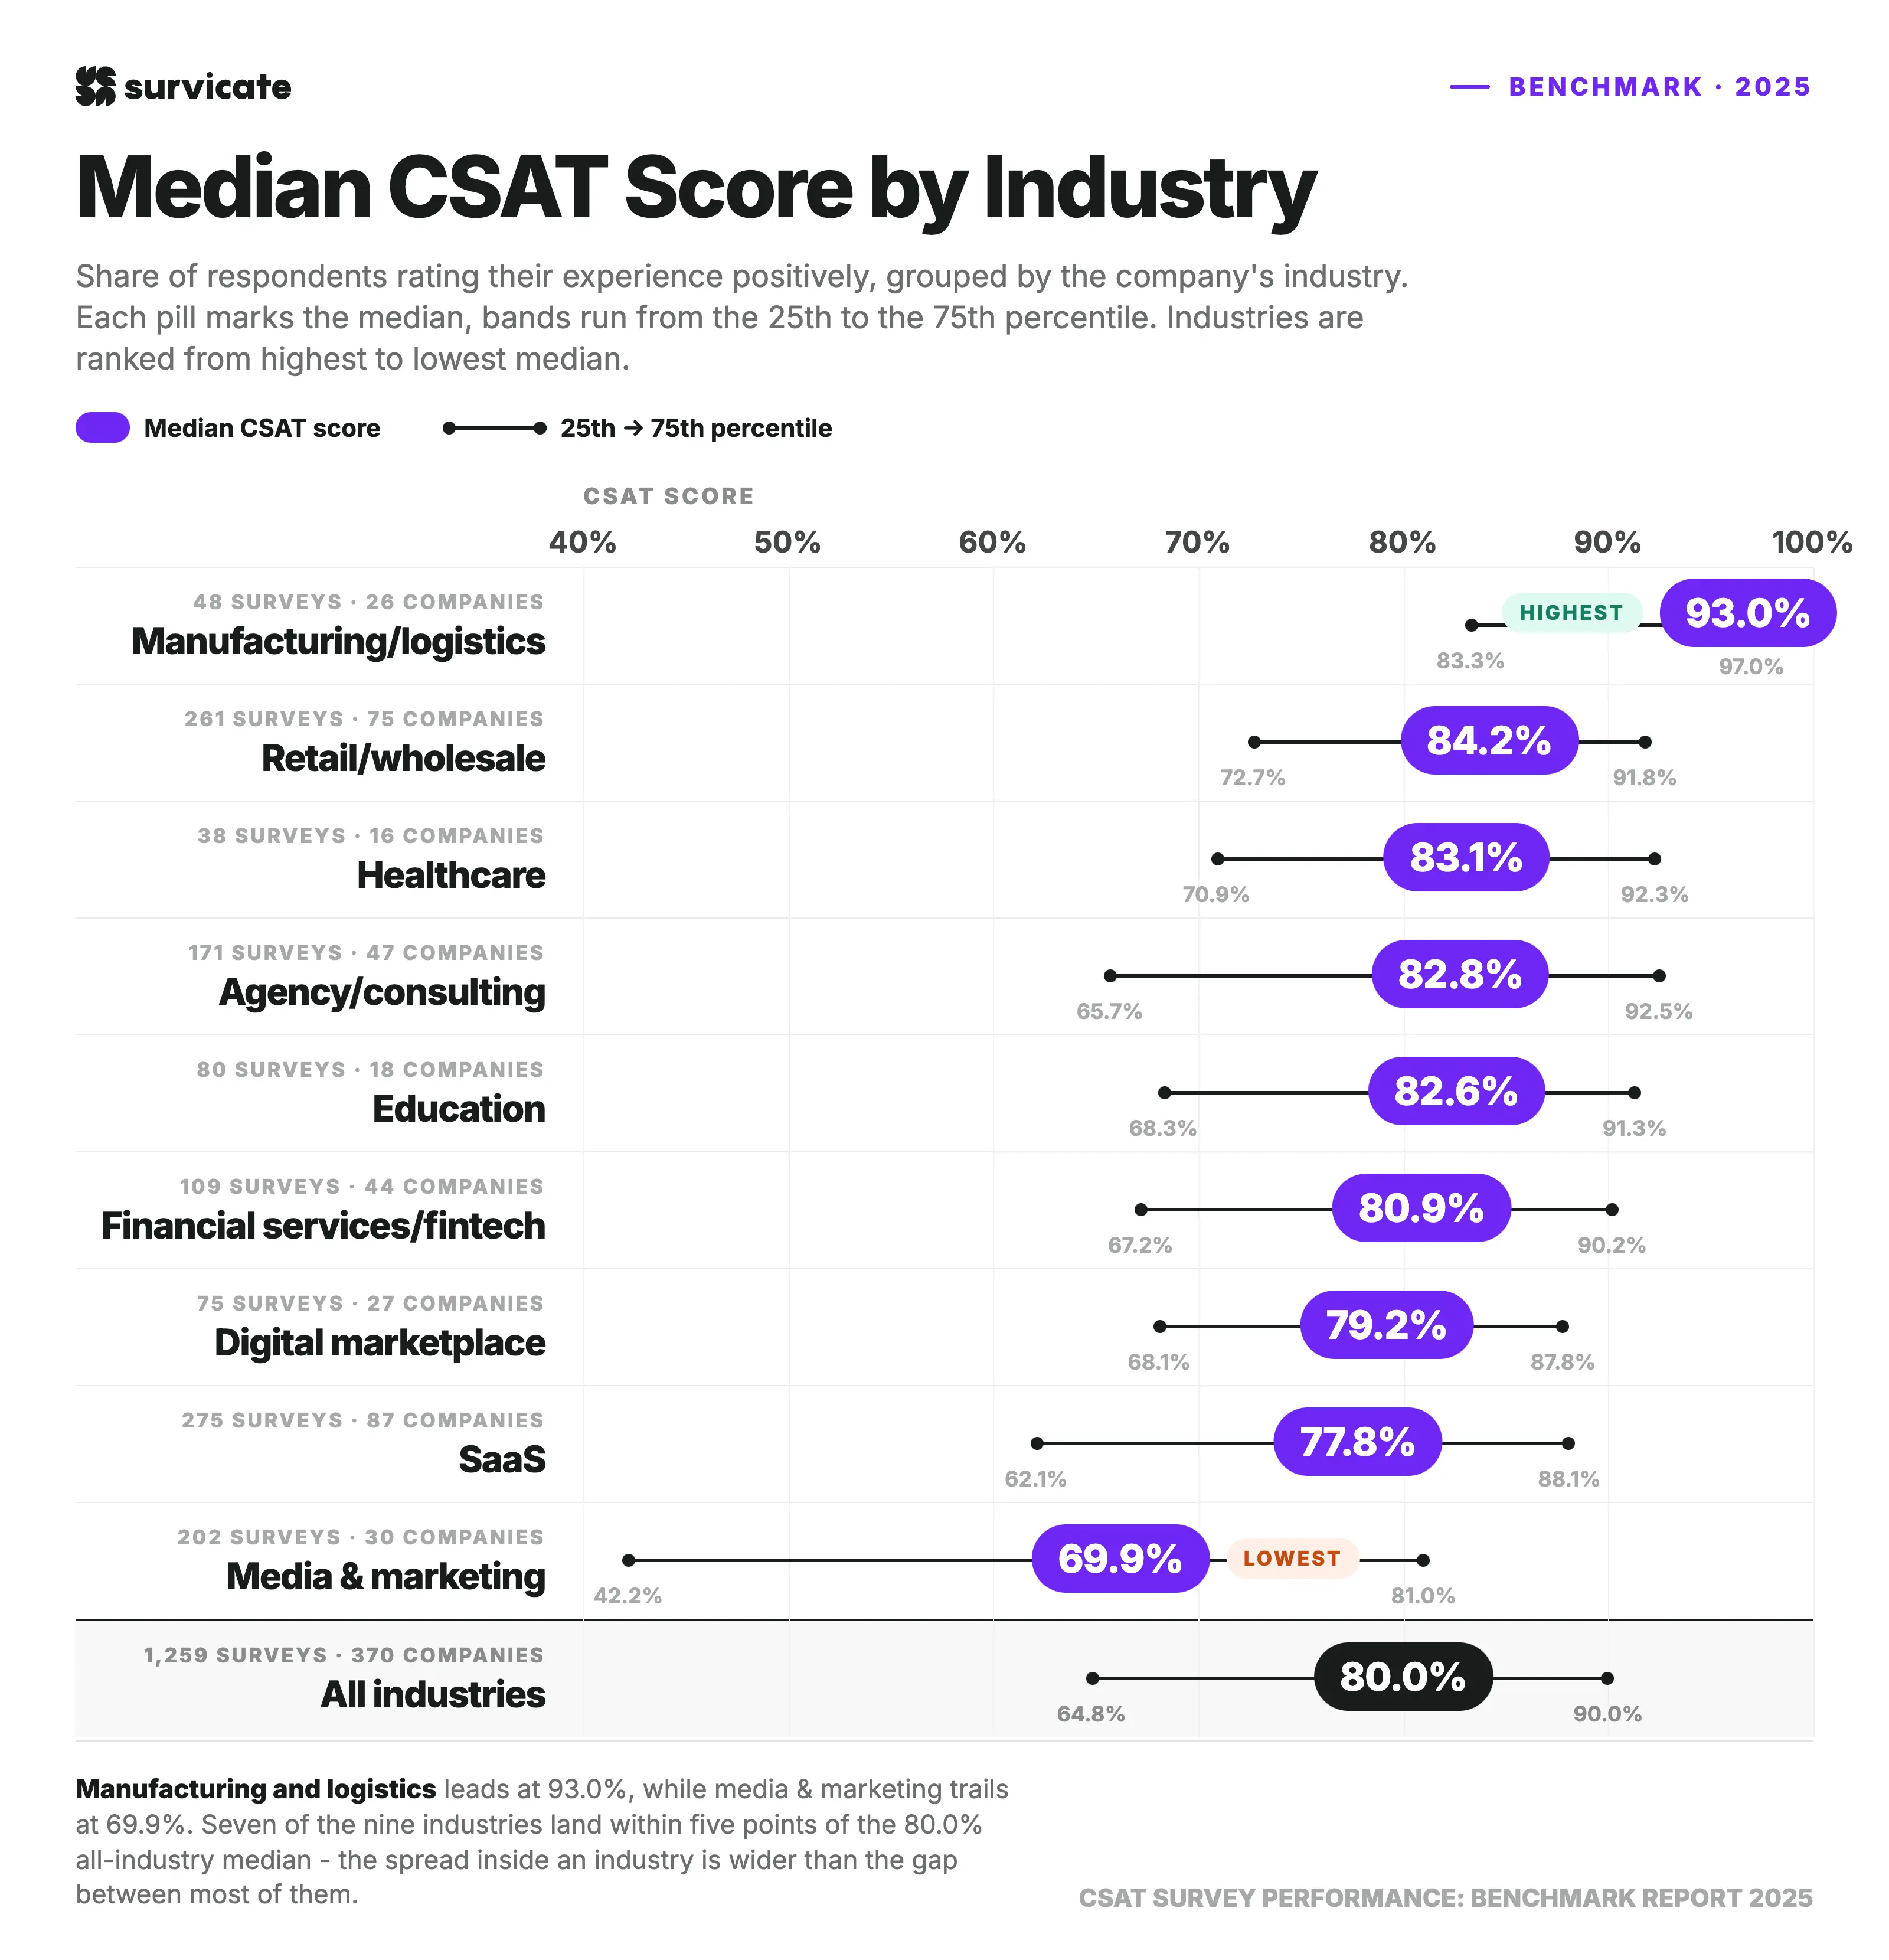
Customer satisfaction changes fast once you break down performance by market. While the overall median CSAT score hits 80.0%, individual sectors show a spread of over 23 percentage points between top and bottom performers.
Here is how scores break down across industries:
Before you evaluate your own numbers, keep sample sizes in mind. SaaS (275 surveys) and retail/wholesale (261 surveys) offer the most solid, dependable data in this report. Healthcare (38 surveys) and manufacturing/logistics (48 surveys) carry smaller sample sizes, so read those results as strong indicators rather than absolute rules.
Manufacturing and logistics posts the highest median CSAT by a wide margin at 93.0% with a tight spread (83.3% to 97.0%), though this stems from a smaller sample of 48 surveys across 26 companies.
Retail and wholesale pairs a solid 84.2% median with our second-largest sample size, giving you a reliable baseline if you sell physical goods. Meanwhile, SaaS, our largest segment at 275 surveys across 87 companies, lands slightly under the global benchmark with a 77.8% median CSAT score.
A tight cluster sits just above the 80.0% baseline, including healthcare (83.1%), agency and consulting (82.8%), and education (82.6%).
Media and marketing lands at the bottom with a 69.9% median, which is more than 10 points below the overall benchmark. This industry also shows the widest performance gap in the entire study – a massive 38.8-point split between the 25th percentile (42.2%) and the 75th percentile (81.0%).
Agency and fintech teams lead survey completion as marketplaces fall behind
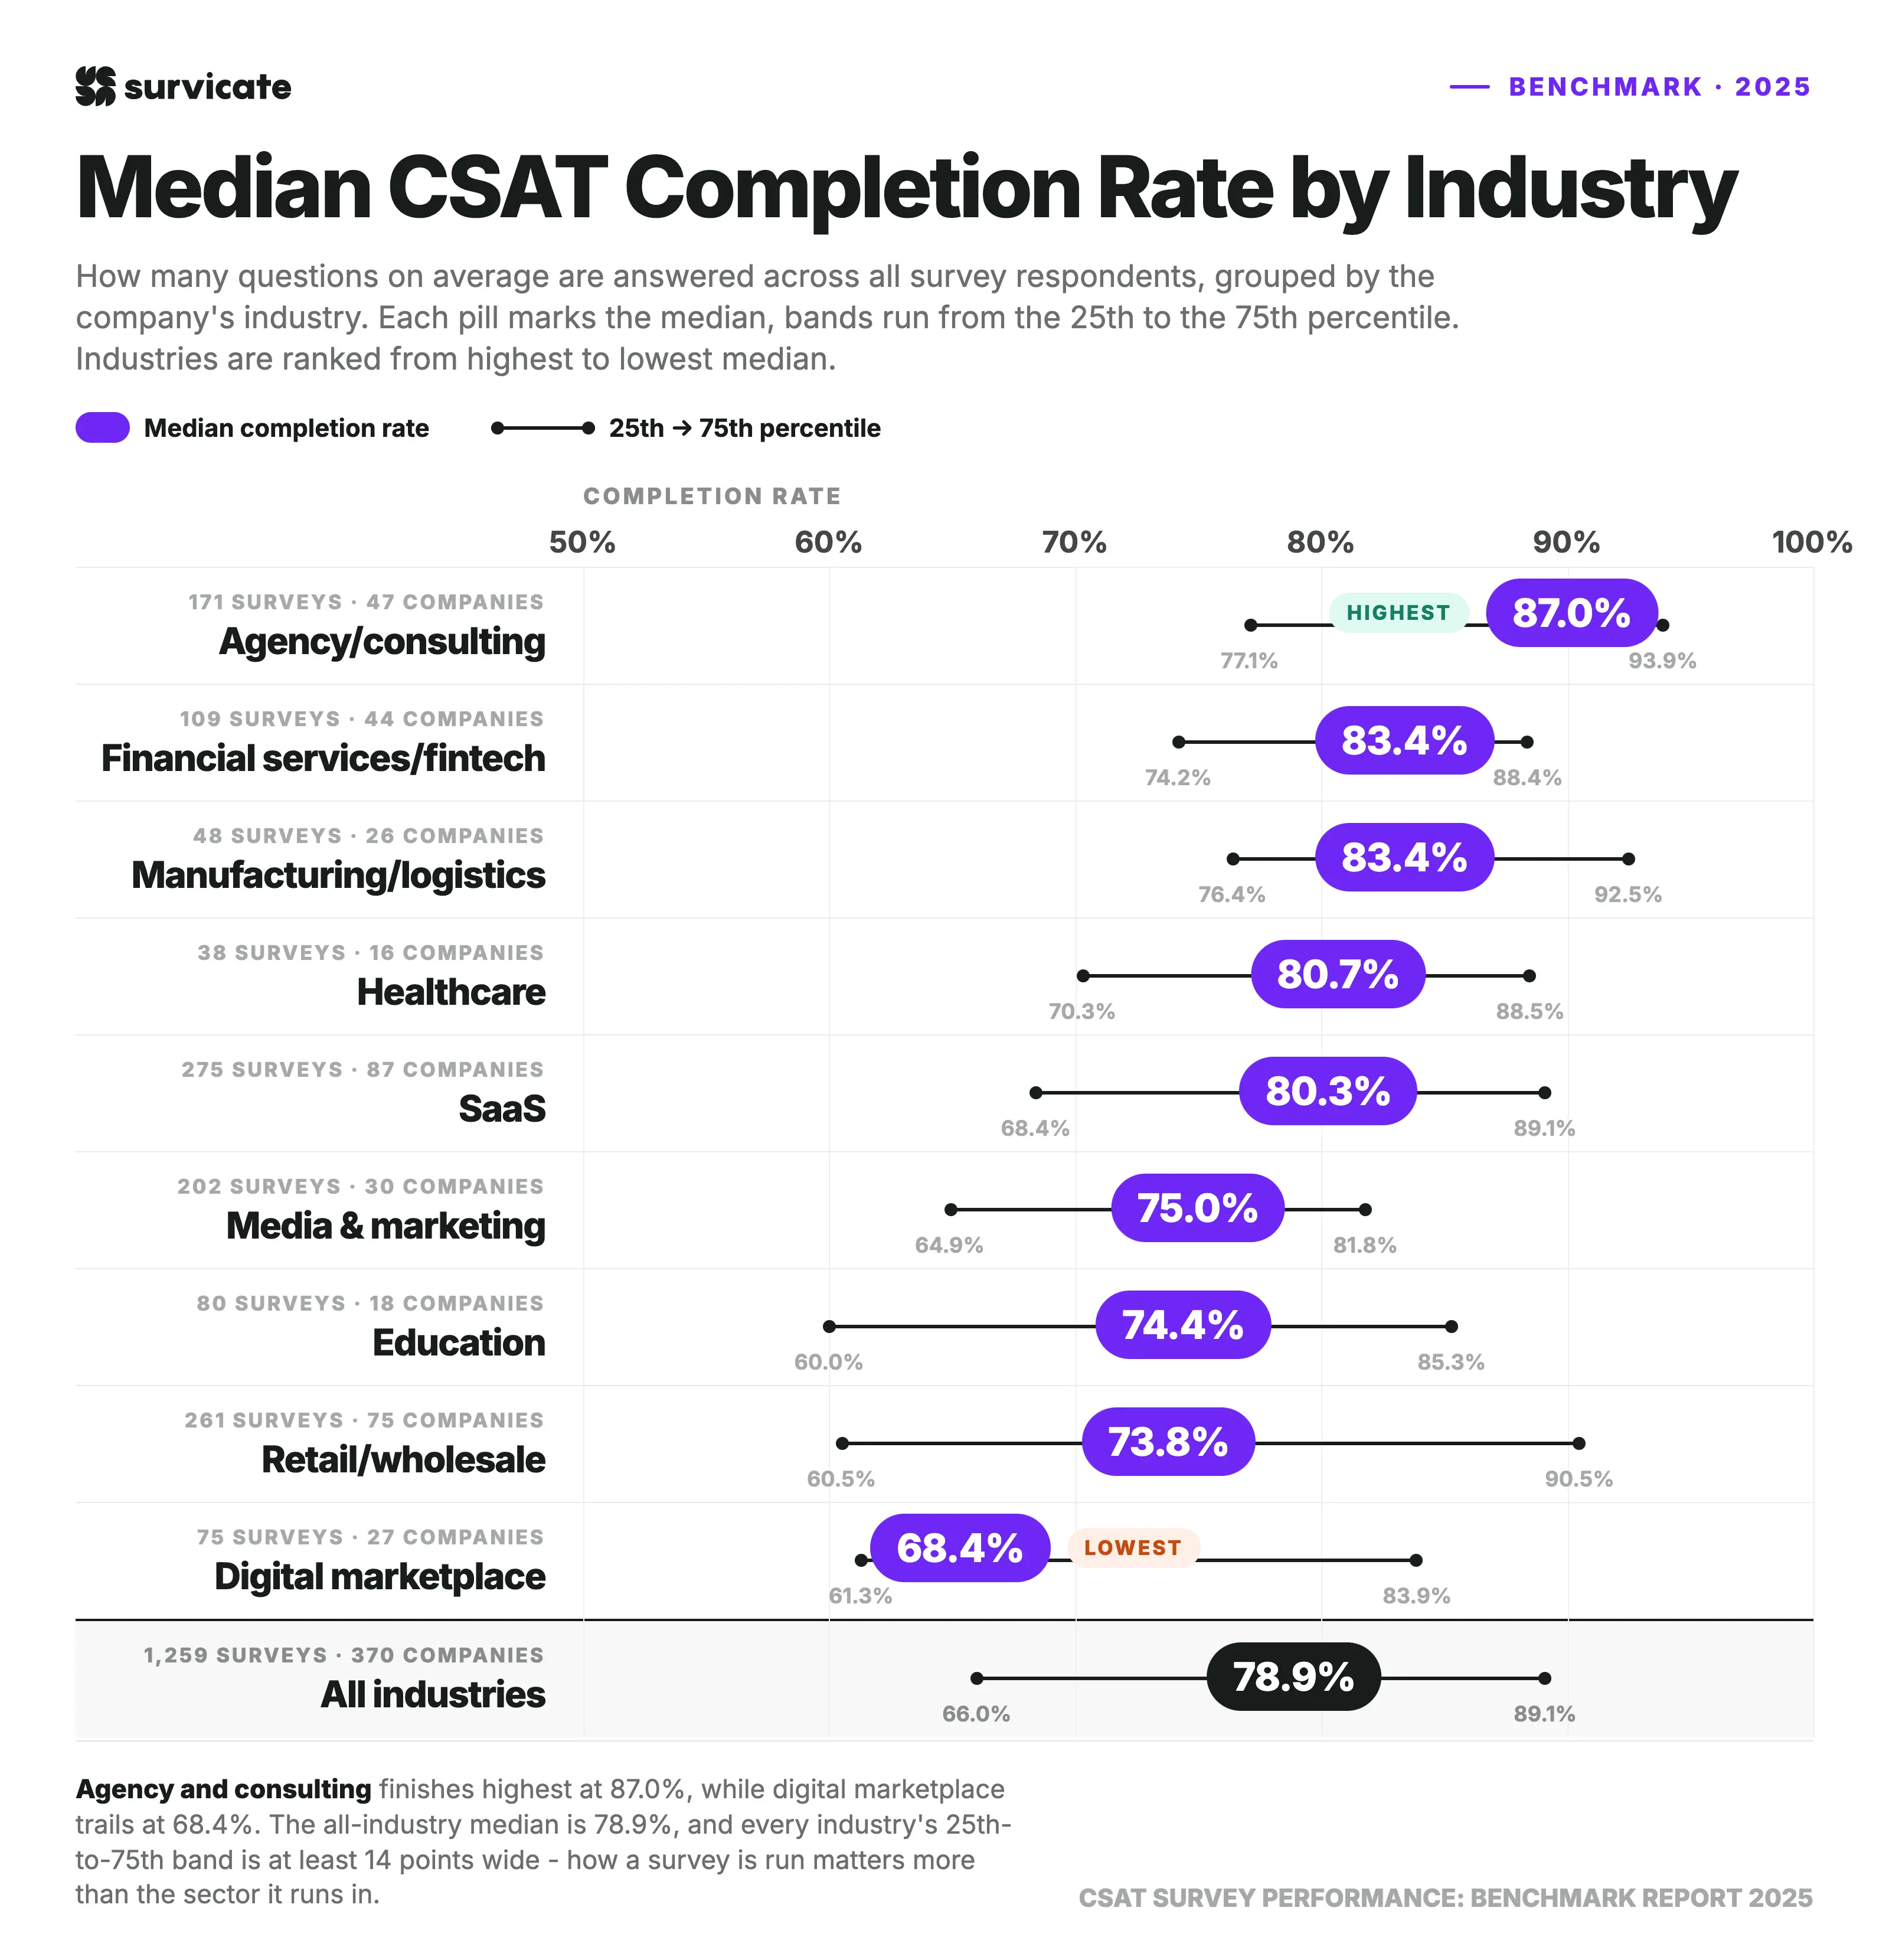
A high response rate matters, but people still need to finish the survey once they start. Across all 1,259 surveys, the median completion rate sits at 78.9%, though results shift strongly depending on your industry.
Here is how completion rates break down across sectors:
Agency and consulting leads all sectors with an 87.0% median completion rate. The sector shows impressive consistency, too. The middle 50% of surveys fall in a tight range between 77.1% and 93.9%.
Financial services (83.4%) and manufacturing/logistics (83.4%) sit tied in second place. Manufacturing displays the tighter spread of the two, with scores spanning 76.4% to 92.5%. Healthcare (80.7%) and SaaS (80.3%) both sit just above the global 78.9% benchmark.
At the bottom end, digital marketplaces post the lowest median completion rate at 68.4%. More than 10 points under the overall average, alongside a wide spread from 61.3% to 83.9%.
Retail and wholesale presents the most interesting disconnect in our research. The sector boasts a strong median CSAT score of 84.2%, yet its completion rate dips well below benchmark at 73.8% across a massive sample of 261 surveys. High satisfaction score and strong survey completion do not always move together.
Business model has little impact on CSAT or completion rates
Compared to other factors in this report, the business model shows only small differences in both CSAT and completion rates. The dataset includes 675 B2C surveys from 171 companies and 584 B2B surveys from 199 companies, which makes for a balanced basis for comparison.
B2C surveys achieve a slightly higher median CSAT score
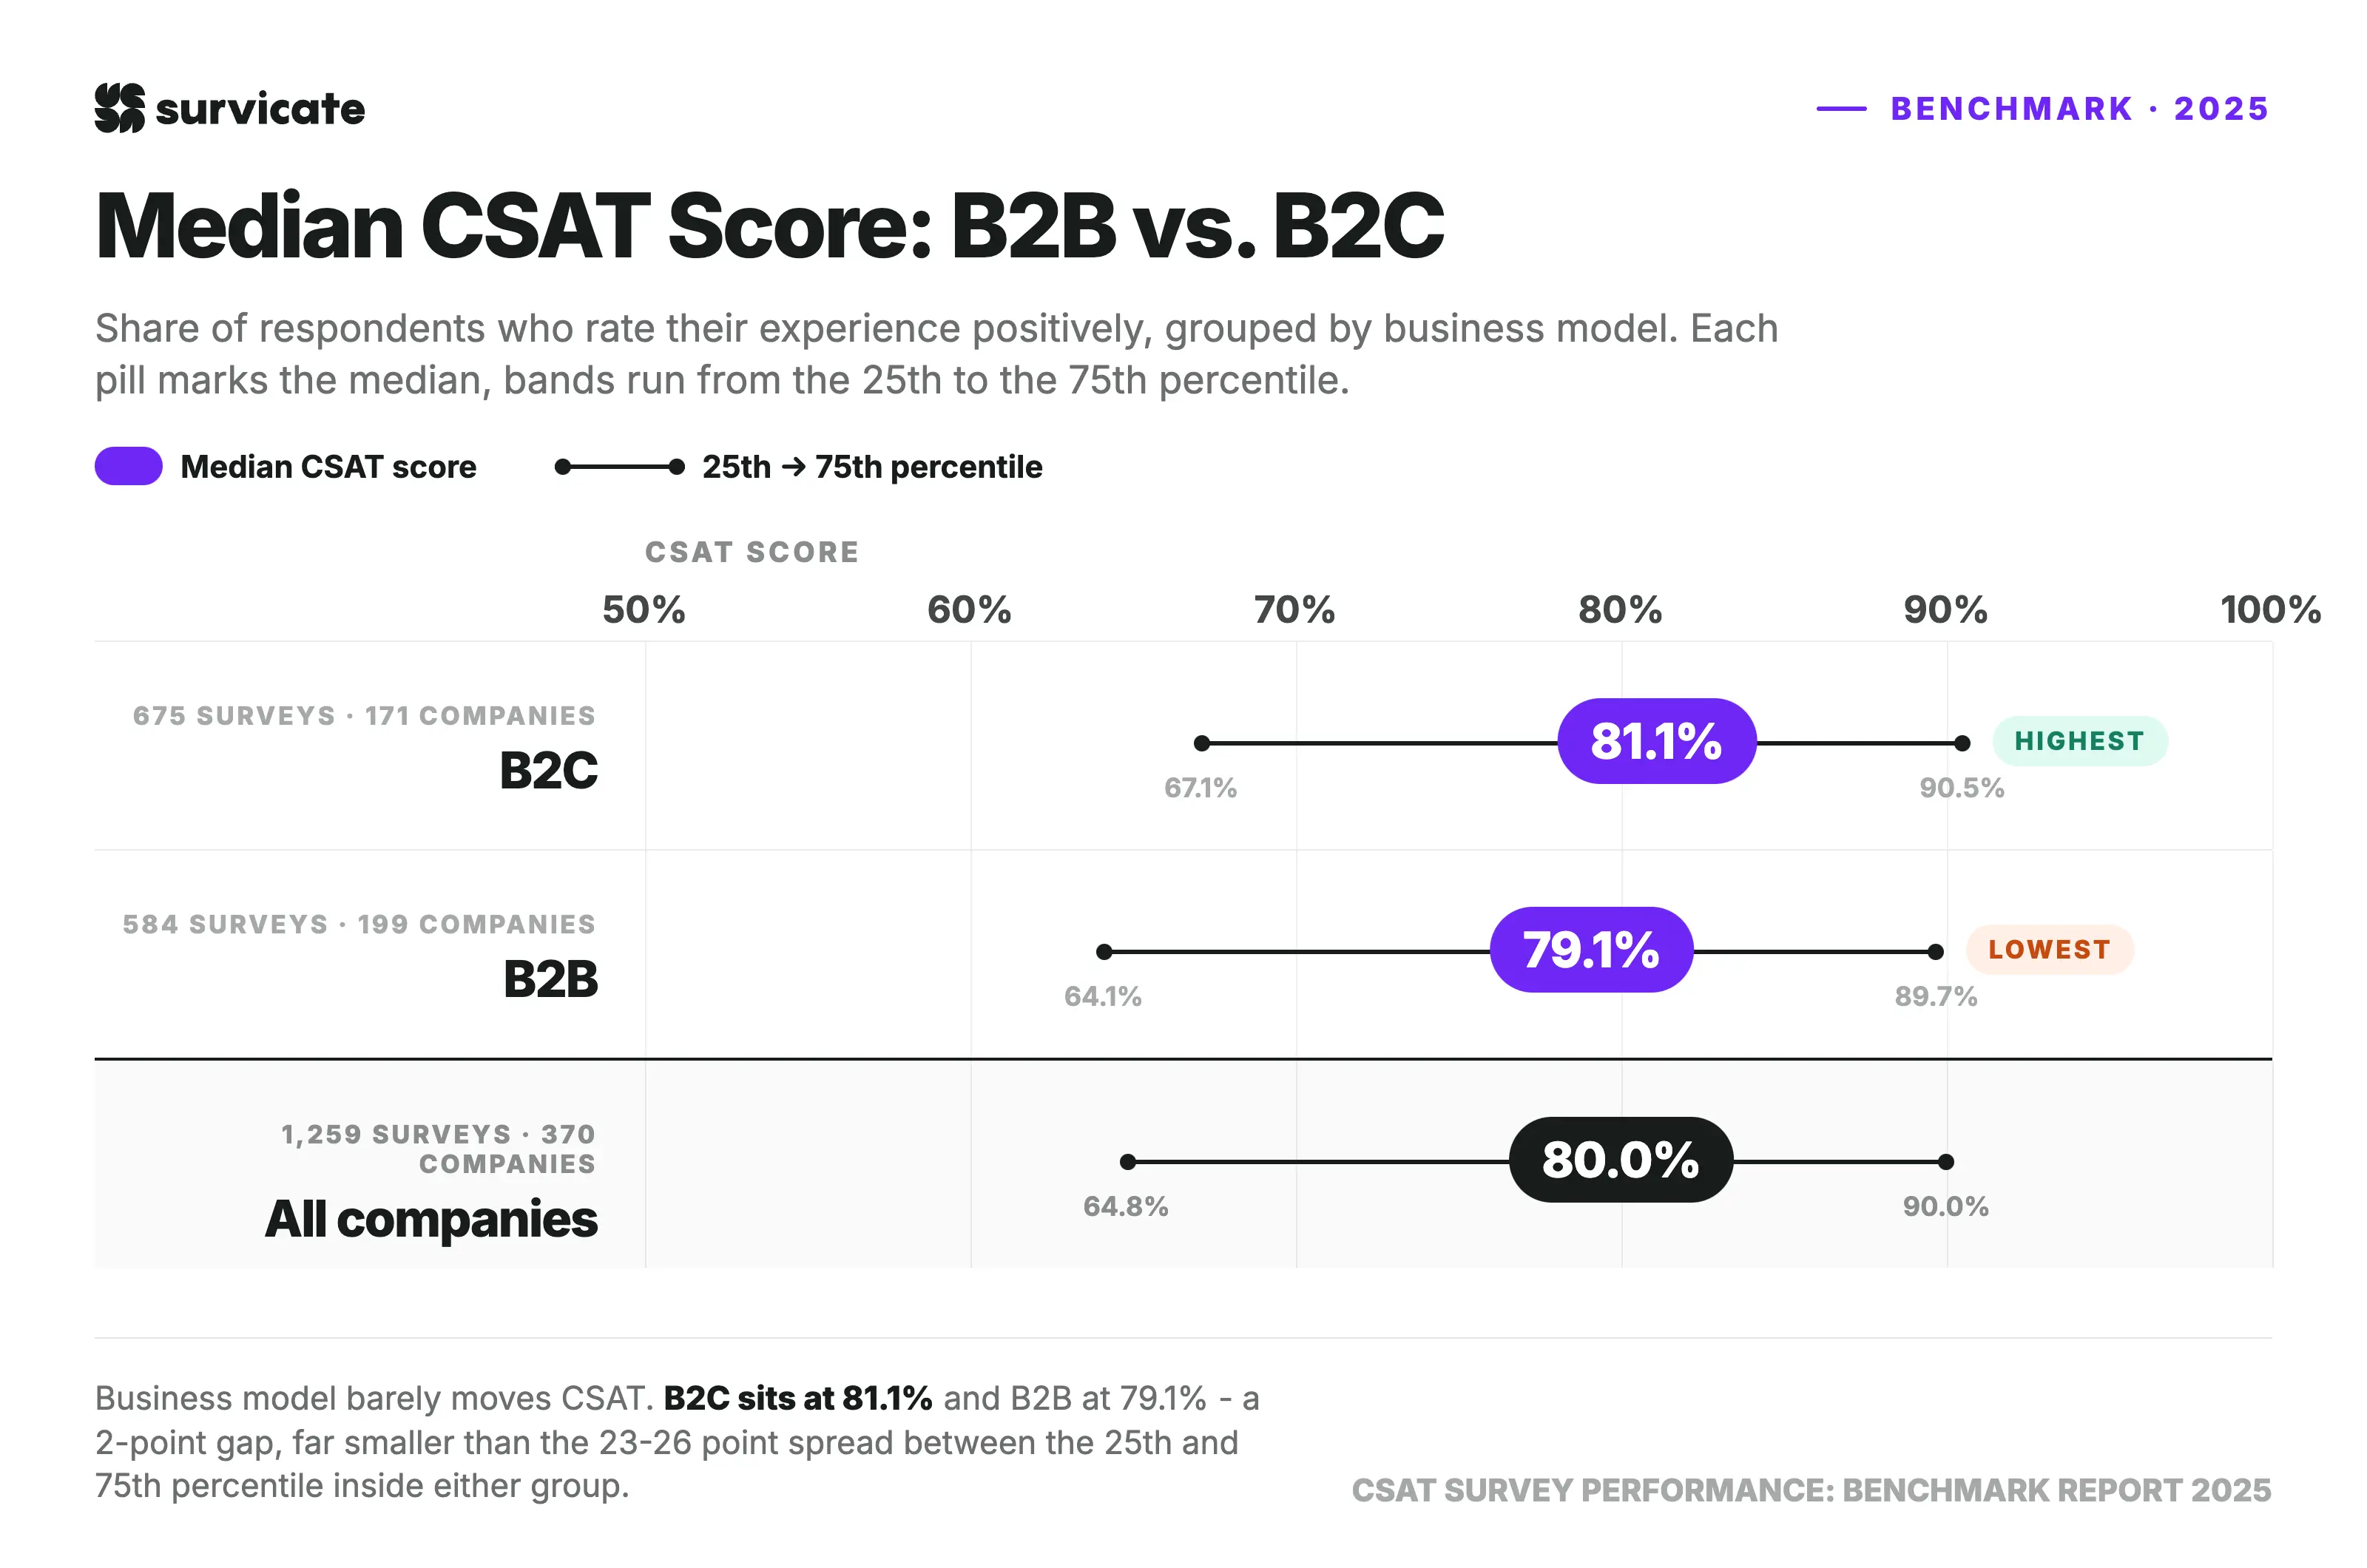
B2C surveys reach a median CSAT score of 81.1%, compared to 79.1% for B2B surveys. The two-point difference is relatively small, and the percentile ranges overlap substantially across both groups.
Completion rates remain nearly identical across business models
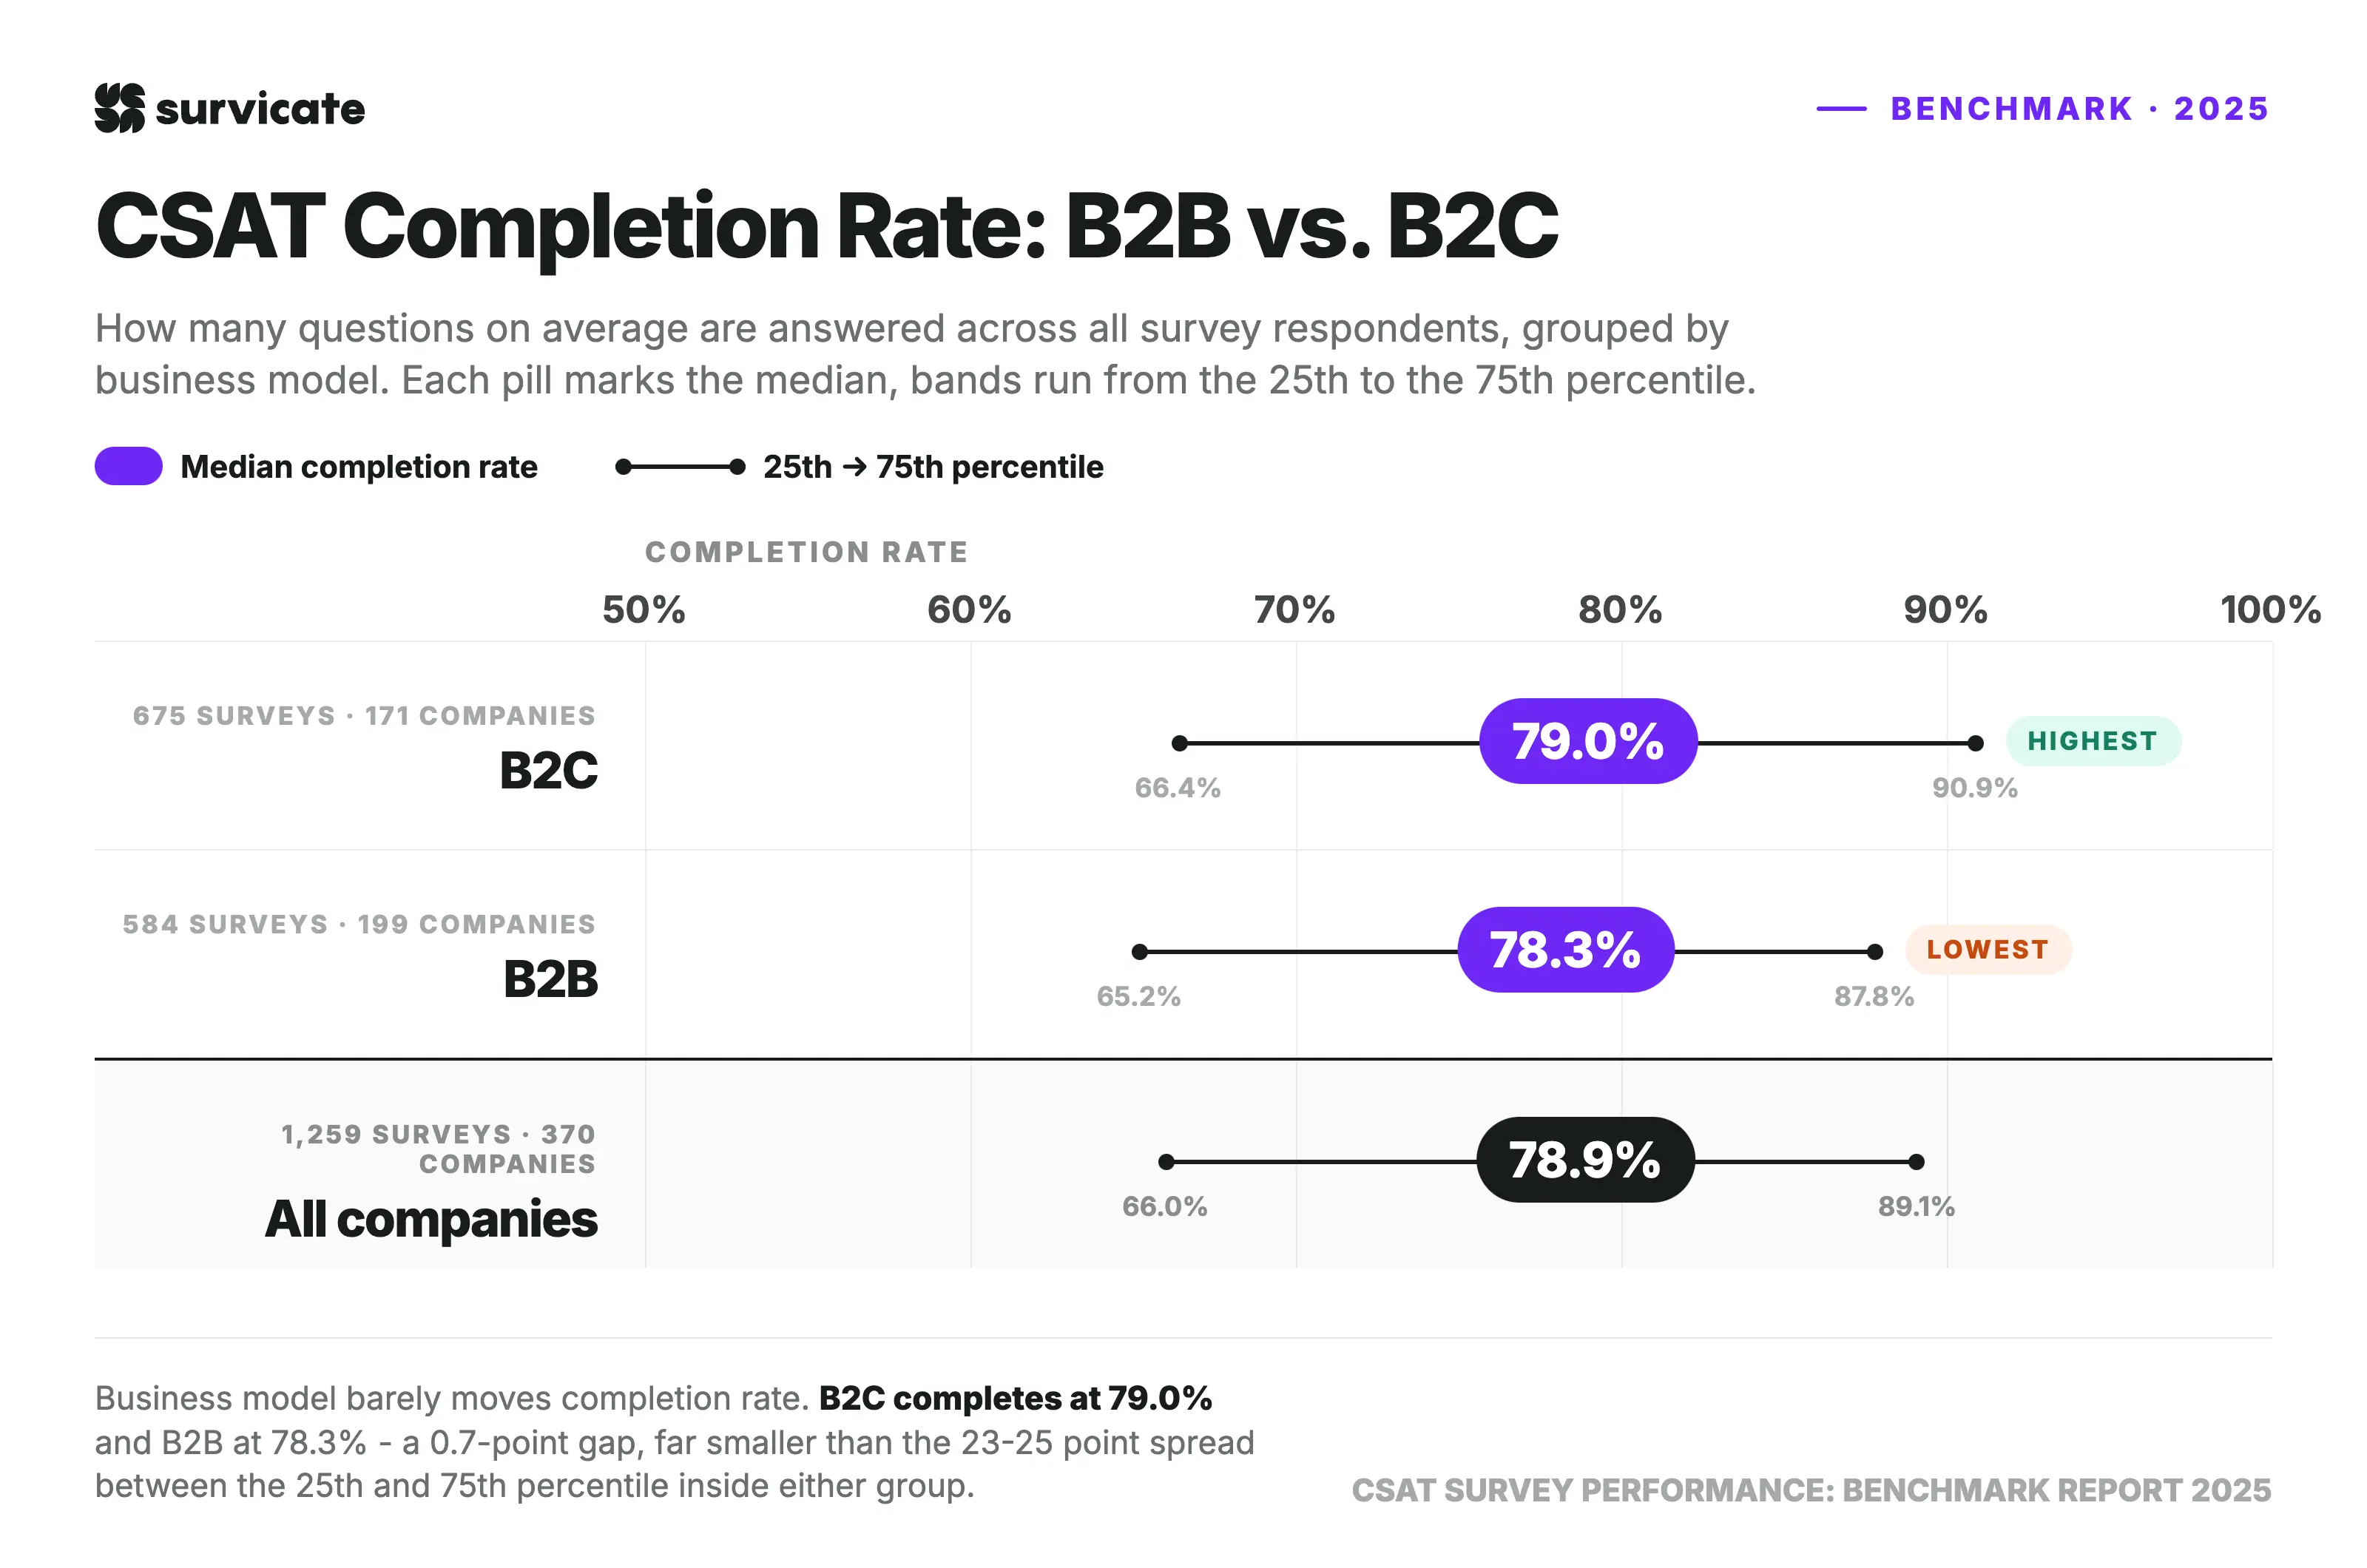
Completion rates differ even less than CSAT scores. B2C surveys record a median completion rate of 79.0%, while B2B surveys reach 78.3%. The distributions are similarly close, and the middle 50% of surveys falls within comparable ranges for both business models.
Smaller companies secure higher satisfaction than large enterprises
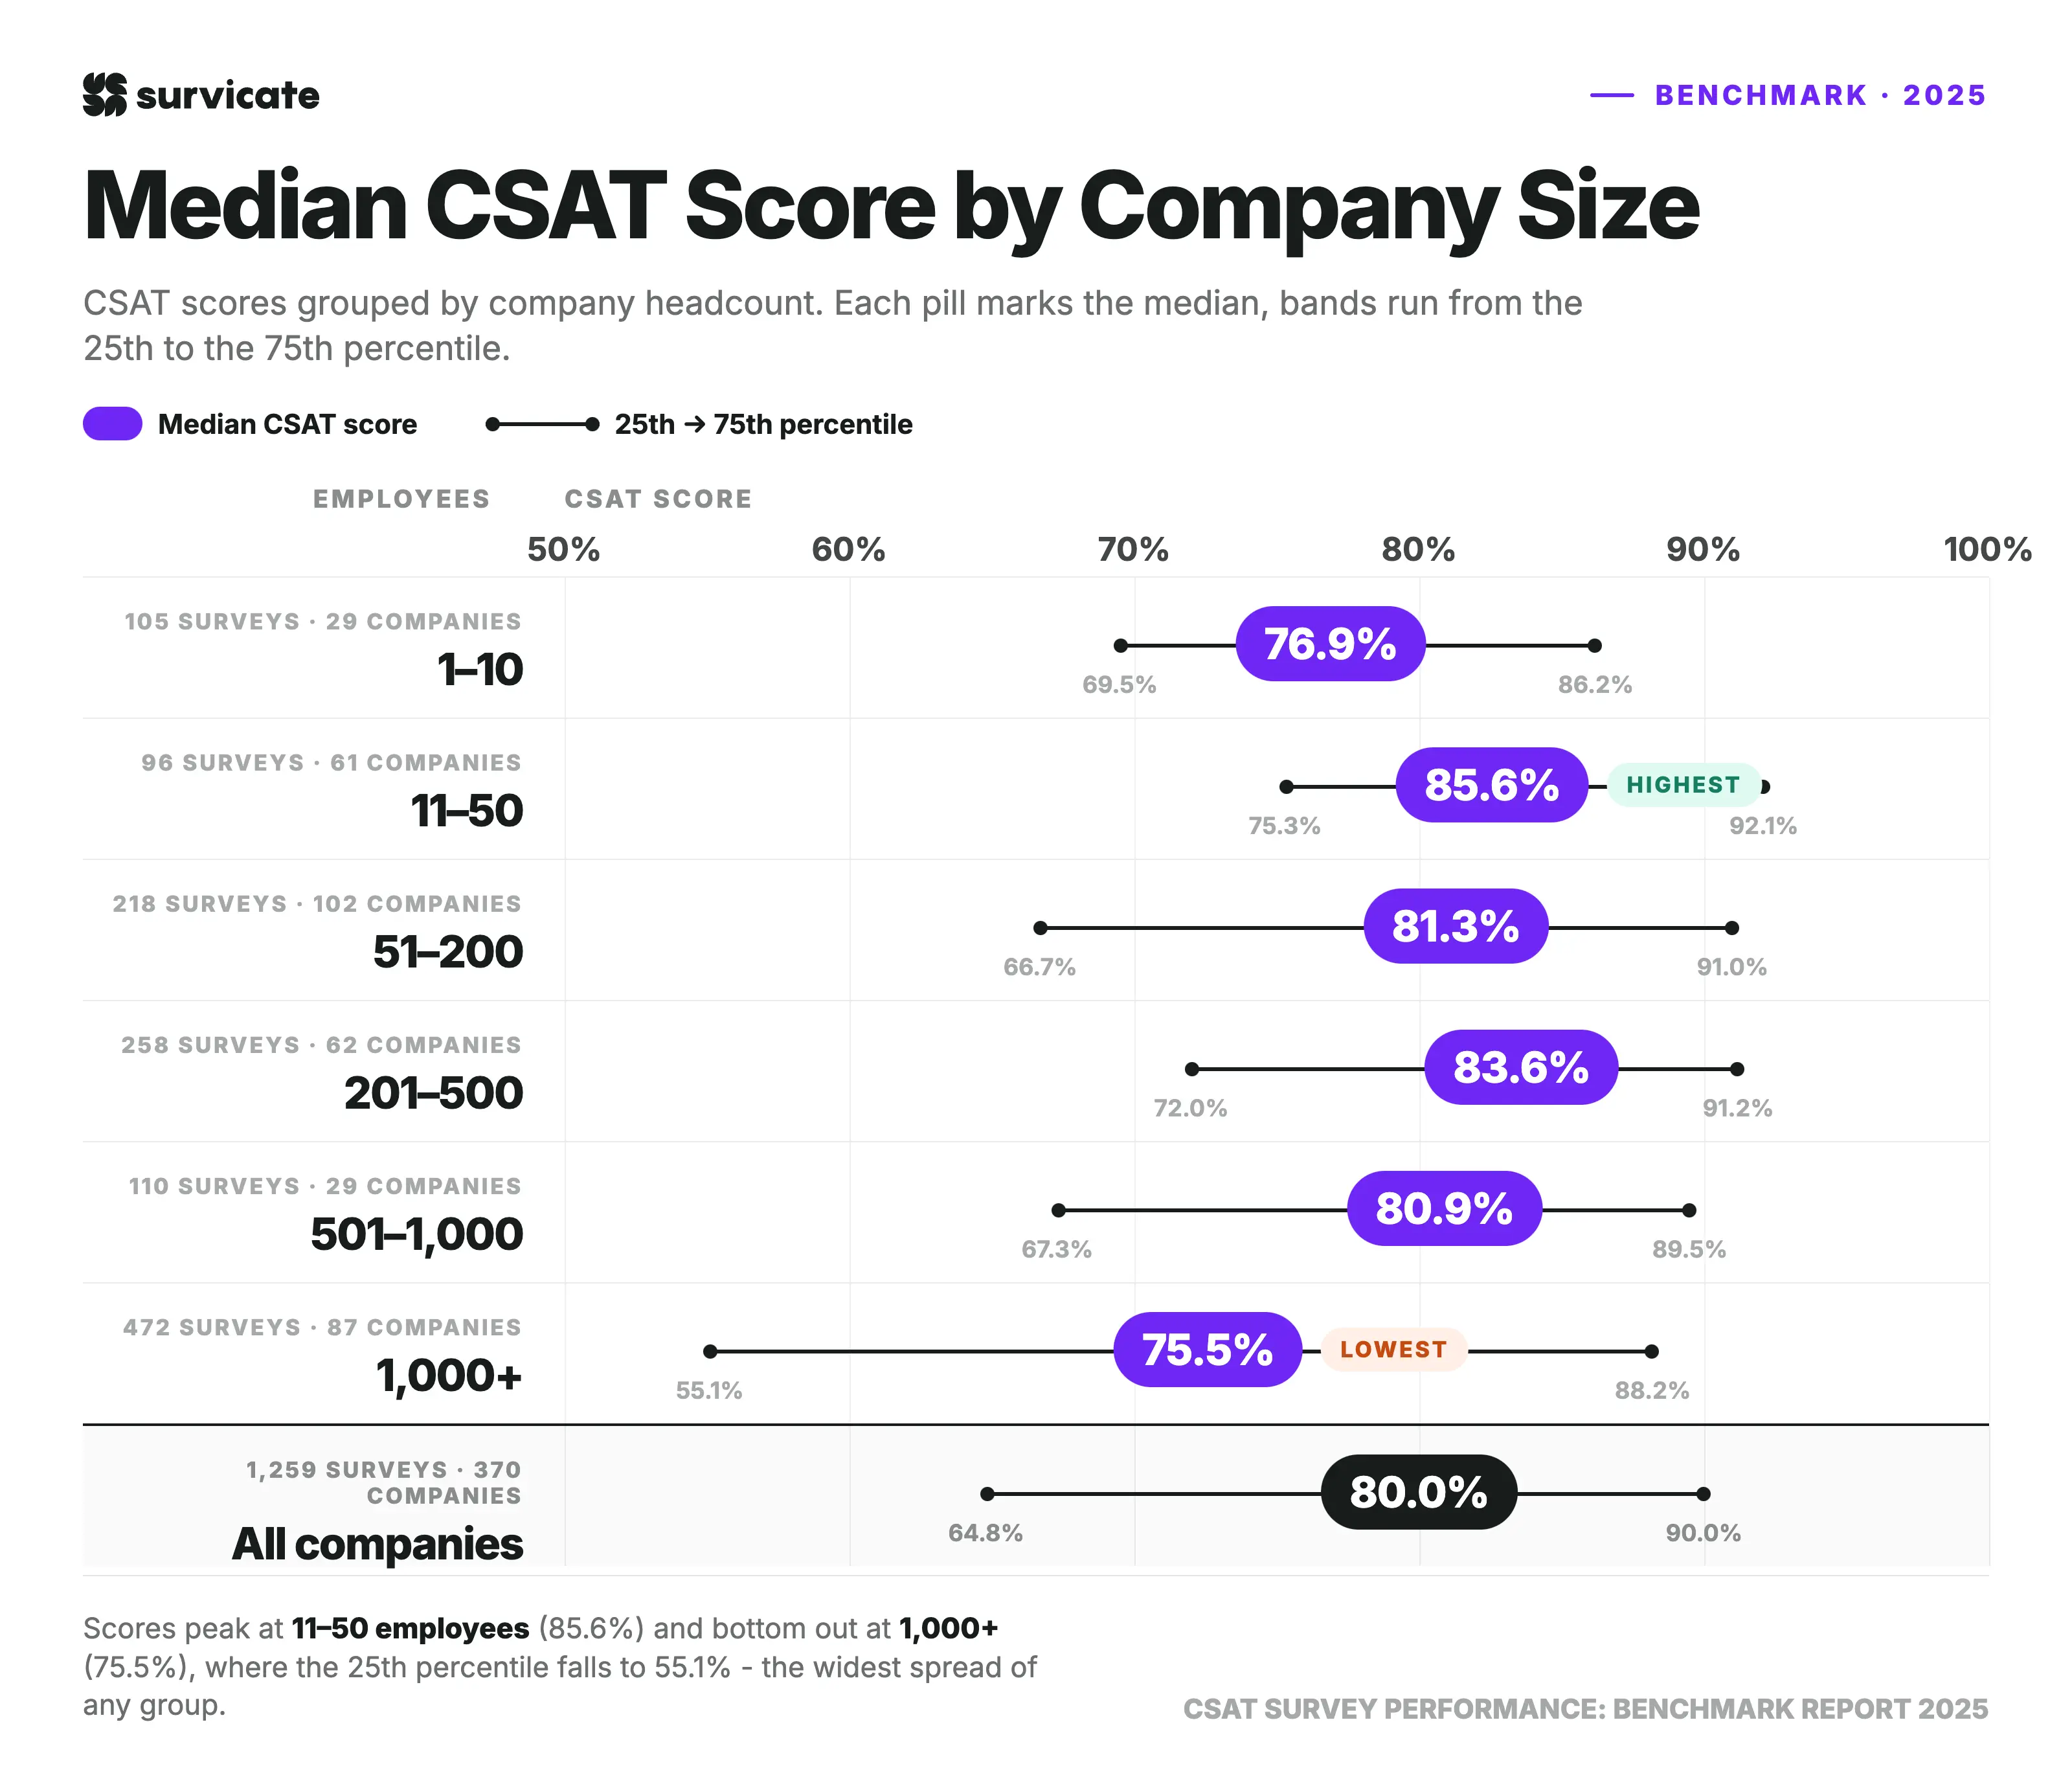
Company headcount plays a major role in customer satisfaction. Smaller, agile teams and mid-market organizations often outperform corporations when it comes to keeping customers happy.
Here is how CSAT scores break down across company size segments:
Teams with 11 to 50 employees post the highest median CSAT at 85.6% – more than 5 percentage points above the overall benchmark. Their middle 50% stays very consistent too, ranging between 75.3% and 92.1%.
Mid-market organizations also stay strong above the global baseline. Companies with 51 to 200 employees hit an 81.3% median, while those with 201 to 500 employees reach 83.6%.
The smallest businesses (1 to 10 employees) sit under the benchmark at 76.9%. Keep in mind that this data comes from 105 surveys across just 29 companies, so view this specific sample as an indicator.
Enterprises (1,000+ employees) post the lowest median CSAT at 75.5%. Nearly 5 points below the global average. They also carry the widest spread in our study: a 33.1-point gap between the 25th percentile (55.1%) and the 75th percentile (88.2%). Satisfaction outcomes at large companies vary far more than anywhere else.
Enterprise counts as our largest segment by volume, representing 472 surveys and 37.5% of the total dataset. That heavy weighting means lower enterprise scores pull down the overall global median.
FAQ
What is a good CSAT score?
A good CSAT score sits at 80.0%, based on a median across 1,259 surveys from 370 companies. If your score clears 90.0%, performance lands in the top quarter of all benchmarked organizations. A score under 64.8% places your result in the bottom quarter.
Is a 95% CSAT score good?
Yes, a 95% CSAT score puts you well inside the top quartile across every industry and company size breakdown in our research. One caveat to keep in mind – check your response rate alongside a high score. An exceptionally high rating paired with a very low response rate often means only your most enthusiastic customers choose to reply.
What is the 5-point CSAT scale?
The 5-point scale represents the rating options (1 through 5) that respondents see on a screen. In practice, 80.6% of CSAT surveys use this 5-point format. The final CSAT score itself is a percentage, calculated by taking the total number of respondents who selected a 4 or 5 and dividing that by the total number of survey responses.
What is a good CSAT survey response rate?
The median CSAT survey response rate is 7.5%. CSAT surveys in the top quarter reach response rates above 17.1% (based on 560 surveys across 145 companies, excluding page/shareable link surveys).
What is a good CSAT survey completion rate?
The median CSAT survey completion rate is 78.9%. Top-performing CSAT surveys push completion rates past 89.1%.
Which industry has the highest CSAT score?
Manufacturing and logistics posts the highest median CSAT score at 93.0%, though this figure comes from a smaller sample size of 48 surveys. Media and marketing records the lowest industry benchmark with a median CSAT score of 69.9%.
How many questions should a CSAT survey have?
Data shows that shorter surveys keep completion rates high. CSAT surveys with 2 to 3 questions achieve completion rates between 82.5% and 86.3%. Once a survey grows to 4–10 questions, completion drops to 74.2%. Keeping your CSAT survey concise directly protects your data quality.