If you’ve ever wondered how your survey performance compares to others, you’ve likely realized that "good" is a moving target. Because response rates depend so heavily on the channel you use and the questions you ask, a single average response rate rarely tells the whole story.
To help you move past the guesswork, we analyzed data from 4,332 surveys across 460 companies to establish clear, reliable benchmarks. This report breaks down response rates by survey type, delivery format, and goal, giving you a realistic baseline to measure your own performance against.
We’ve focused on revealing the hard data section by section, so you can see exactly where your engagement stands compared to current industry standards.
Methodology
Here are the steps we took in our analysis to make sure the data is as objective and reliable as possible:
- To ensure that the data is fresh, we analyzed surveys conducted throughout the full 2025 calendar year only.
- We only included surveys with 30+ responses to minimize the margin of error and avoid volatility from small sample sizes.
- For statistical relevance, we only analyzed data where we had at least 8 unique companies.
- We have excluded link surveys. Link surveys have their own dedicated web page and may appear linked in social apps/channels or embedded in emails. Because of the various 3rd party channels, we cannot accurately measure the response rate for this survey format. In addition, the typical audience for link surveys is self-selecting and would therefore naturally skew the total median towards higher response rates.
- We report median scores and percentiles rather than averages. The median is more reliable because it is less affected by extreme outliers – a few very high or very low response rates won't skew the overall picture.
- Our analysis includes display and branch logic, meaning respondents may not have seen every question in a survey. Surveys that personalize the experience this way often see higher completion rates.
- We analyzed one-question surveys separately, as they behave differently; a respondent either completes the single question (and gets a 100% completion rate score) or they do not.
Why we decided on the >=30 threshold for survey responses
We selected a survey-level threshold of 30 or more responses after testing multiple cutoffs across our full benchmark dataset. Our goal was to identify the lowest threshold that still provides a stable benchmark while preserving enough coverage across industries and survey formats.
The analysis shows that once the cutoff reaches 30 responses, the median response rate begins to stabilise more gradually. At the same time, higher thresholds substantially reduce the number of included surveys and companies. Selecting 30 responses therefore provides a practical balance between benchmark stability and dataset coverage.
The core calculations we used in our analysis
To make sure we were looking at cohesive data, we only qualified a user’s action as a response if it meant:
- starting a survey, or
- clicking on the survey’s welcome screen.
Here are the remaining definitions for our calculations:
- Response rate: We divide the number of responses by the number of views and multiply by 100.
- Median response rate by group: We take the median of all individual survey-level response rates inside each valid group.
- Percentiles by group: We calculate the distribution of survey-level response rates within each group to show different performance levels (not just for the 50 percentile, but also at 25 and 75).
- Company count by group: We count the number of distinct organization IDs within each group.
- Survey count by group: We count the total number of unique survey IDs within each group.
Key findings
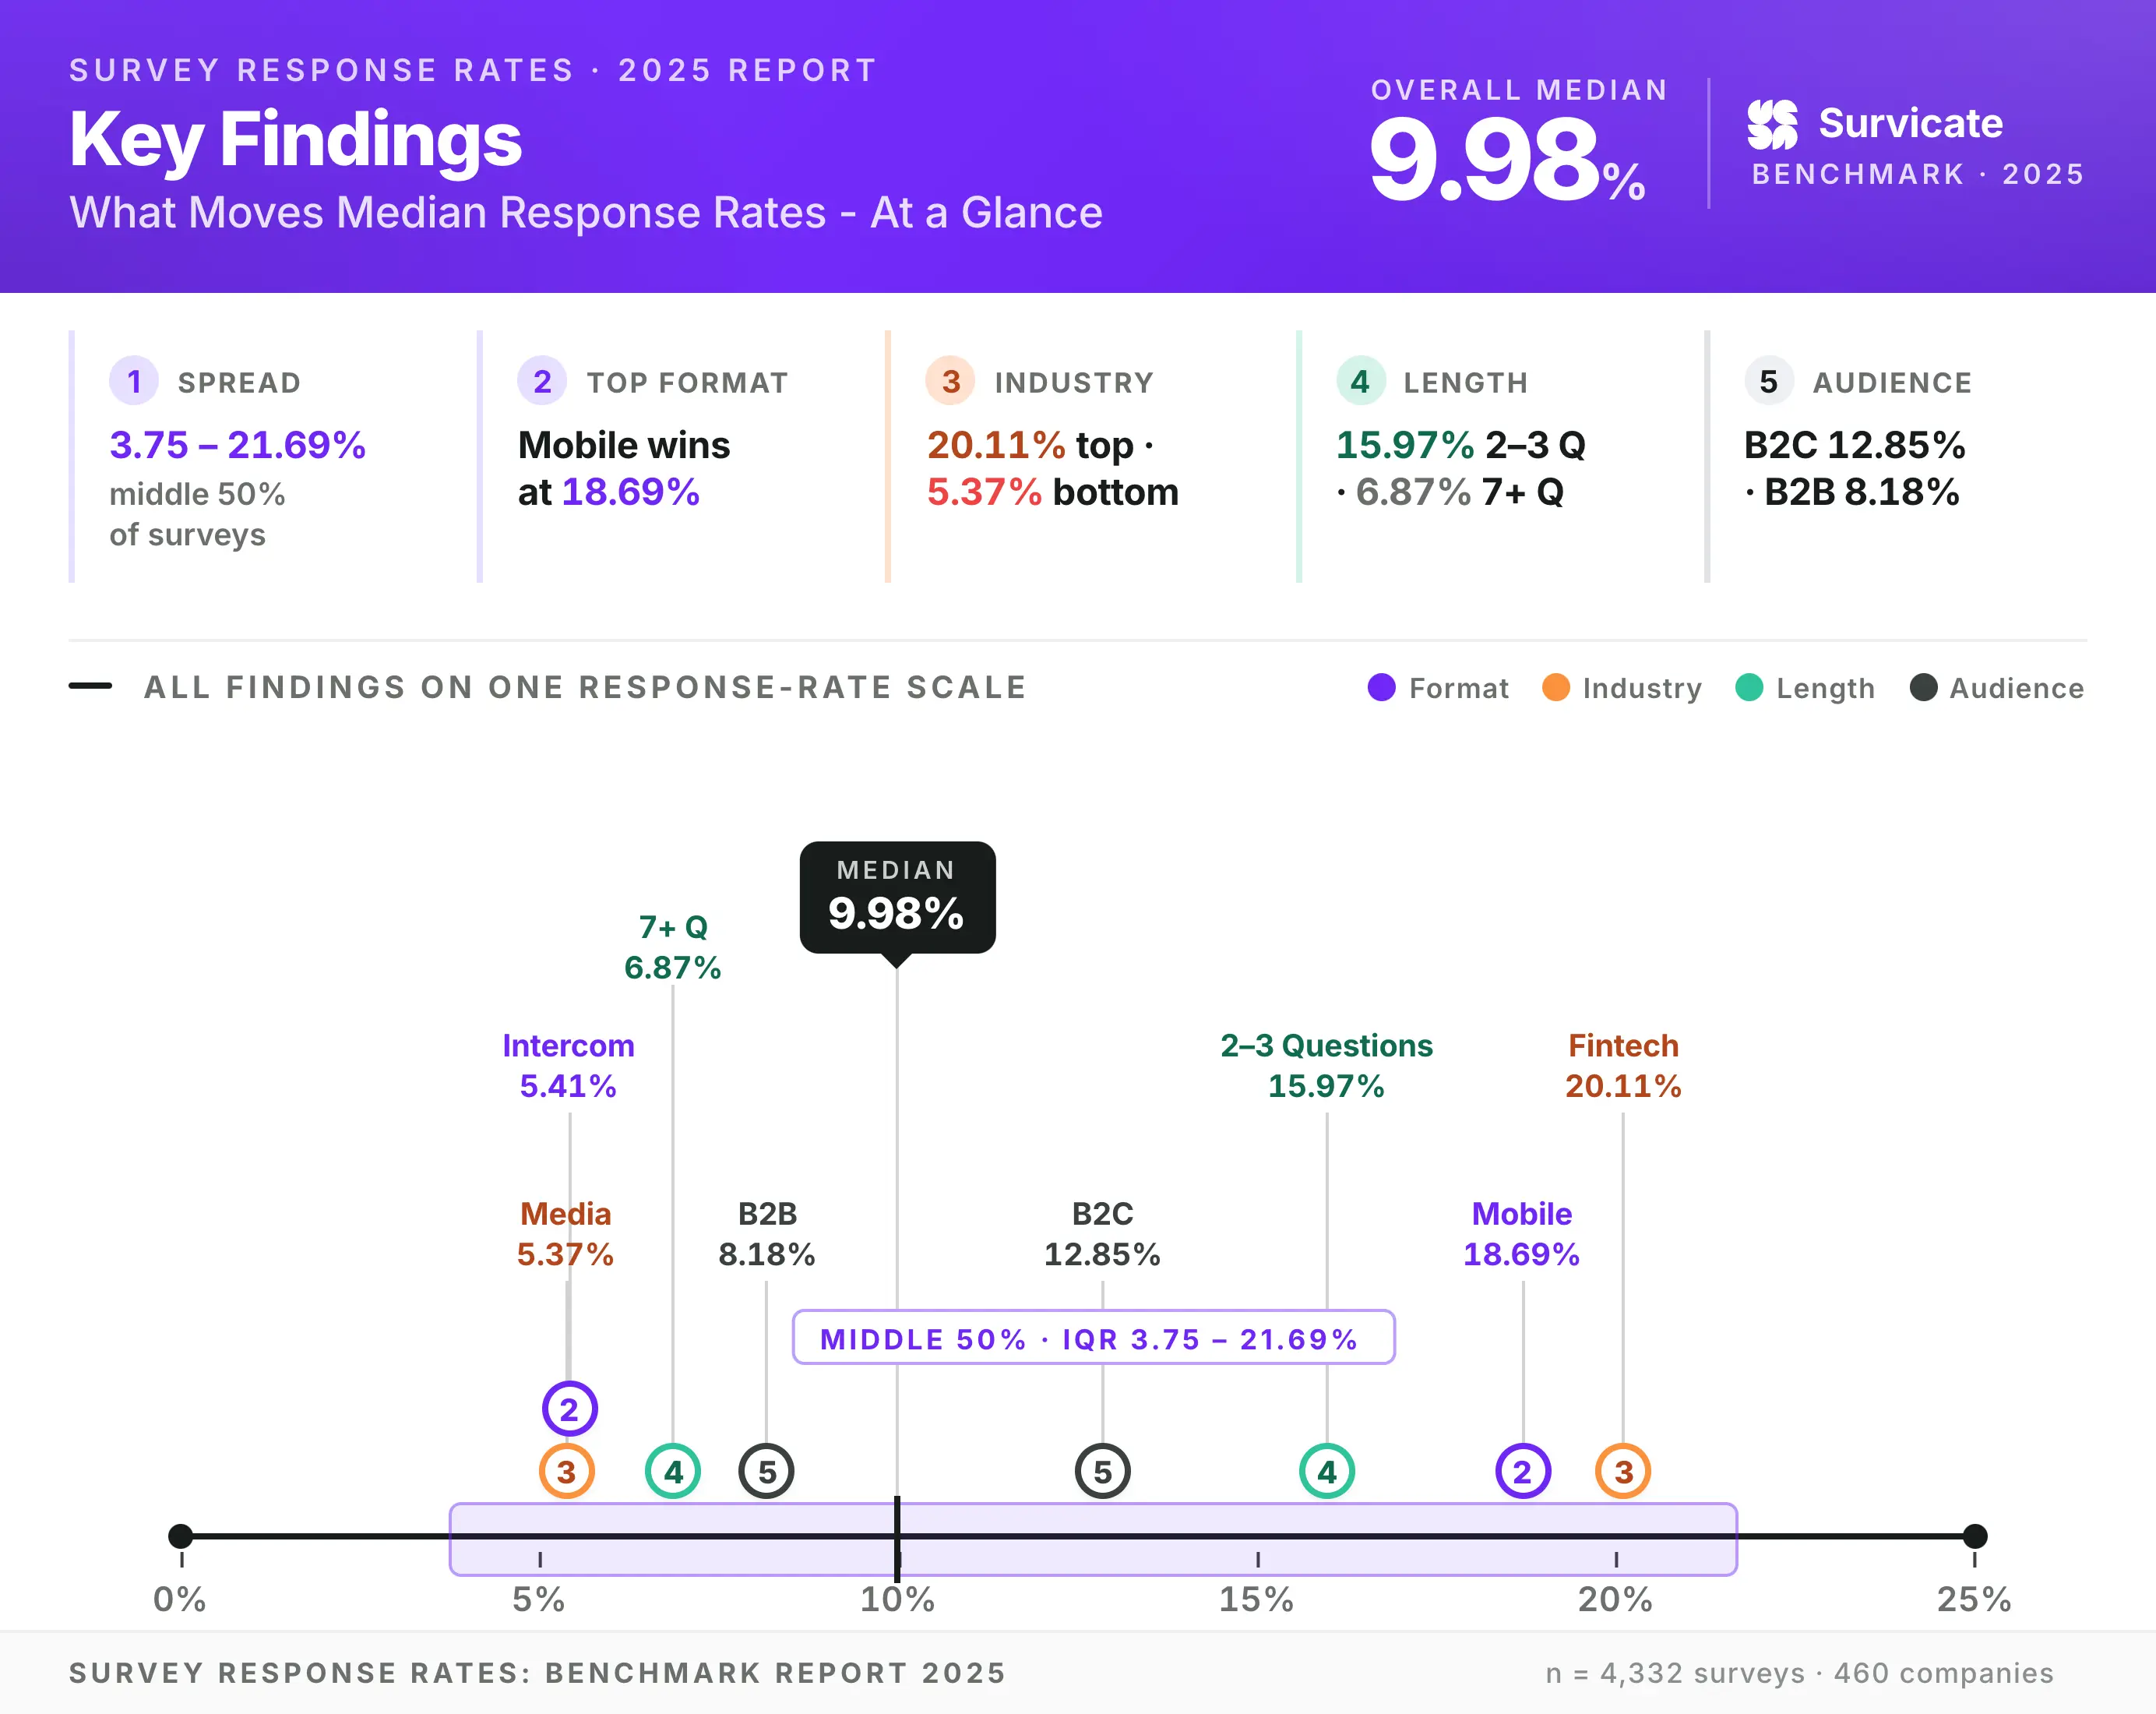
- The overall median response rate across the benchmark is 9.98%
In the final sample of 4,332 surveys from 460 companies, half of all surveys achieved a response rate of 9.98% or higher. The middle 50% ranged from 3.75% to 21.69%, giving you a realistic benchmark – if you're around 10%, you're right in line with most companies.
- Mobile surveys deliver the highest median response rate among publishable formats
Mobile surveys achieved a strong median response rate of 18.69%, significantly outperforming Widget surveys (7.64%) and Intercom surveys (5.41%). If your goal is to collect the maximum amount of feedback, the mobile format is clearly the best choice.
- Fintech (20.11%) and Agency/Consulting (15.01%) lead all industries with median response rates above 15%
They are followed closely by Education (14.69%) and Retail/Wholesale (14.44%) - all well above the overall median of 9.98% If you're in a lower-performing industry, such as SaaS (7.74%), Manufacturing (5.90%), or Media (5.37%), don't benchmark against the overall median - compare yourself to your peers.
- Microsurveys with 2-3 questions show the highest median response rate
Microsurveys (2-3 questions) recorded the best engagement with a median of 15.97%, beating 1-question micro surveys (9.75%). In turn, high-performing 1-question micro surveys see a somewhat higher 75th percentile (27.21%) than 2-3-question micro surveys (26.29%).
- B2C surveys outperform B2B with a median response rate of (12.85%), nearly double that of B2B (8.18%)
This gap reflects how differently individual consumers and business clients engage with feedback requests. B2C response rates run higher across the board, with a median of 12.85% versus 8.18% for B2B, and that lead holds at both ends of the middle band (25th percentile 4.65% vs. 3.20%, 75th percentile 25.70% vs. 17.87%).
How many people actually began a survey? The median is 9.98%
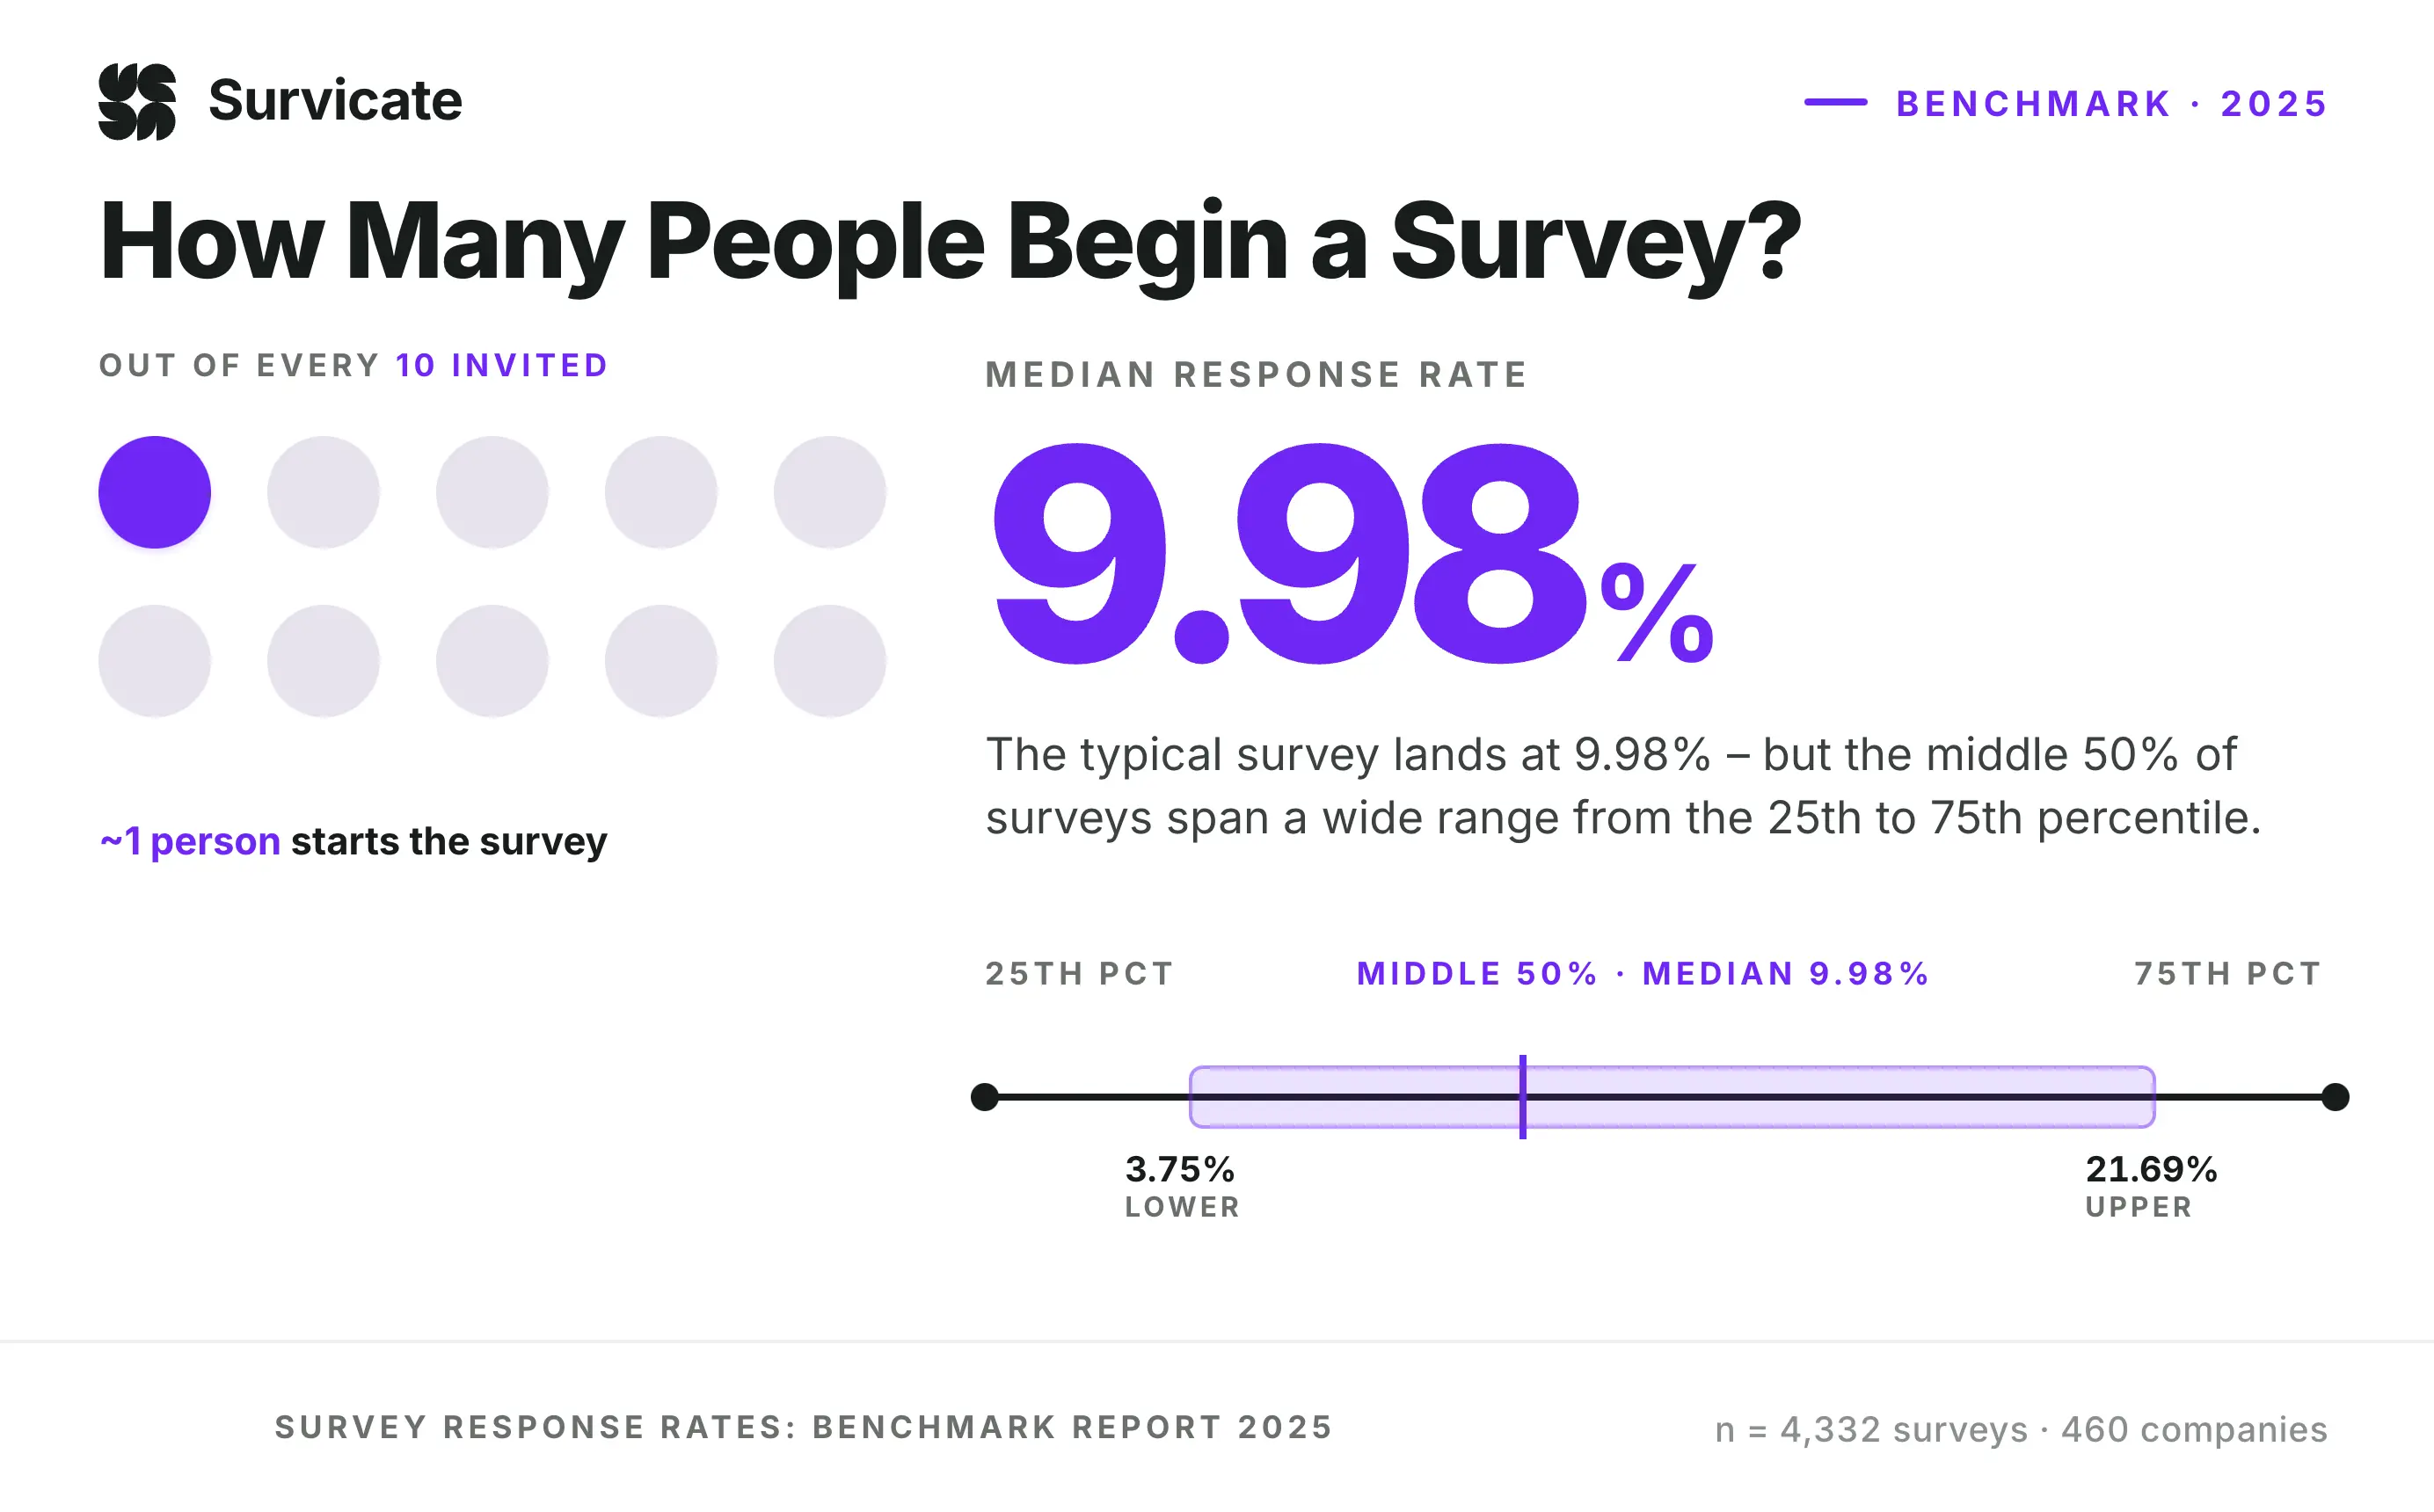
Before we dive into the scores themselves, let's look at how many people actually start a survey. Across our entire sample, the median response rate sits at 9.98%.
This means that for every ten people you invite to a survey, you can generally expect at least one to start it. However, "normal" can look very different depending on your audience. While the bottom quarter of surveys saw rates around 3.75%, the top performers reached as high as 21.69%.
To keep this data reliable, we only included surveys that received at least 30 individual responses, giving us a robust look at 4,332 surveys from 460 different companies.
Quick take: If your response rate is hovering around 10%, you’re right on track with the industry average. If you’re pushing past 21%, you’re officially a response rate superstar!
Where you ask matters: Mobile surveys are a clear winner

The way you deliver your survey can be just as important as what you’re asking. Our data shows that Mobile surveys – those that live inside iOS and Android apps – are the clear winners for engagement, boasting a median response rate of 18.69%.
Other formats like Widget (7.64%) and Intercom (5.41%) tend to see lower, more targeted engagement. While Mobile surveys lead the pack in volume, formats like Intercom and Widgets are essential for capturing feedback right in the middle of a customer conversation or browsing session.
Quick take: If you’re looking for the highest volume of feedback, a Mobile survey is your best bet. However, don't sleep on Intercom and Widgets. They are excellent for capturing "in-the-moment" sentiments, even if their typical response rates are more modest.
Fintech & agency/consulting audiences are most determined to respond
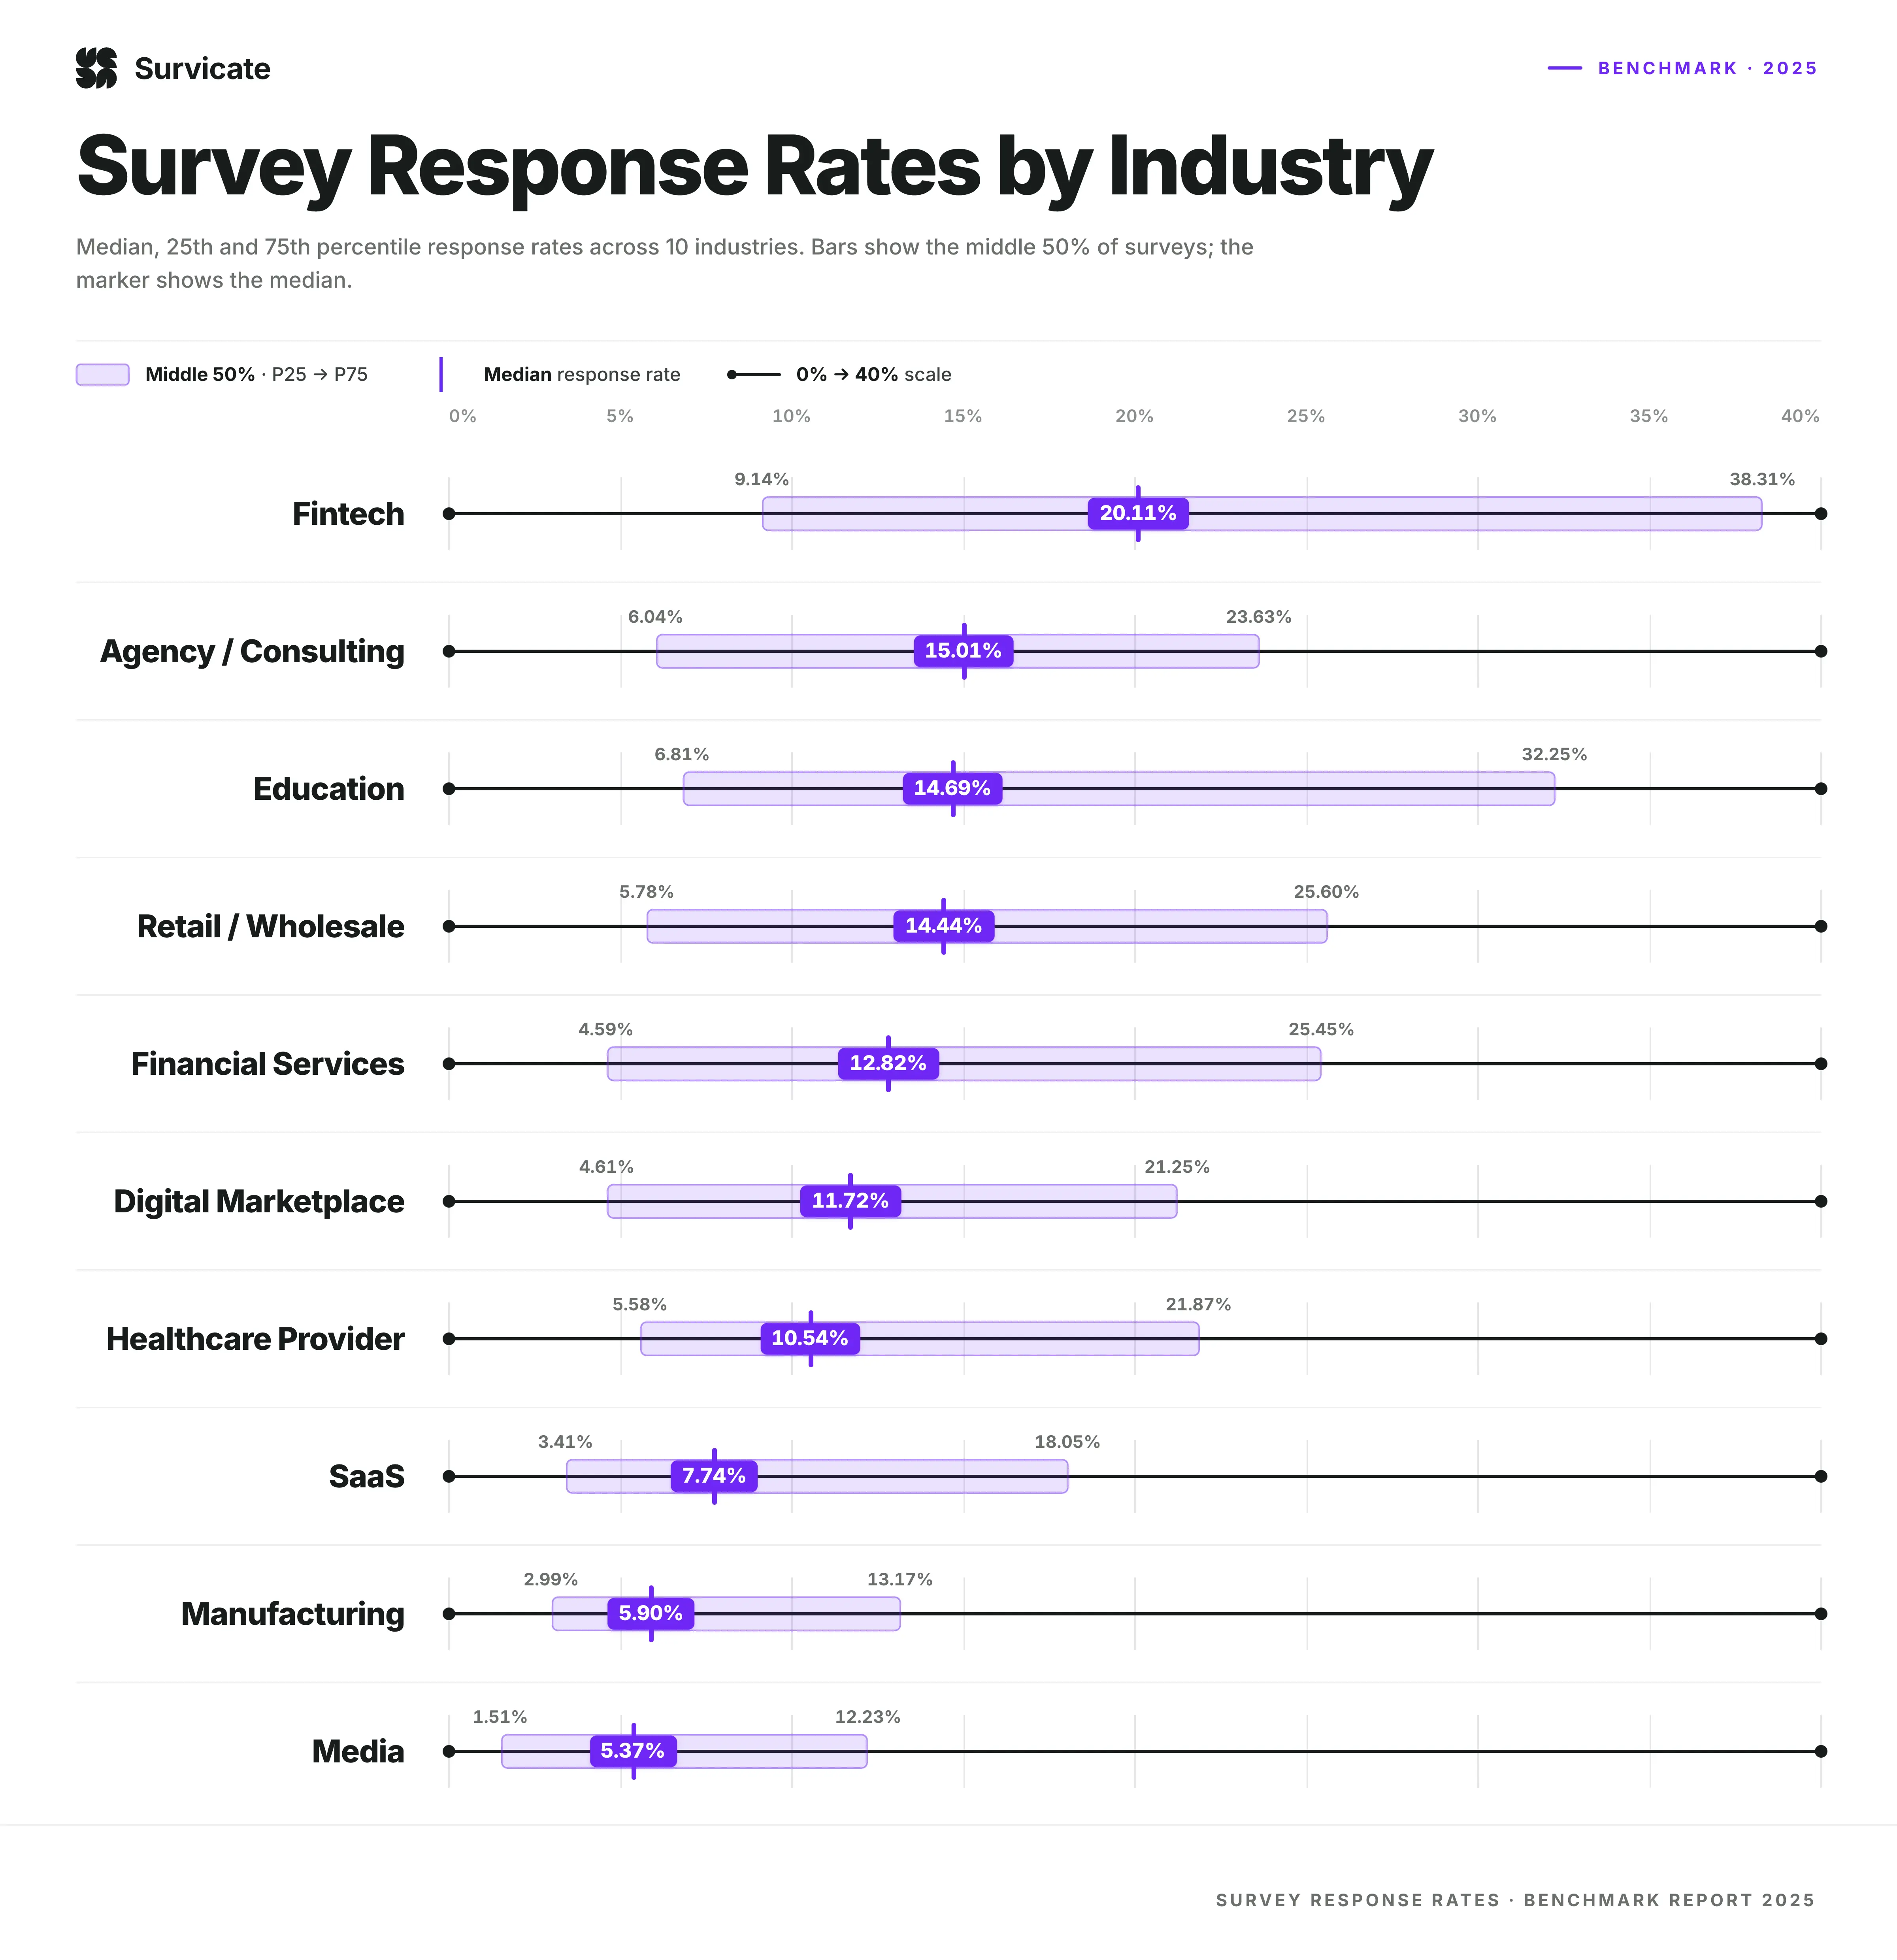
Industry is one of the most revealing dimensions in this dataset. Across a sample of 4,332 surveys from 460 companies, response rates vary widely – from a median of 5.37% to 20.11%.
Fintech lead all industries with a median response rate of 20.11%, though a relatively small sample of 121 surveys from 17 companies means this result should be treated with some caution. Agency/consulting follows closely at 15.01%, backed by a larger sample of 632 surveys from 50 companies. Education also performs strongly, with a median of 14.69%.
At the other end of the spectrum, Media records the lowest median at 5.37%. Manufacturing also underperforms at 5.90%, suggesting lower engagement is a challenge in that segment.
The largest group by survey count - SaaS (905 surveys from 153 companies) - makes the most statistically reliable reference point in this section. Interestingly, it lands below the overall benchmark median of 9.98%, with a repsonse rate of 7.74%. This suggests that this segment tends to run surveys at scale, often in lower-intent placements, which pulls its response rates down rather than up.
Mid-volume segments cluster nearer the benchmark. Digital Marketplace (604 surveys from 49 companies) sits at 11.72%, just above the overall median. Financial Services (160 surveys from 23 companies) and Healthcare Provider (136 surveys from 16 companies) land at 12.82% and 10.54% respectively - all within a tight band around 9.98%. This concentration reinforces the overall benchmark as a dependable midpoint, with the more extreme results at either end driven largely by smaller or higher-volume outliers.
2-3 question micro surveys have the highest median response rate
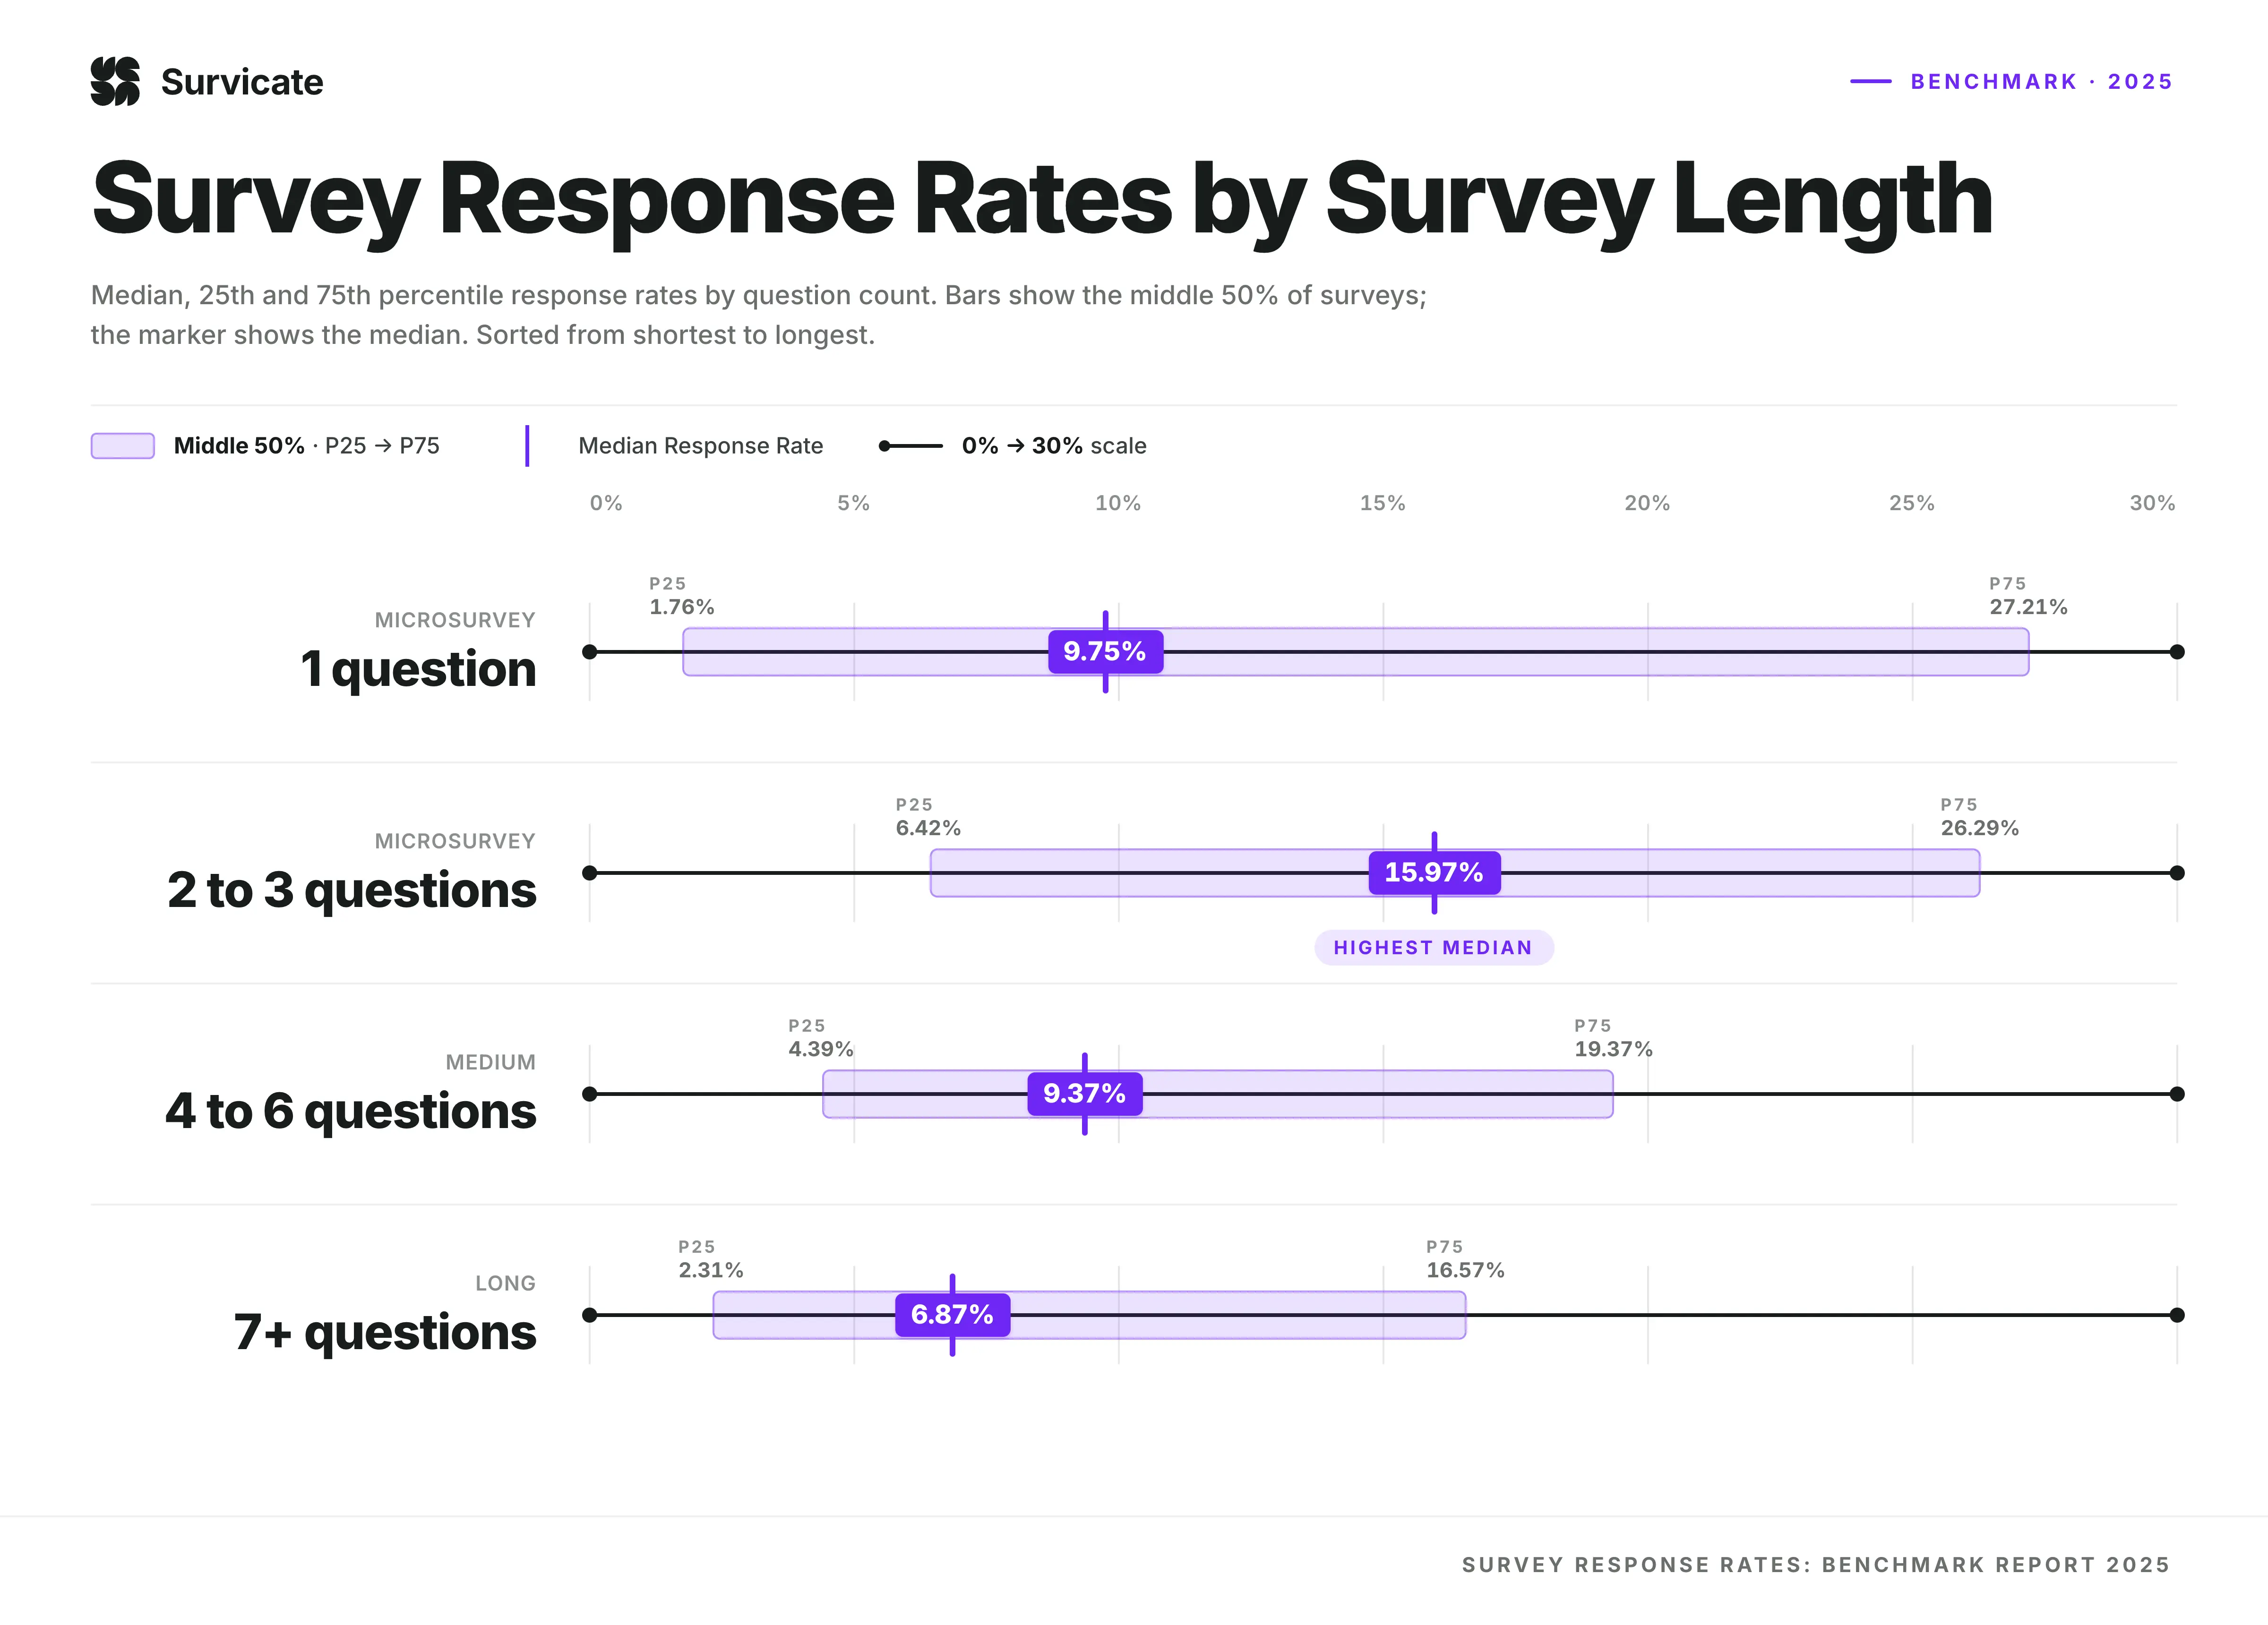
The number of questions you ask has a surprising impact on how people engage. Our data shows that micro surveys with 2-3 questions lead with the highest median response rate at 15.97%.
Micro surveys with 1 question follow with a consistent median of 9.75%, effectively dragged down with a lower 25th percentile at 1.76% compared to 6.42% for 2-3 question surveys. Surveys with 7+ questions see the lowest median engagement at 6.87%.
Note: Often, the "7+ question" surveys aren't showing every question to every person. Instead, they might use smart logic to only show what’s necessary, which keeps completion rates high despite the total question count.
From start to finish: 75% of users cross the finish line
While getting someone to click "start" is the first hurdle, the real magic happens when they reach the end. The data shows that once a user engages, they are incredibly likely to finish. The overall median completion rate is a high 75.20%.
Most people who start a survey intend to see it through to the end, likely because the experience is designed to be respectful of their time. With a median completion time of just 42 seconds, these surveys prove that you don't need an hour of someone's day to get valuable insights – just about one minute will do. We reveal more in our completion time benchmark report.
Quick take: Completion rate is the ultimate "finish behavior" metric. Since most users finish in around 40 seconds, keeping your surveys snappy is the best way to ensure that 75% of your respondents make it all the way to the "Thank You" page.
B2C median response rate nearly double that of B2B

The type of audience you target, whether they are business clients or individual consumers, creates a notable shift in how people interact with surveys.
Our data shows that B2C companies lead with a significantly higher median response rate of 12.85%, while B2B surveys follow with a median of 8.18%.
That gap of nearly 5 percentage points widens in the 75th percentile. B2C's middle band, between the 25th and 75th percentiles, runs from 4.65% to 25.70%, while B2B's runs from 3.20% to 17.87%. At every point of comparison, consumer-facing surveys sit higher than their B2B counterparts.
B2C surveys feature more variance. They spread out roughly 21 percentage points between the 25th and 75th percentiles, making them less predictable than B2B surveys at a 14 percentage point spread. Whichever side you're on, expect a wide span of outcomes and treat execution - survey timing, channel, audience, language group, and incentive - as the main driver of where you land, rather than your business model.
What is a good response rate for surveys, then?
Just like with NPS, there is no single "perfect" number for a response rate. Instead, a "good" rate is one that provides a representative sample of your audience and allows you to make confident decisions.
In absolute terms, our findings show that the median response rate is 9.98%. However, because engagement varies so much by how and where you ask, it’s helpful to view "good" through different lenses.
The absolute benchmarks

In general terms, here is how to define your response rate based on our 2025 data:
- 0–4%: Needs improvement. This is common for broad, unsegmented surveys or "exit" widgets where users are already leaving.
- 5–10%: Good. This is where the majority of companies sit (the median is 9.98%). It’s a solid, healthy range for most Customer and Product Experience surveys.
- 11–22%: Great. You are likely using high-engagement formats like Mobile surveys or targeting very specific, loyal user segments.
- 22%+. This puts you in the top 25% of performers. Achieving this usually requires a combination of perfect timing and a highly motivated audience.
4 factors that influence your "good" rate
While the numbers above provide a baseline, four key factors will consistently shift what "good" looks like for your specific survey:
- The delivery channel: As we saw earlier, a 18.69% rate is standard for a Mobile survey, but that same 19% would be legendary for a Website Widget (where the median is closer to 8%).
- The relationship: Surveys sent to long-term, loyal customers (Relational surveys) often see higher engagement than those sent to anonymous website visitors or first-time users.
- The effort required: Our data shows that most people finish surveys in under 42 seconds. If your survey is long or complex, your response and completion rates will naturally dip.
- The incentive: While not always necessary, offering a "thank you" or an incentive can push a "good" response rate into the "excellent" category by motivating those who might otherwise stay silent.
Don't get discouraged if you aren't hitting 23% immediately. If your response rate is above 10%, you are performing better than half of the companies we analyzed. Focus on your own growth trends – improving your own rate over time is more valuable than any single "perfect" number.