The 2025 State of User Research by UserInterviews revealed some pretty disheartening conclusions:
“Almost half of researchers (49%) we surveyed said they feel bad vibes about the future of UXR—a 26-point increase from 2024. Career opportunities? Even worse: 67% gave a thumbs down—up 21 points from last year.”
But, despite the bad vibes, interestingly enough, AI adoption is increasing a lot.
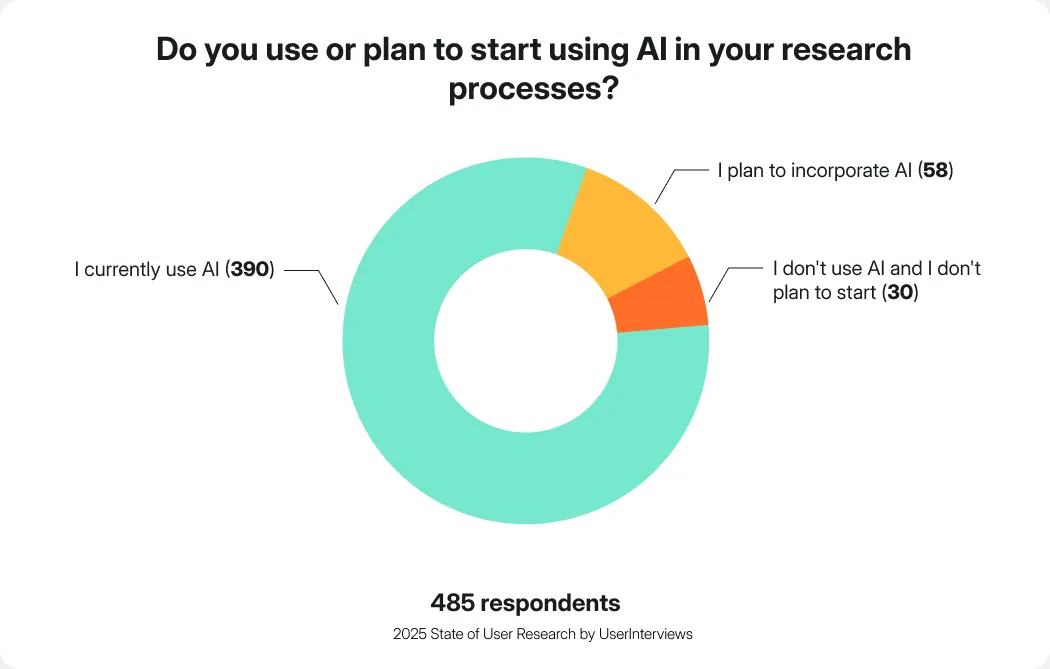
Out of 485 Researchers, 390 said “I currently use AI” when asked whether they use or plan to start using AI in their research processes. Moreover, 58 plan to incorporate AI into their practice, with only 30 out of nearly 500 Researchers saying they do not use AI and are not planning to start using it in their practice.
But what does AI have to do with a research repository?
A research repository is a centralized space for all research data and insights from across sources. A good repository should be easily accessible and allow you to not only store the data, but also quickly analyze it to then draw conclusions and build the narrative to help make informed decisions.
Here’s where AI may come into place.
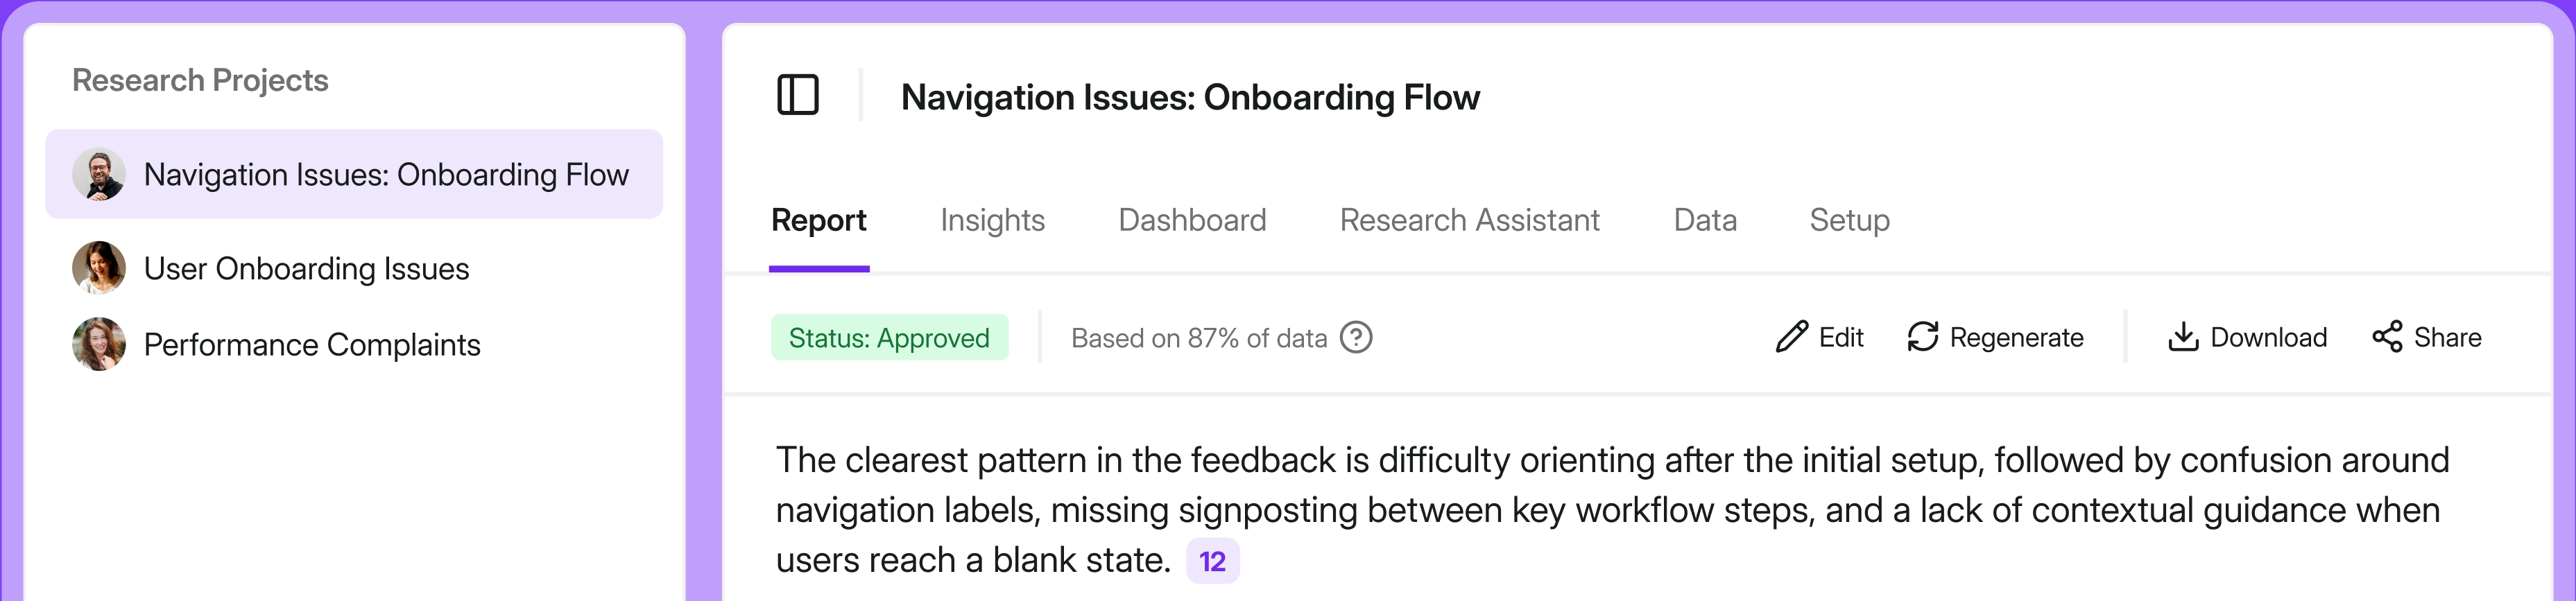
Weronika Denisiewicz, a Senior User Researcher, says in her recent article about traditional repositories:
“In my experience, even a structured and well-tagged repository quickly turned into a silo of knowledge that looked organized but no one actually used it. It was hard to search, disconnected from the team's daily work, and overly dependent on me to interpret or resurface insights.”
“The real breakthrough came with AI-powered tools. They removed the need for manual tagging, enabled natural-language search, and allowed the team to work with research data without requiring expert help. What once felt like a static archive turned into a living knowledge base—accessible, searchable, and actually used.”
In this article, we’ll take a look at the best research repository tools, with a particular close lens on their AI features (heavy on features, not platforms aiming at replacing UX Researchers altogether.)
Tl;dr
- UX research feels uncertain right now, with 49% of researchers pessimistic about the field and 67% concerned about career opportunities, but AI adoption is accelerating, not slowing down.
- AI isn’t replacing researchers. It’s being used to remove friction: manual tagging, fragmented data, slow synthesis, and insight resurfacing.
- Traditional research repositories fail when they become static archives that only researchers can interpret. AI changes this by enabling natural-language search, automatic theming, and source-backed insights.
- A good research repository must do four things well:
- aggregate feedback from multiple sources,
- analyze and synthesize data (with traceability),
- organize work into clear research projects,
- make insights easy to share and act on.
- AI matters only when it’s grounded in your data. The best tools avoid hallucinations by always linking insights back to exact quotes and sources.
Here's how the seven best tools stack up at a glance.
In short: Survicate stands out for end-to-end workflows and affordability. Dovetail and Marvin go deep on qualitative work. Condens and UserBit are classic repositories that lean on manual effort. Enterpret is powerful but enterprise-priced. NotebookLM is a lighter, narrower tool.
4 must-have research repository features
Before we get into the actual tool comparison (no one’s stopping you, though!), we’re going to focus a bit more on the must-have UX repository features to make it clearer as to what we’re actually looking for.
Aggregating feedback data from across sources
What gives you confidence in your research?
We’ve talked to quite a few Researchers at Survicate, building a platform and a dedicated product for them.
Many of them say that what gives them confidence is several different data points from various sources pointing to a single path or conclusion. But collecting and analyzing data from across sources is a tedious task.
Ten user interviews, three surveys, and some analytics data thrown into the mix. All analyzed separately, with no single source of truth.
A proper research repository fixes that.
You aggregate data from any research method you use, in one place. Inputs usually include CSV uploads, integrations with other tools, like Intercom, App Store or Google reviews, call and video recordings, survey data, and more. (For the wider picture, here's our guide to the different types of user feedback and how to collect them.)
Bonus feature: call and video transcriptions
Not absolutely must-have, but good repository tools offer one additional feature that helps aggregate as much data as possible, even the seemingly difficult studies: the ones in the form of call or video recordings.
So, if the research repository platform you’re looking for also offers call and video transcription, you’re in for a treat.
Instead of rewatching the recordings, getting distracted by that one pimple on your face, and wasting time re-visiting old conversations for the tenth time, you simply automatically transcribe the interview or study into text.
Analyzing the data and presenting results
There's never enough done in research, right?
Another project popping in because of a quick question over Slack from leadership. Wasting time re-watching call recordings. Mental overload from talking to interviewees and struggling to take coherent notes at the same time.
So a research repository can't just aggregate data. It has to analyze it and help you draw conclusions.
Here you'll come across features like:
- Auto-categorizing aggregated data into themes and groups
- Citing back to exact quotes and sources to avoid hallucination
- Auto-creating graphs, charts, and reports based on the extracted themes
- Filtering the data by time, source, sentiment, and more
- Sentiment analysis
Bonus feature: auto-translations
Another micro-feature that can speed up future analysis a lot is…translations.
If your target audience is multilingual, an advanced research repository platform may allow you to automatically translate research data into a default language of your choosing.
No matter if these are survey responses, csv data points, or transcribed call/video recordings of user interviews.
Research projects
Another project half-opened, someone left the org, team leader has a quick question and every study has 5 different sources and varied user groups.
It all has to be organized in a smart way to avoid chaos.
Organizing the data into specific Research Studies or Research Projects that answer specific questions is another core feature of a good research repository tool.
Sharing the data, insights, and findings easily
Finally, what’s good about finding the best answers if you don’t have a structured way of sharing the insights?
Prepped the most amazing and detailed deck, but stakeholders still hit you with the ok, and what about it?
Changed strategies and now give all the important answers upfront, but the research still gets overlooked?
Make it easier to democratize research with these research repository features:
- Slack integrations to auto share reports/findings
- Let team collaborate on findings, chat with the insights from Slack
- Downloading auto-generated reports, charts, graphs in PNG, PDF, csv formats
- Access to other team members so that they can log in themselves
Is AI in all of this necessary? Good AI vs bad AI
According to the State of User Research, most studied Researchers do plan to incorporate AI into their processes (as mentioned at the beginning of this article), but that doesn’t mean they’re not wary of it at all.
UX Researchers are concerned about:
- The accuracy of AI output (“hallucinations”) and the risk of making decisions based on incorrect or fabricated information
- They also worry about data privacy, security, and the ethical use of participant data, especially when sensitive information is sent to third-party tools whose inner workings are not fully transparent.
- Many fear that AI could devalue human insight and critical thinking, while also raising questions around copyright, intellectual property, cost, and in some cases environmental impact.
Those are all valid concerns.
So to answer the question of is AI necessary in a good research repository tool? It is to actually make a difference in efficiency as opposed to traditional repositories.
But, it is not to say that the tools should have AI that’s marketed as one to replace UX Researchers altogether.
What bad AI looks like?
When researchers try to move faster, most reach for the same handful of tools: ChatGPT, Claude, or NotebookLM. Generic large language models, adapted with mixed success to a job they weren't built for. That comes with three real problems.
First, the context window. Feed a large dataset straight into an LLM and it suffers from "lost in the middle" degradation, where content in the middle of a long context gets simply underweighted.
Past roughly 1,000 to 2,000 rows of data, the model can miss or misrepresent a big chunk of your feedback, even if you upload it in pieces, because it still gets concatenated into one flat context.
Second, prompt purgatory and untraceable output. The result is only ever as good as your prompt, so you re-prompt, rebuild context, and still don't fully trust the conclusions. Then a stakeholder asks "who said that, and what exactly did they say?" and a generic LLM can't point you back to the source.
Third, no memory, no context, and no consistency. Every session starts from scratch. Ask the same question twice and you can get different themes and different counts. You can't trend anything over time or build a taxonomy that means the same thing across sessions and teammates.
What good AI looks like
Researchers themselves describe the AI they actually want.
They want it to handle the synthesis grunt work, pulling themes from hundreds of feedback points and connecting patterns across sources, so they can spend their time on interpretation.
They want to feed it business context so the output speaks to their roadmap and personas, not in generic terms.
And they want control over the synthesis, with a structured way to review every finding and put their name on a report they own.
Tools comparison: the 7 best research repositories tested (a deep dive)
Now let's get into the deep-dive comparison, starting with Survicate, then Dovetail, Marvin, Condens, UserBit, Enterpret, and NotebookLM. Listed brands are not placed in order of importance or ranking of any sort.
Survicate
The first platform on the deep dive is Survicate.
Survicate is a complete feedback platform that serves a different purpose depending on the exact team that’s using it.
For example, it can be used by Customer Success and Experience teams to run recurring CSAT surveys and track customer satisfaction, but also Research teams to run highly-targeted in-product surveys and/or use Survicate as a complete research repository tool for data centralization and deep analysis.
Survicate's AI research repository covers all the must-have features a tool like this should have:
- centralizing data from across sources (15+ sources, from tl;dv to Zendesk or Google reviews), csv uploads, call and video transcriptions, Survicate surveys (of course),
- running research projects, one-time or continuous, that produce an AI-drafted report you may refine and approve,
- auto-analyzing the centralized data, categorizing it into patterns, and always linking back to exact quotes and sources to avoid any hallucinations,
- filtering the analyzed data by source and time frame, as well as auto-generating charts and graphs that can be downloaded in PDF and PNG formats,
- generating AI summaries of the analyzed data for each spotted pattern or theme to ease sharing insights (with links to exact sources, again),
- generating AI answers in a dedicated chat (Research Assistant) that’s connected only to the centralized data and that can be filtered by data source and time frame for answers to be specific and actually helpful,
- 360-view Dashboards with customizable widgets for easy data comparison and bird’s eye view for stakeholders.
G2 rating: 4.6/5 ⭐
Survicate is also one of the very few research repositories with surveys built-in, so your budget doesn't have to stretch to a separate survey tool just to feed the repository.
Pricing
Survicate offers four pricing tiers, plus a free 10-day trial.
The trial is the easiest way to test the repository: you get full access to Growth features, with up to 25 survey responses, 100 Research Hub data points, and 25+ integrations, no card required, and human support that replies in under 5 minutes.
From there, the paid ladder runs: Starter ($89/month) covers 100 survey responses and 500 data points a month, surveys across all digital channels, Research Hub, and top-rated human live chat.
Growth ($56/month, billed annually) starts with 100 responses and 500 data points a month with unlimited multichannel surveys, the Research Assistant, 25+ integrations, multilingual surveys, custom branding, and 10 user seats across 2 teams.
Pro (from $349/month) adds Pro integrations, advanced survey logic, 10 dashboards, and custom seats and teams.
Enterprise (from $569/month) adds a custom number of dashboards, SAML SSO with access logs, custom ToS, DPA, and NDA, and on-demand security reviews.
Research Hub, Survicate's research repository, is available on every paid plan.
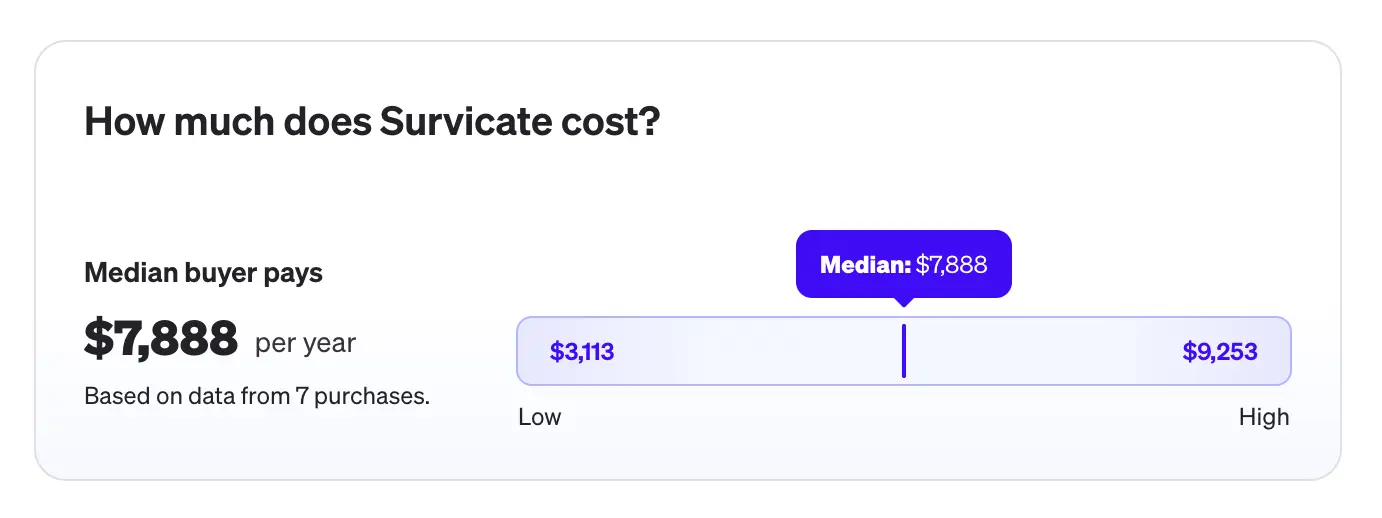
Okay, but how much does Survicate actually cost for an average user?
According to Vendr, the median price users pay for Survicate is less than $8k per year, making it much more affordable than other research repository tools on this list.
Features overview
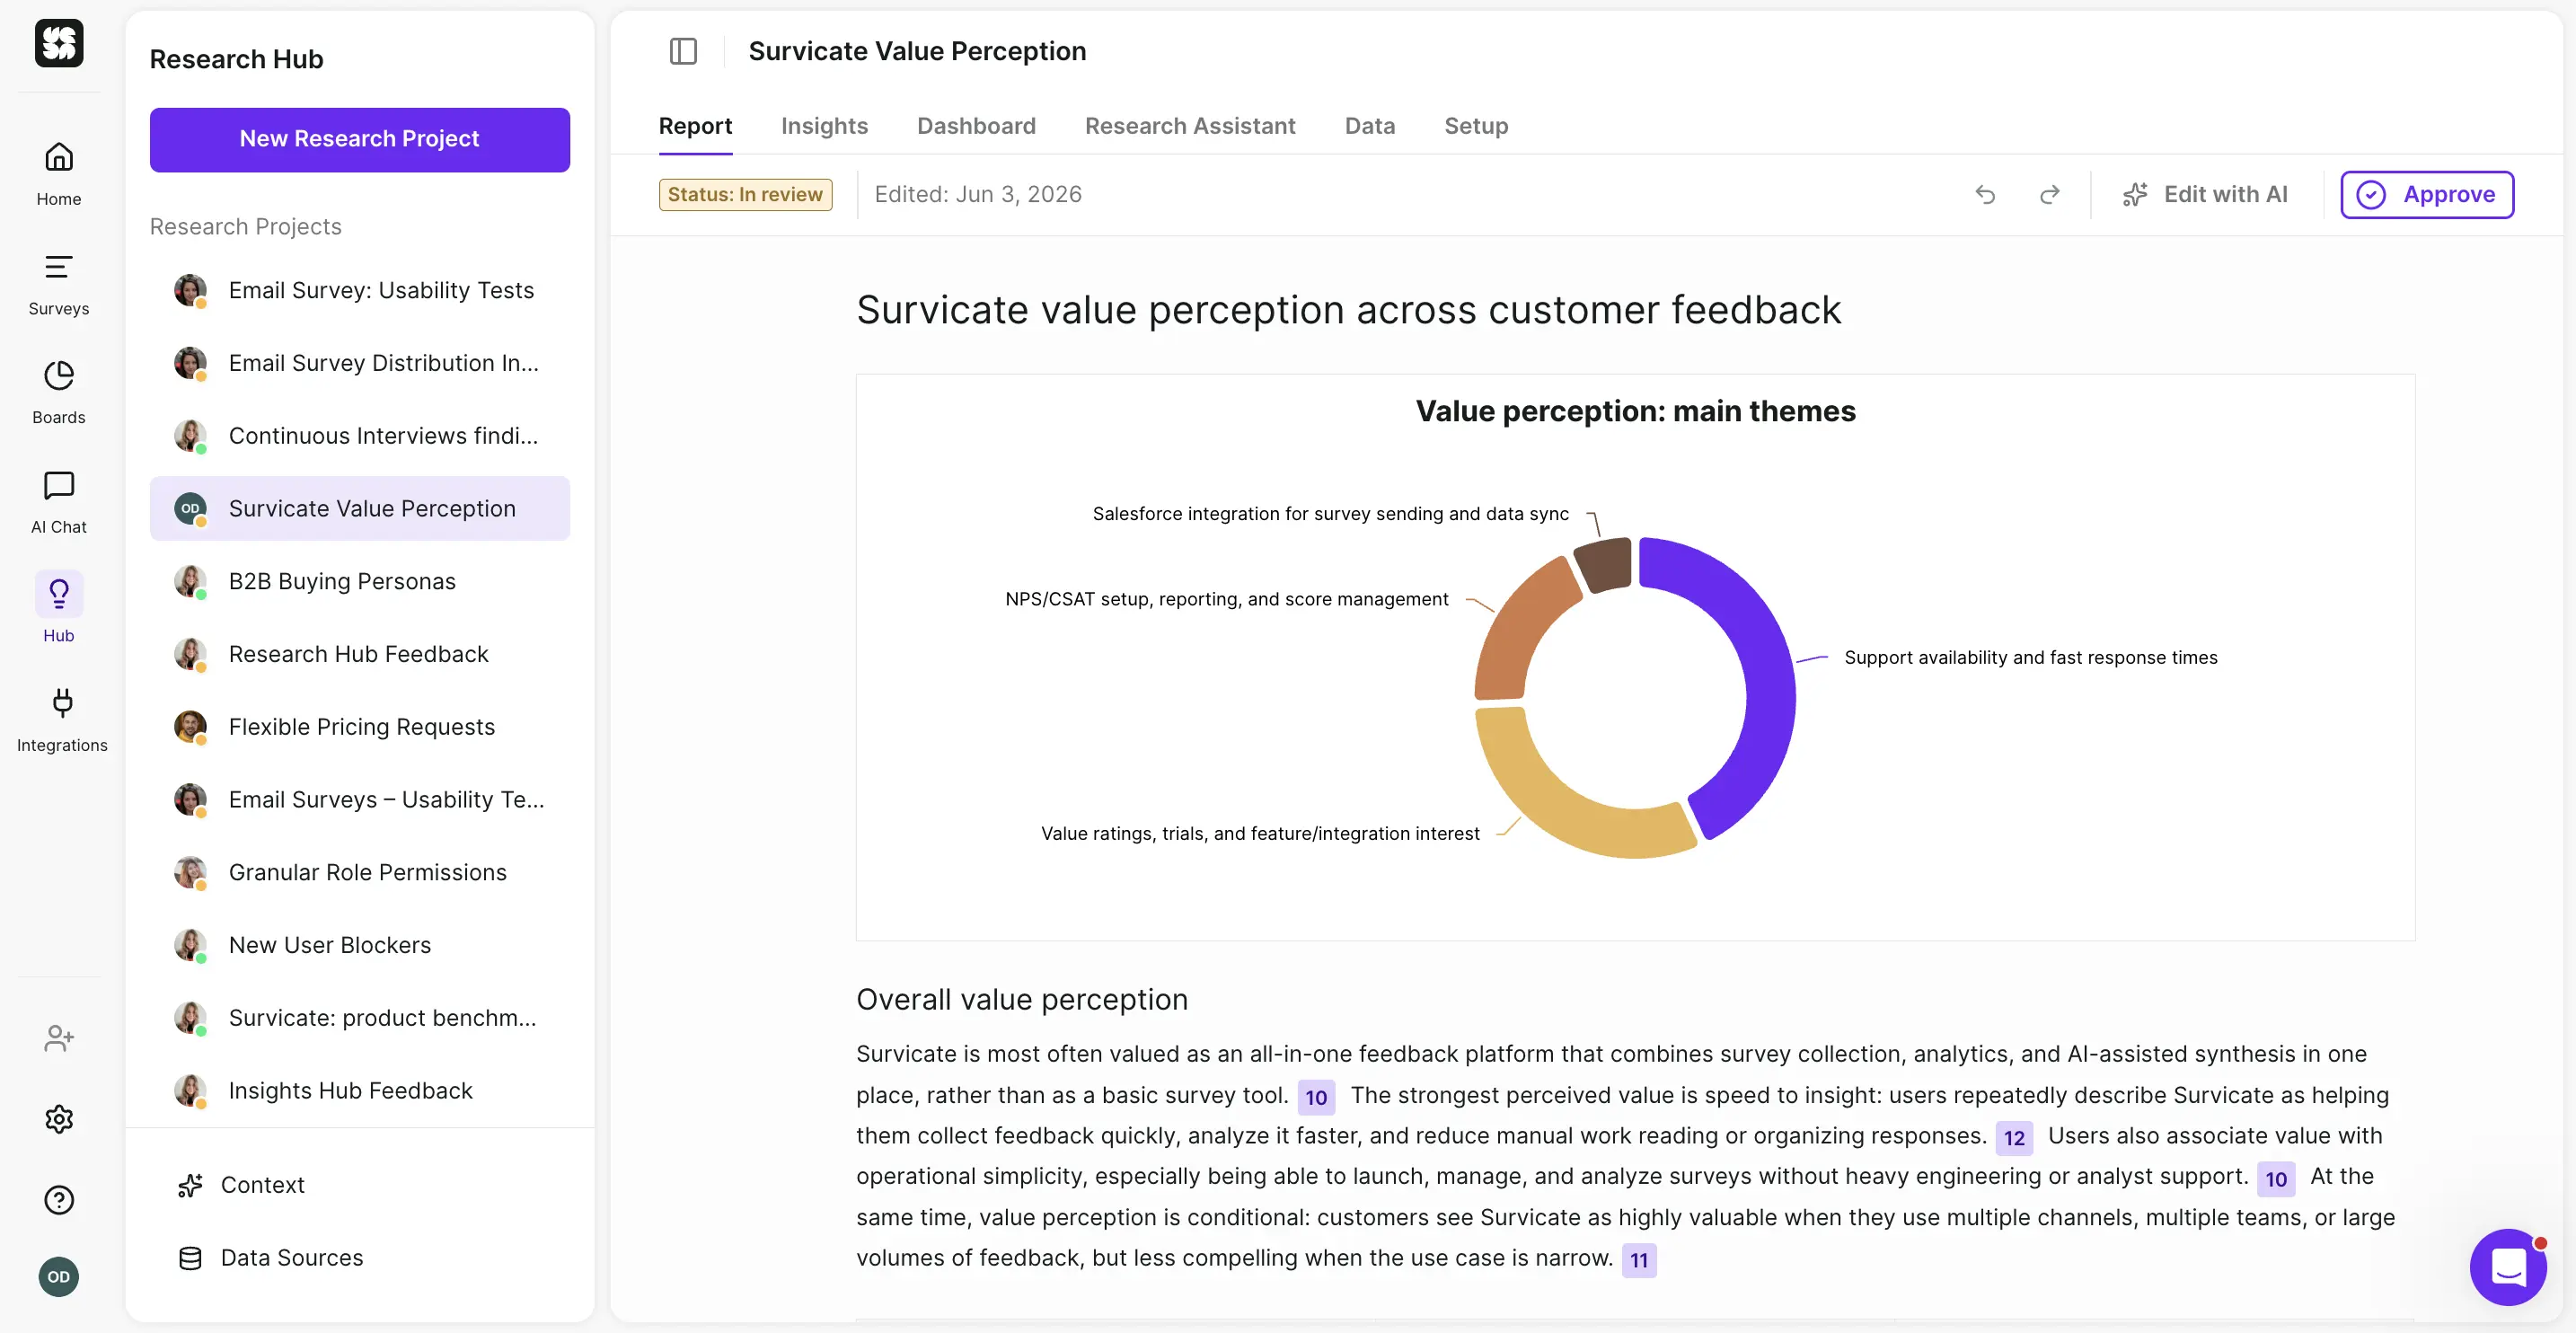
Let's actually click around Research Hub, and show off our repository capabilities in more detail.
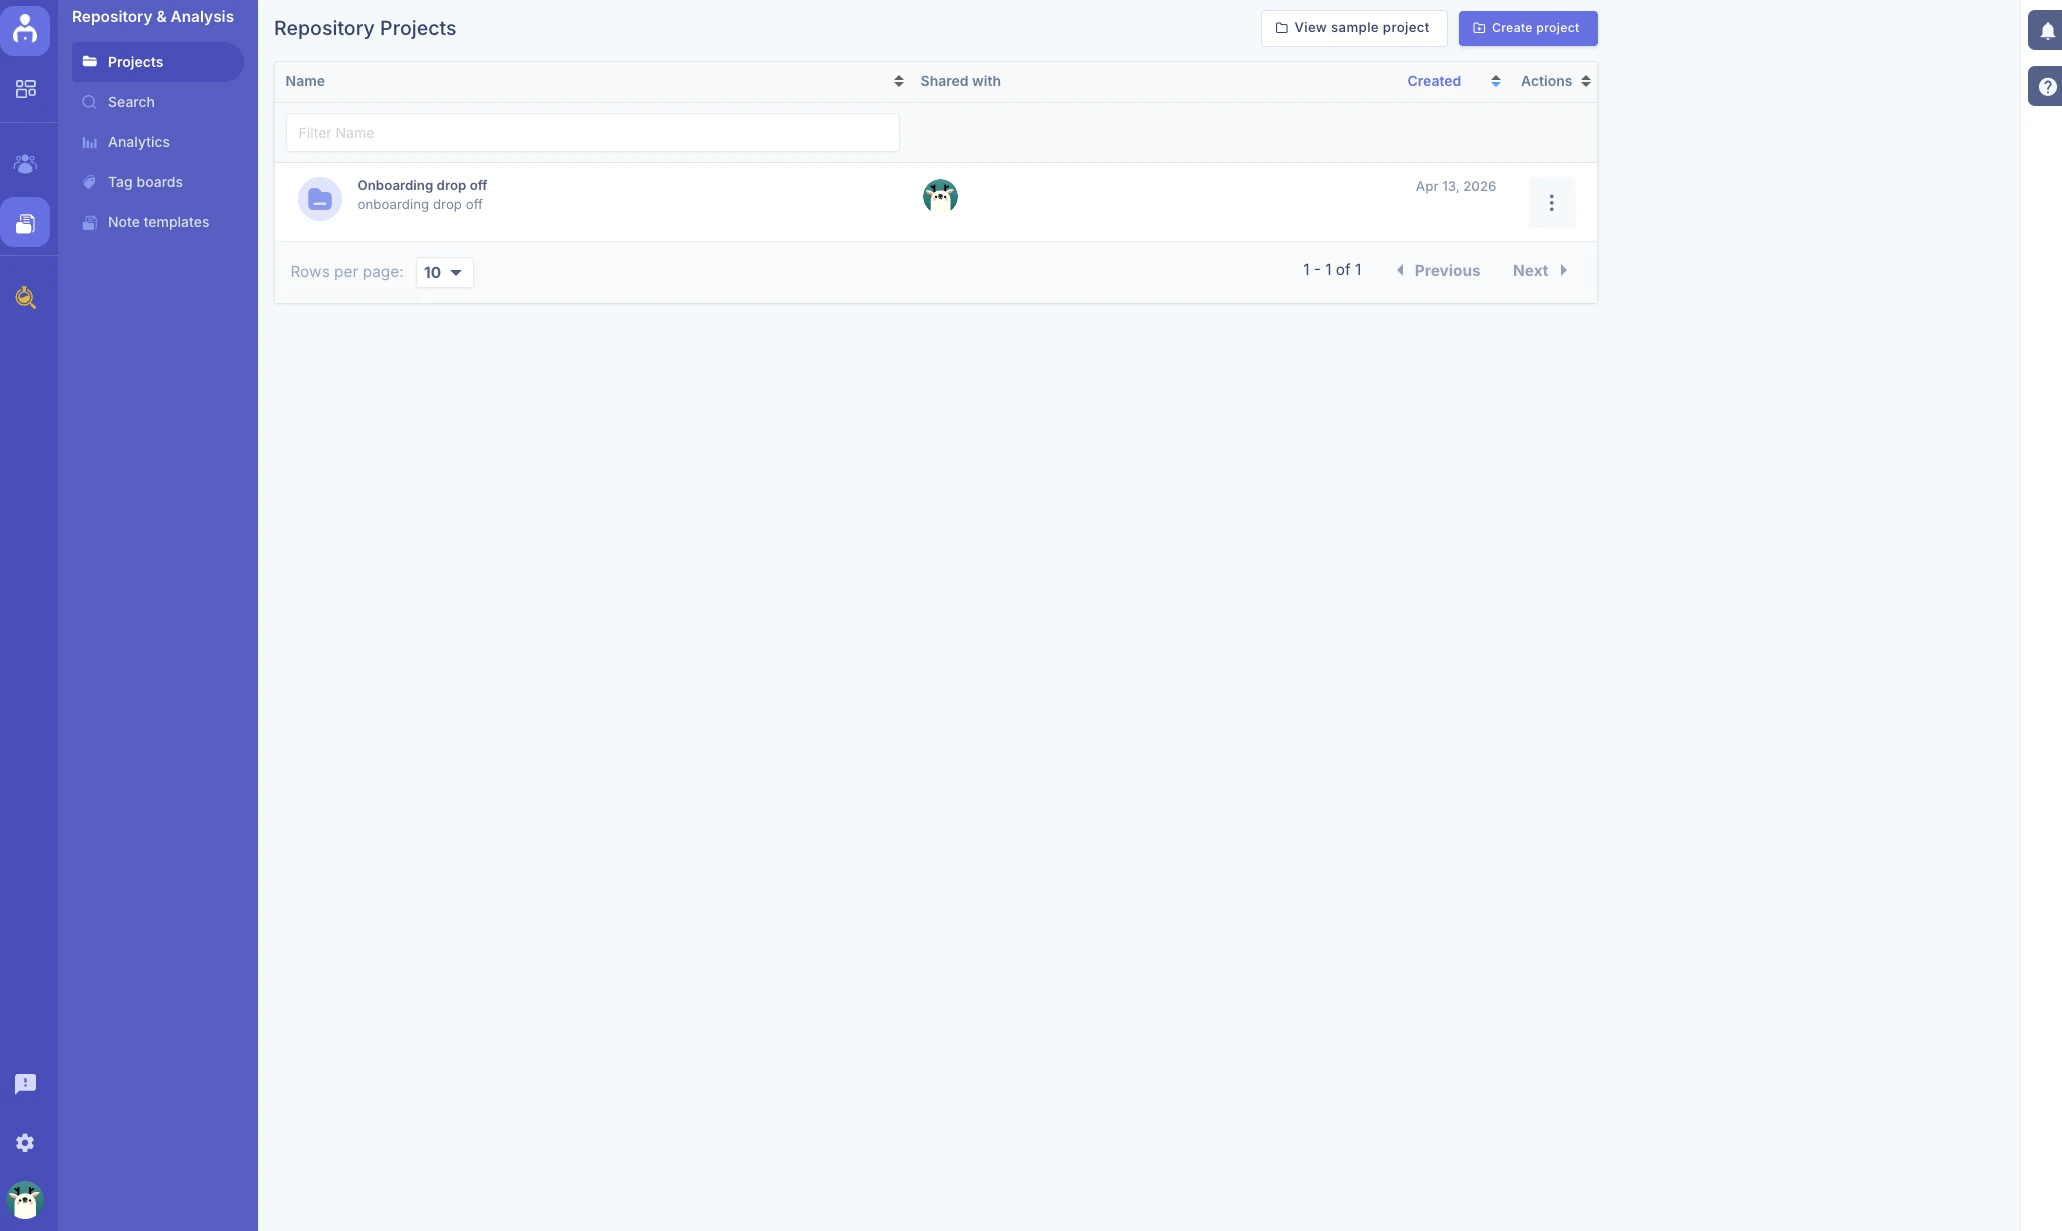
Research Hub: centralize and analyze
Research Hub is one of the core areas of Survicate. It's where you connect your scattered data into to create a single source of truth and then automatically analyze and categorize all your research data into insights based on projects.
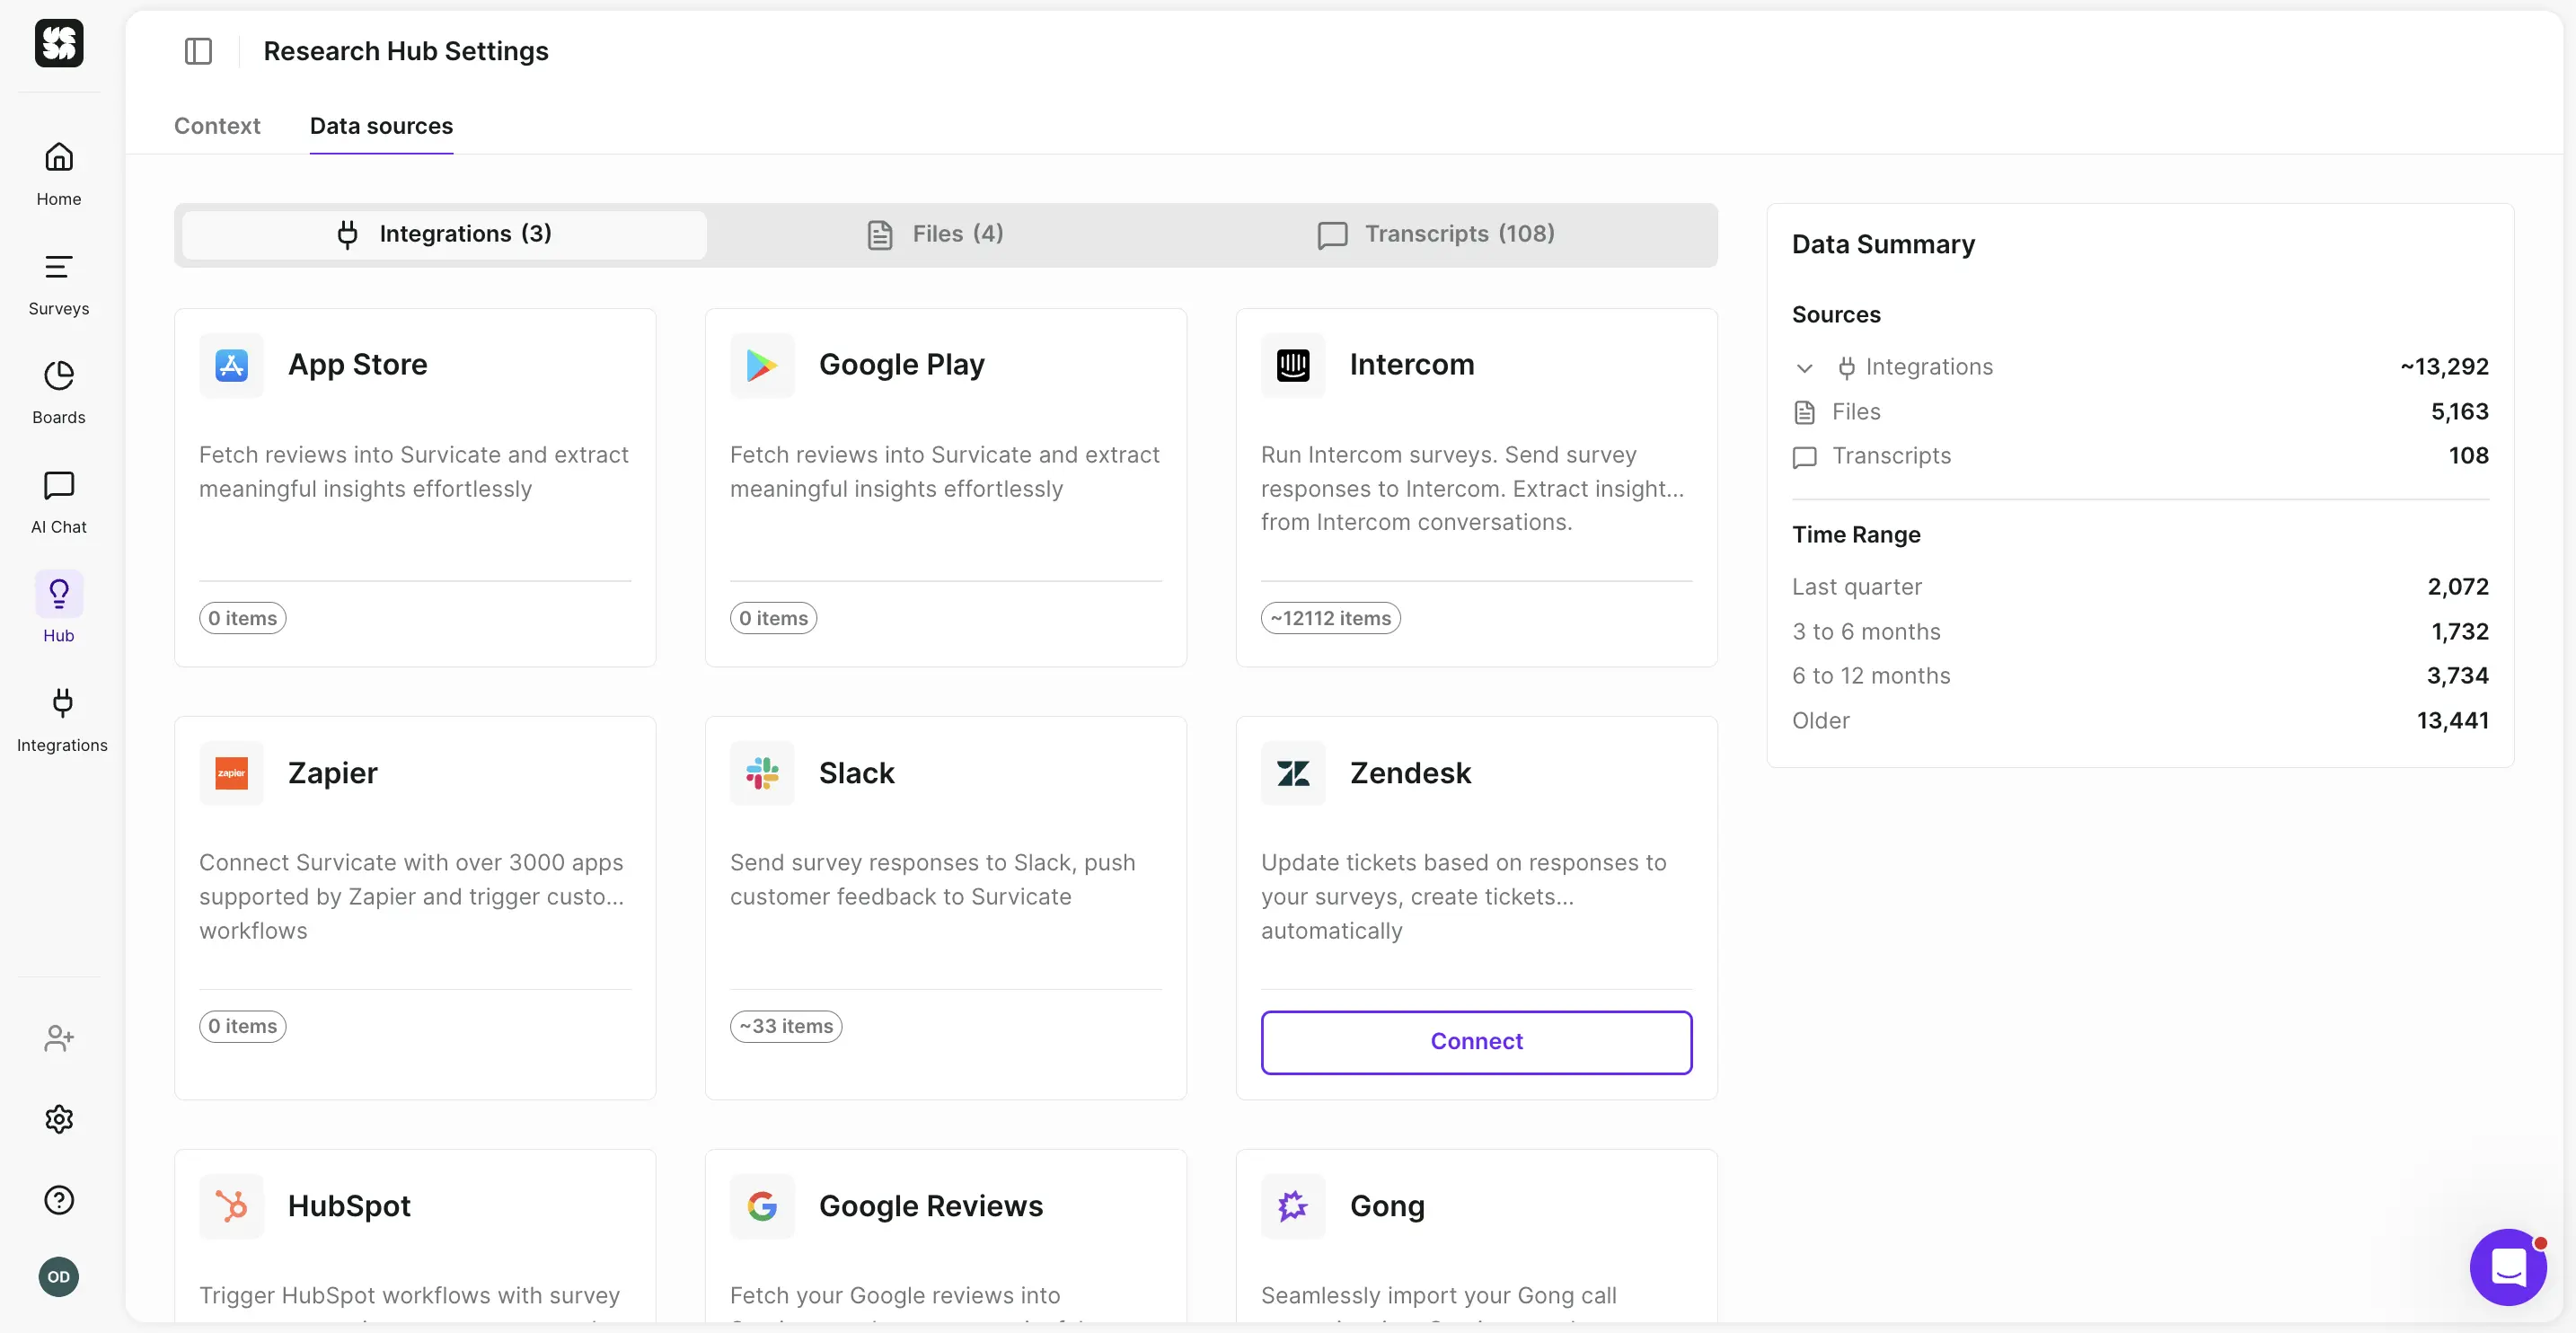
The data you can connect covers:
- Survicate surveys (in-product, in-app, web, in-platform, email, and link surveys),
- External sources such as Intercom conversations, App Store and Google reviews, Zendesk tickets, Slack conversations, tl;dv, and Gong calls, and more.
- Call and video transcriptions uploaded from your desktop,
- CSV files with data points.
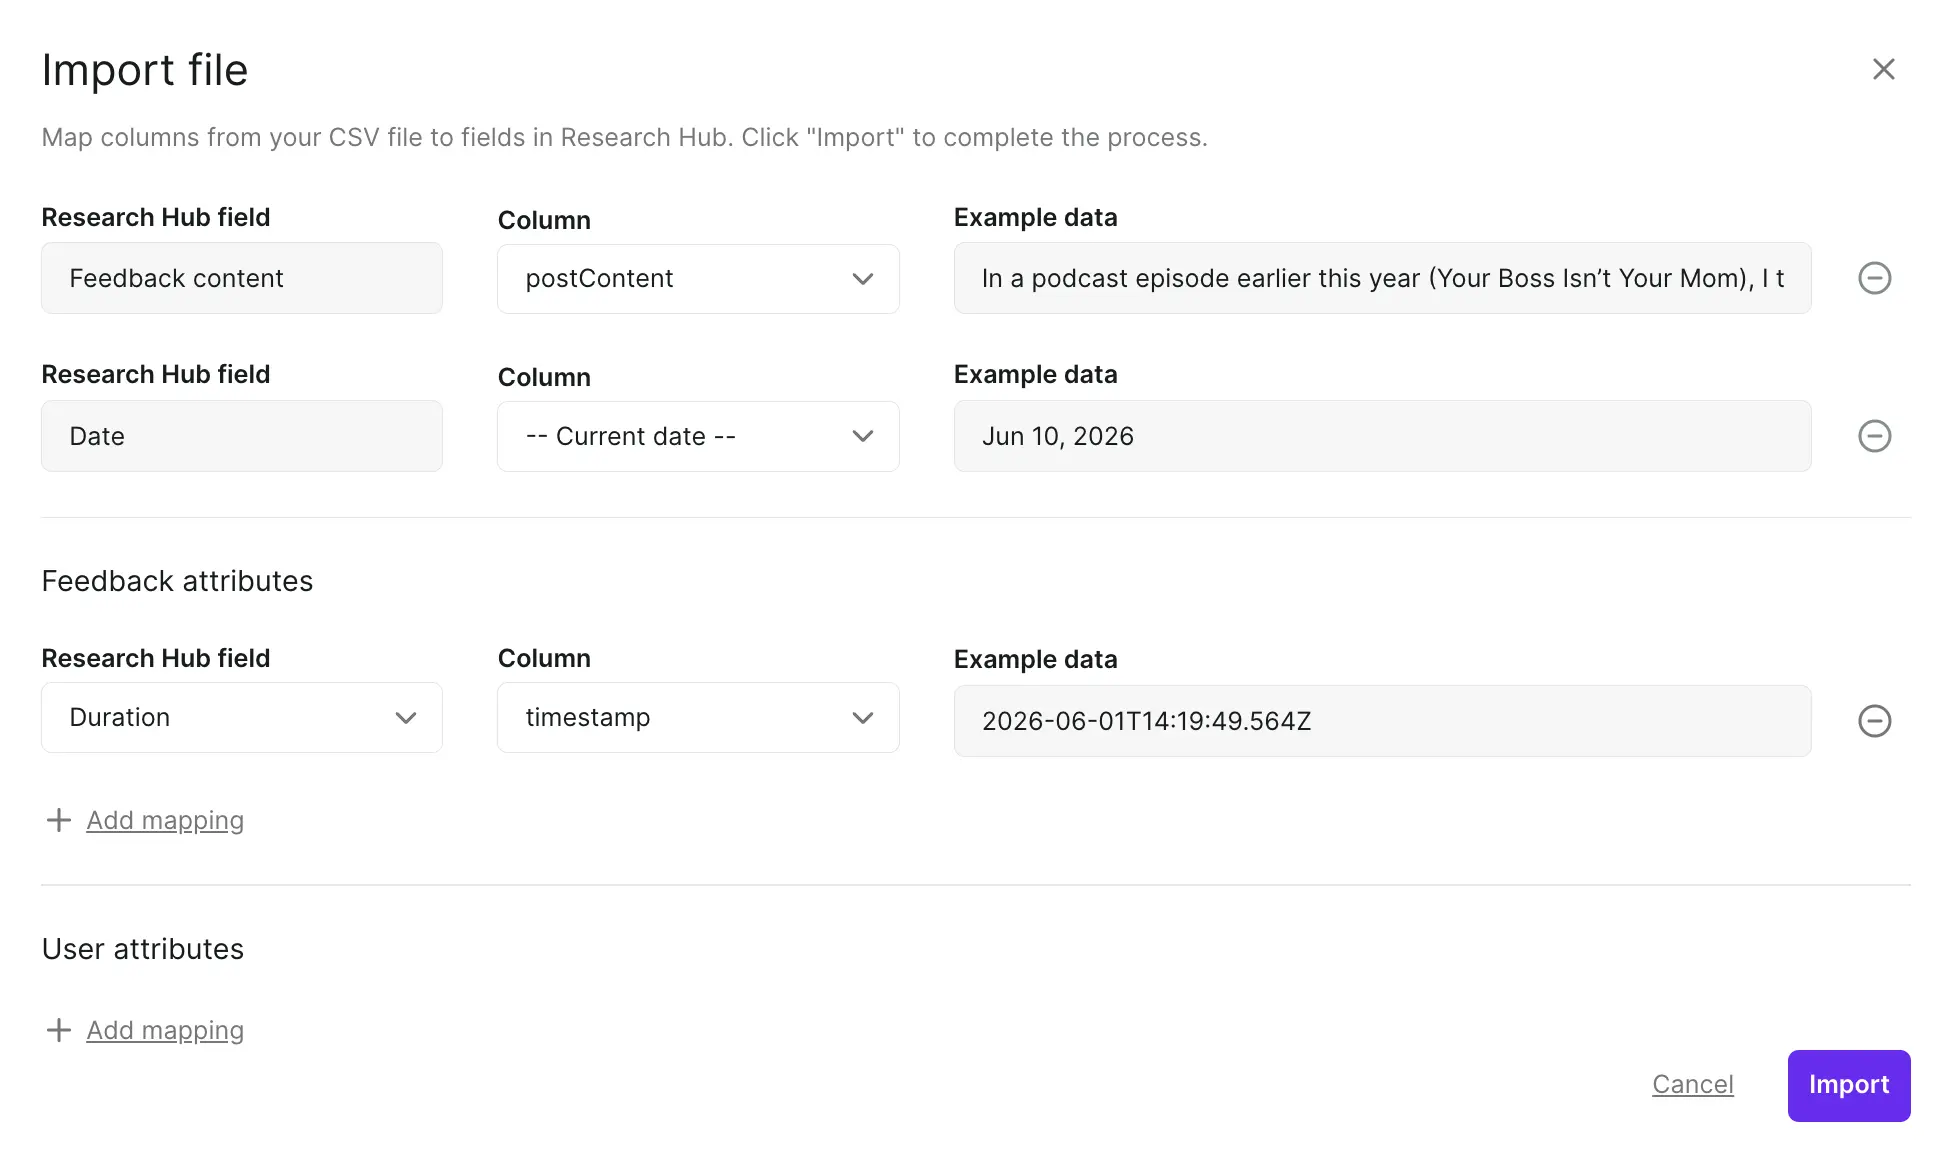
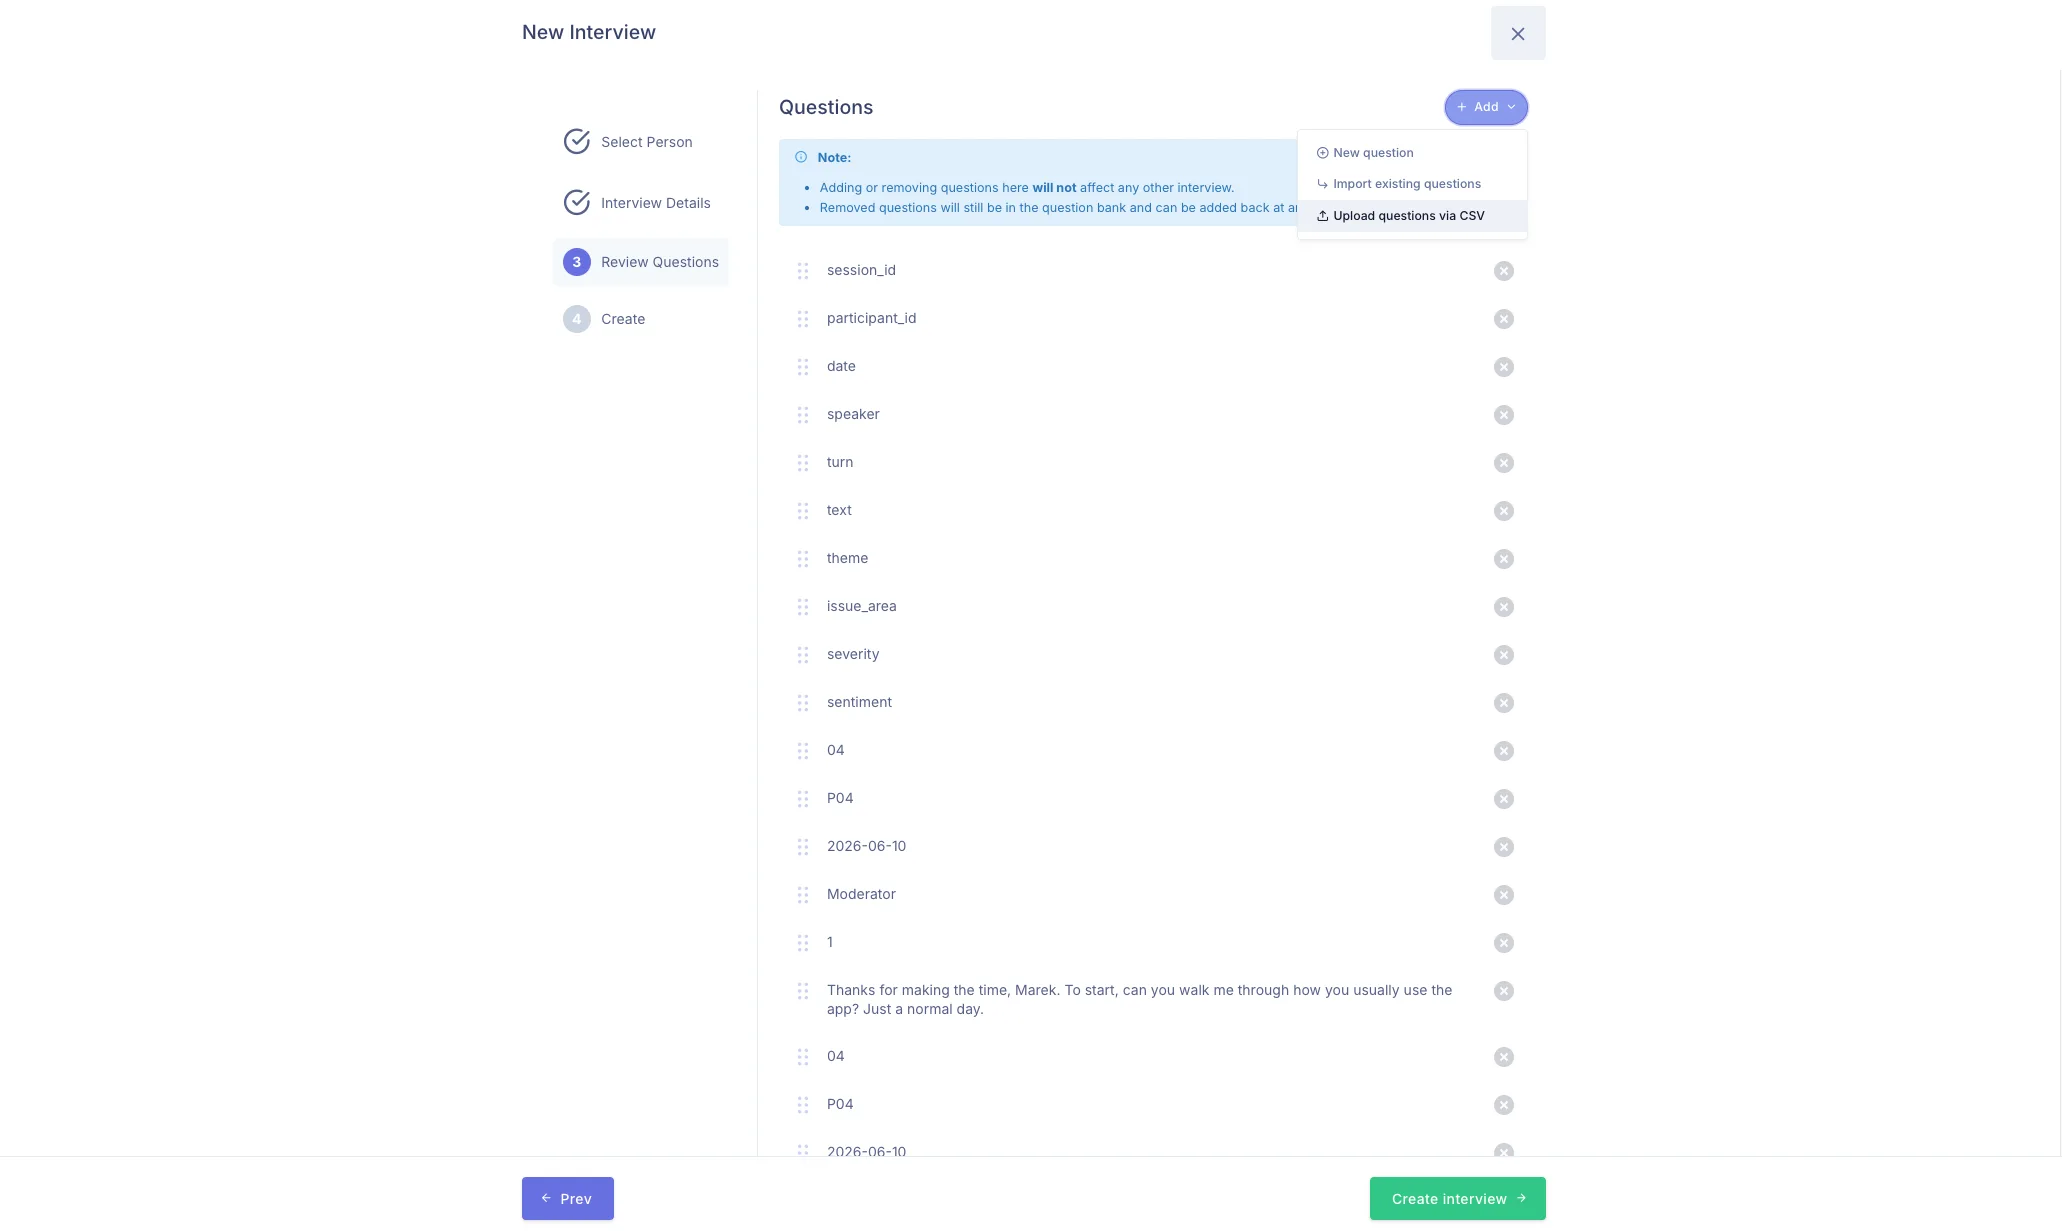
When you upload a CSV manually, you can map its fields, marking which columns are the actual feedback data you want to analyze, while also adding additional attributes to help you classify the data. Attributes like participants’ names or devices used.
To connect a third-party tool, you simply connect with Survicate with each integration (takes a few clicks), and then select them as source data for any relevant project.
Work on a project-basis
From all that connected data (which flows into the Hub in real time), create dedicated projects to answer specific questions. Projects can be one-off and continuous.
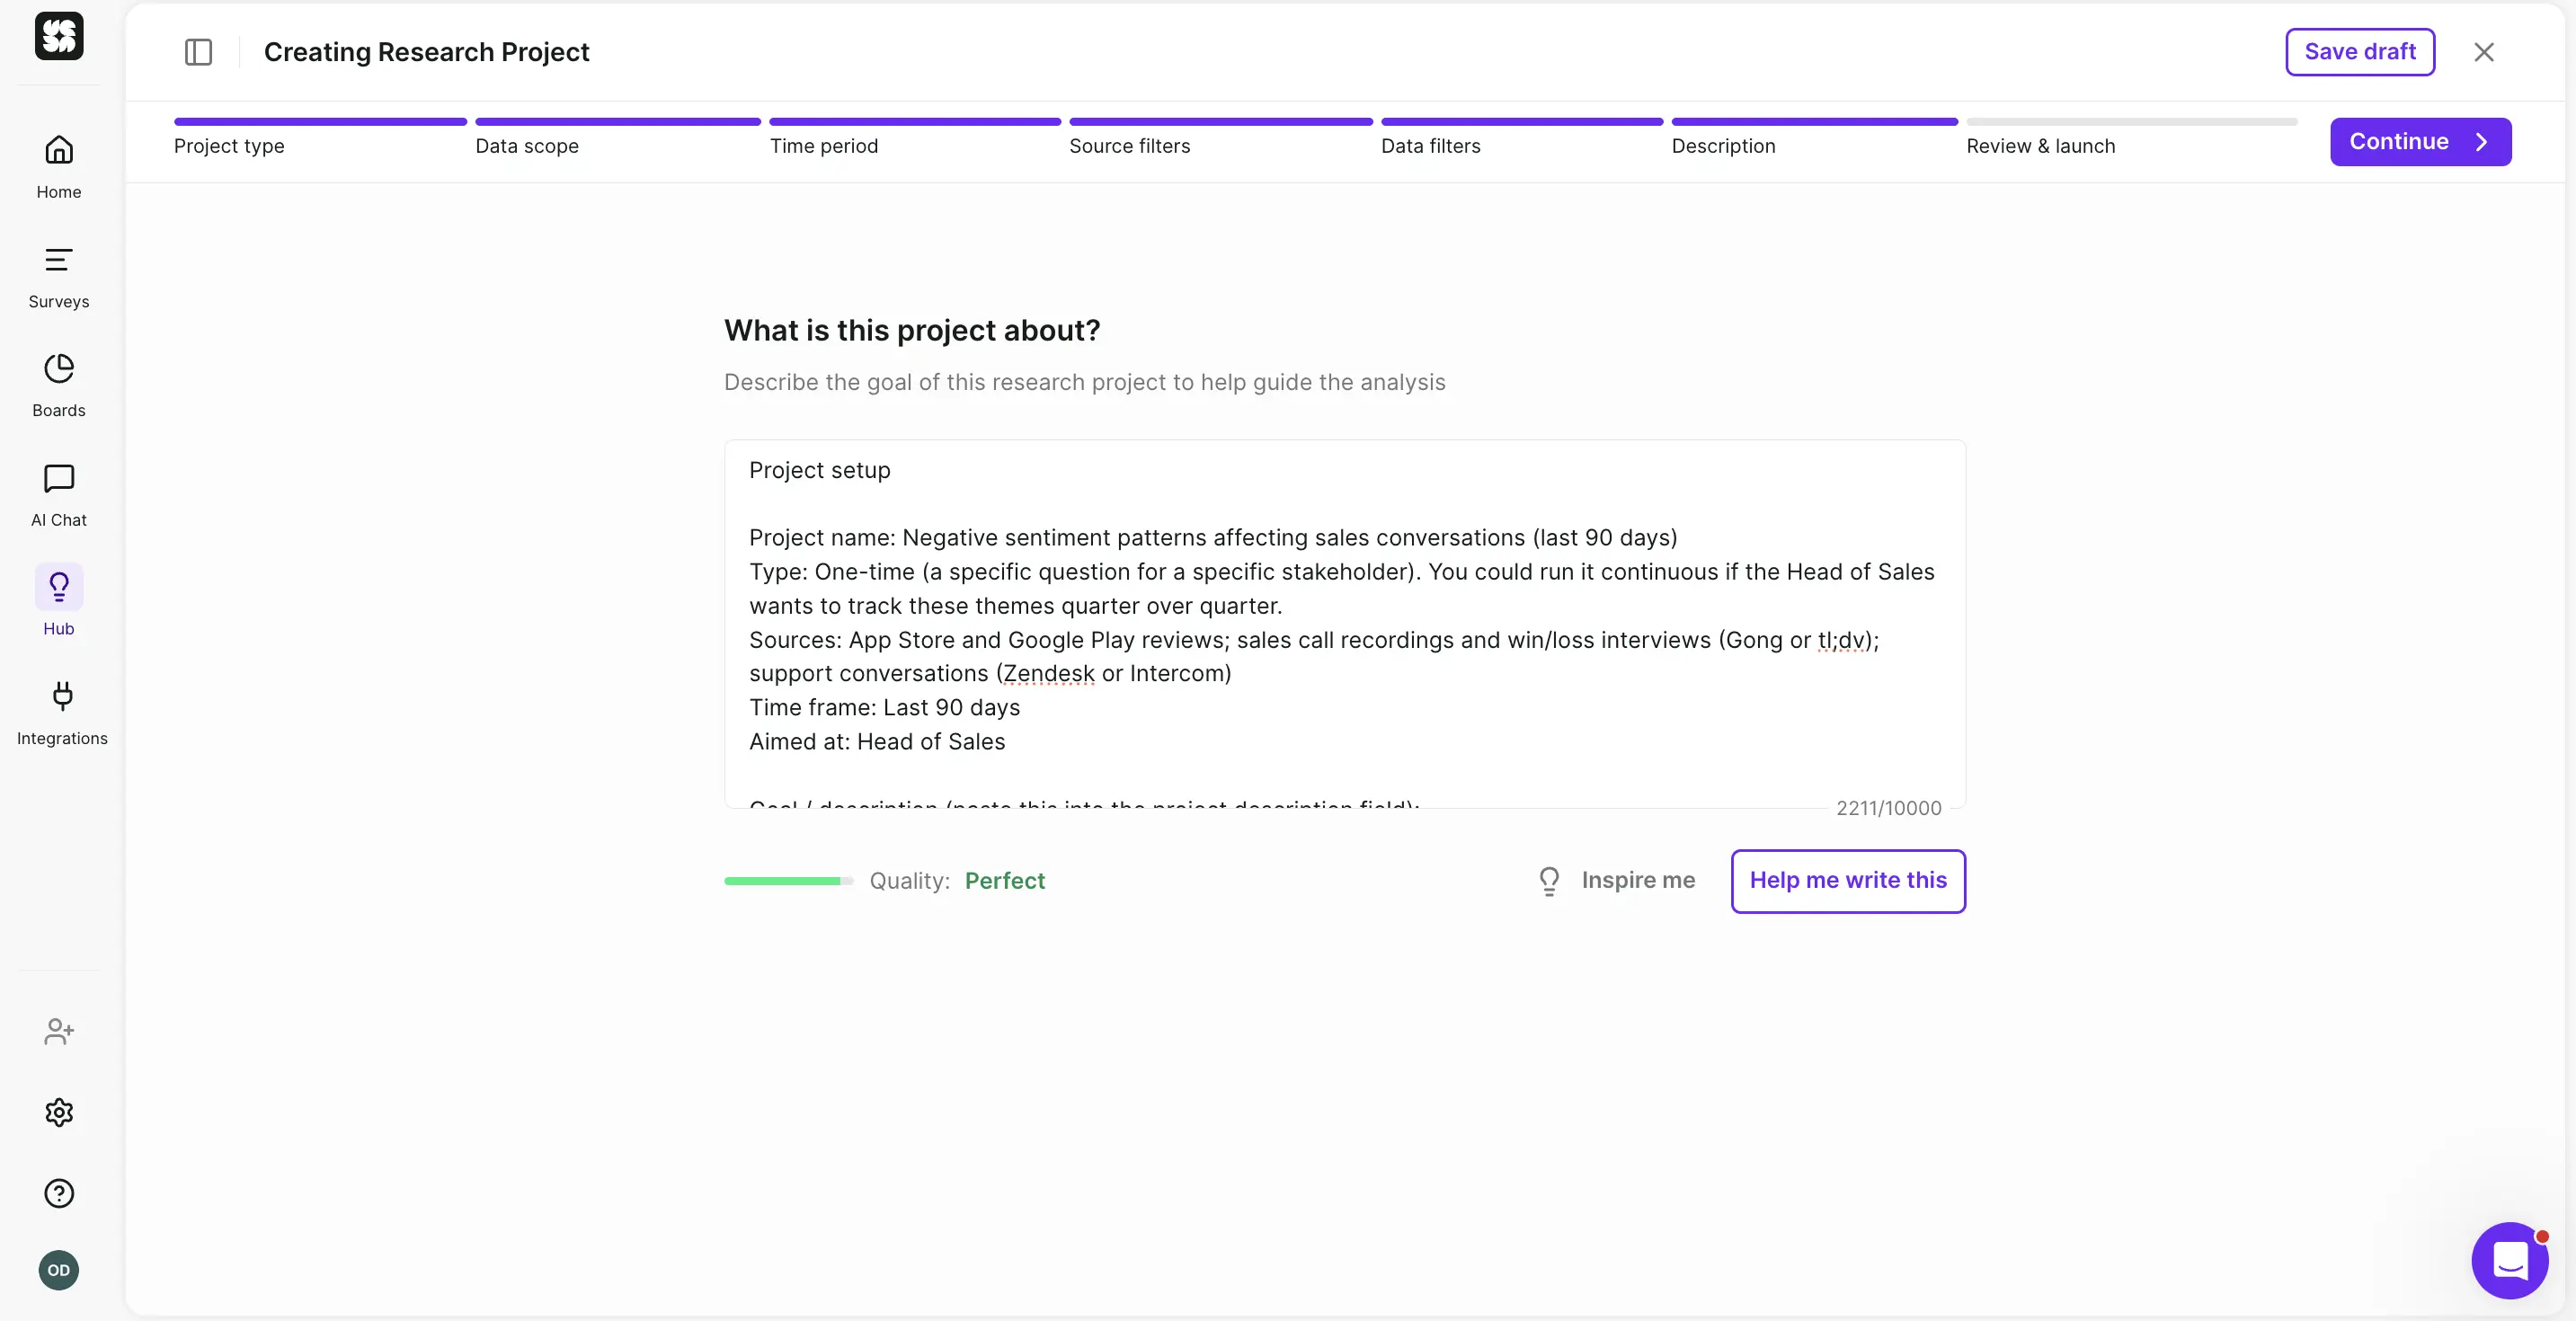
Describe the project’s goals, desired outcome, filter the data, choose the sources you want included, and set the time frames, to make sure the report is exactly what you and your stakeholders need at the time.
Research Hub then does the groundwork of analyzing large batches of data you’ve selected and spots recurring patterns and groups the data into insights in a neat report you can always edit, rejecting insights, directly editing the copy, adding tables, generating charts to visualize patterns.
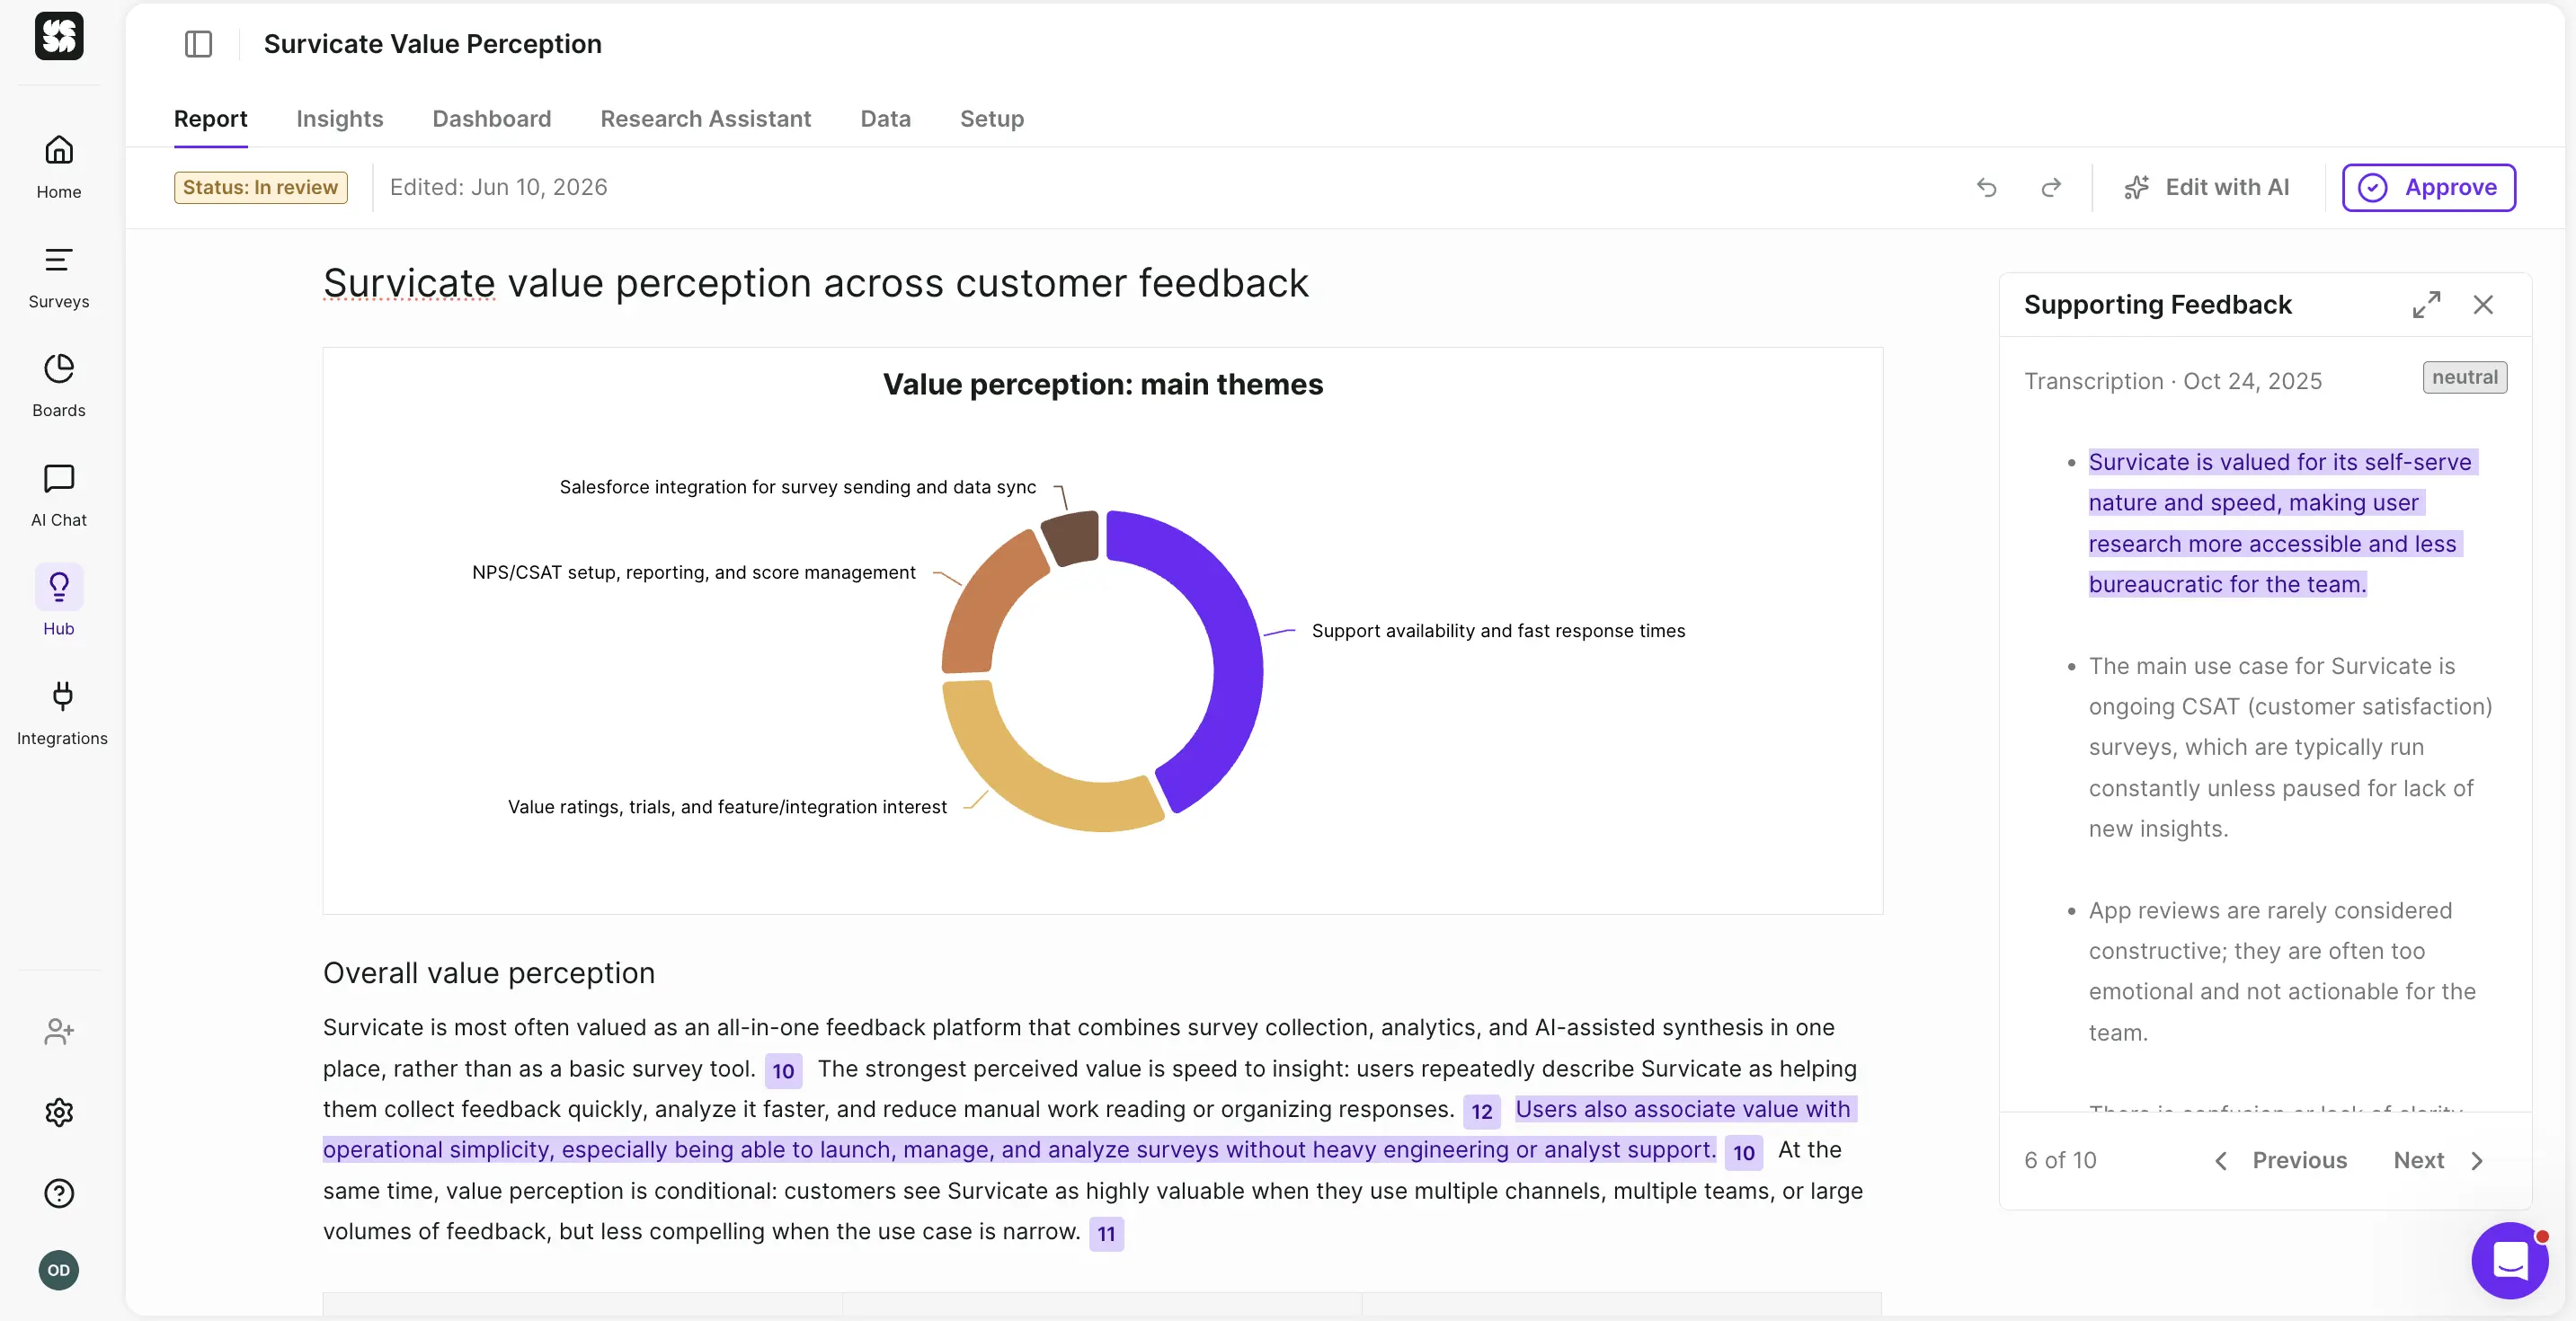
Each insight is backed by exact customer quotes and their source.
One G2 reviewer summed up the strength here as a powerful insight hub with particularly strong topic detection.
A meaningful change in the current version: Research Hub now works at the sentence level. Before passing data to the model, it chunks the data and assigns sentiment and insights to specific sentences, then aggregates the results. That's the main reason findings are more precise and traceable than before, and it sidesteps the "lost in the middle" problem generic LLMs run into.
Add in business context
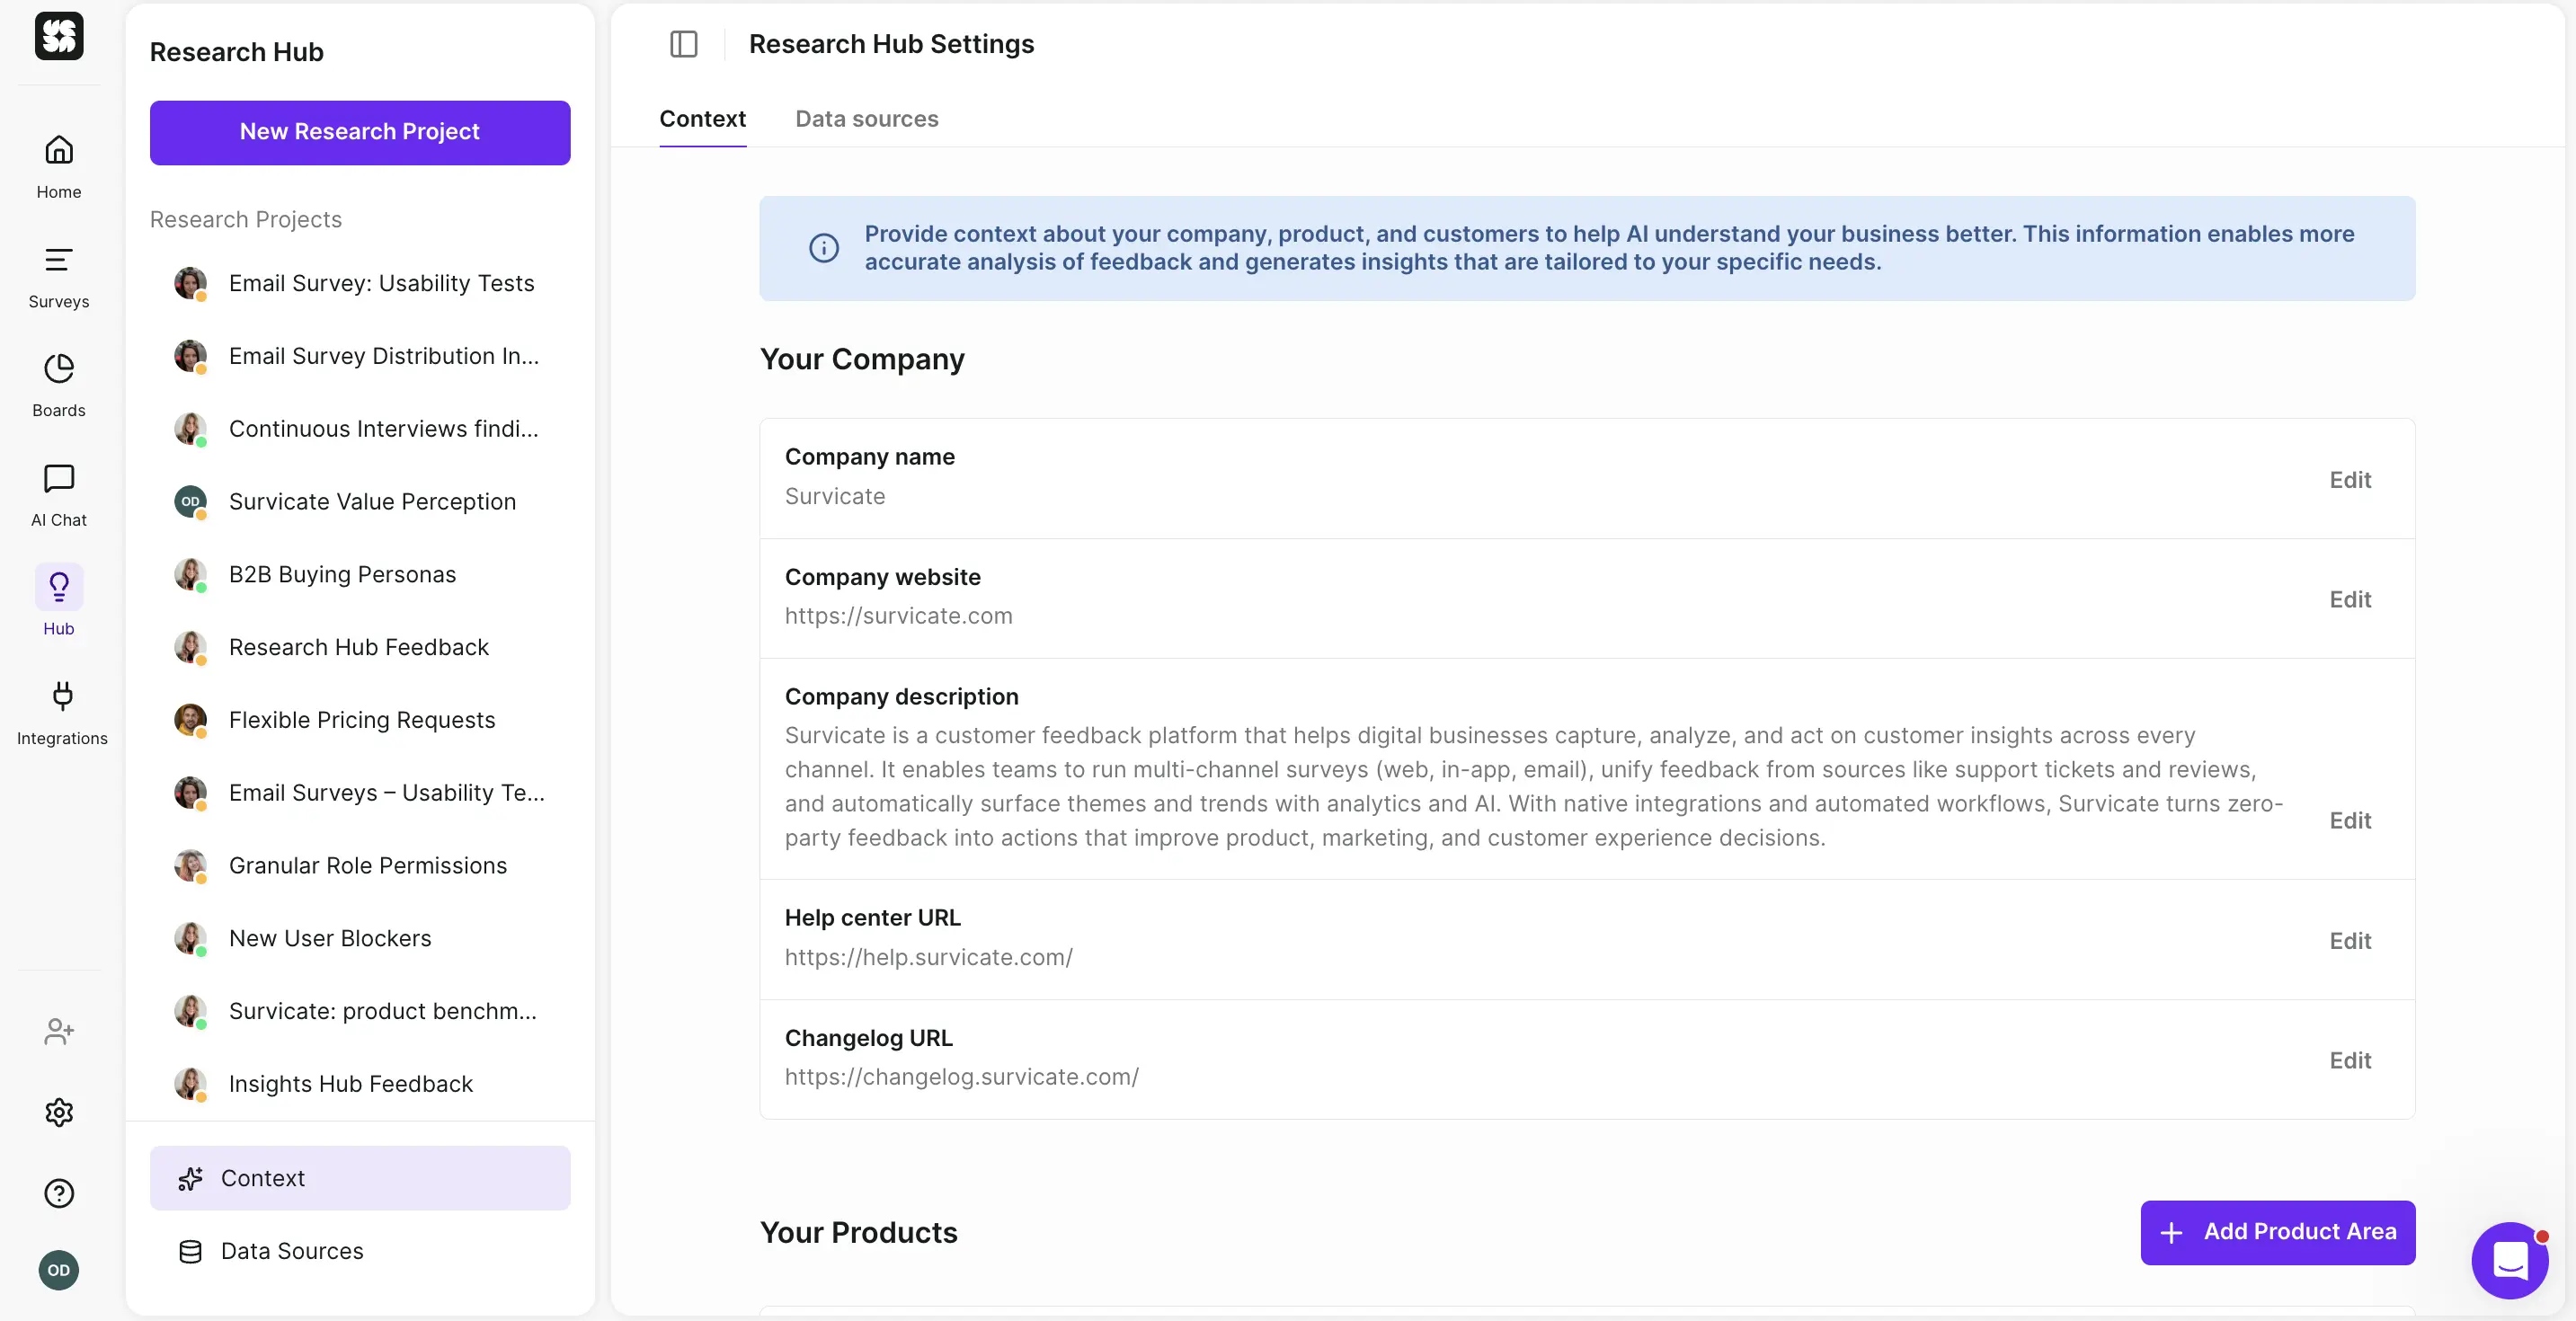
Before you run a project, add your business context once: a short description of your company, your products, and the personas behind your feedback.
Research Hub can even extract a lot of this for you automatically, so you're mostly reviewing and tweaking rather than writing from scratch. Just paste in your website’s URL and it does all the work.
All this context is what then lets the AI frame findings in your terms (your features, your segments, your roadmap, your personas). Instead of generic answers, you get insights that take your business context into account.
It means a complaint about "the export flow" gets read against what that flow actually is.
You set it up one time, and every future project starts with that knowledge already baked in, which is also what keeps continuous projects consistent instead of relearning your business on each run.
Research Assistant (AI Chat)
To dive even deeper into all the connected research repository data, you can also use Survicate’s AI Chat to converse with the source-backed information (not in Beta mode as in many other platforms.)
All responses are backed by exact feedback quotes and sources to avoid any hallucinations whatsoever.
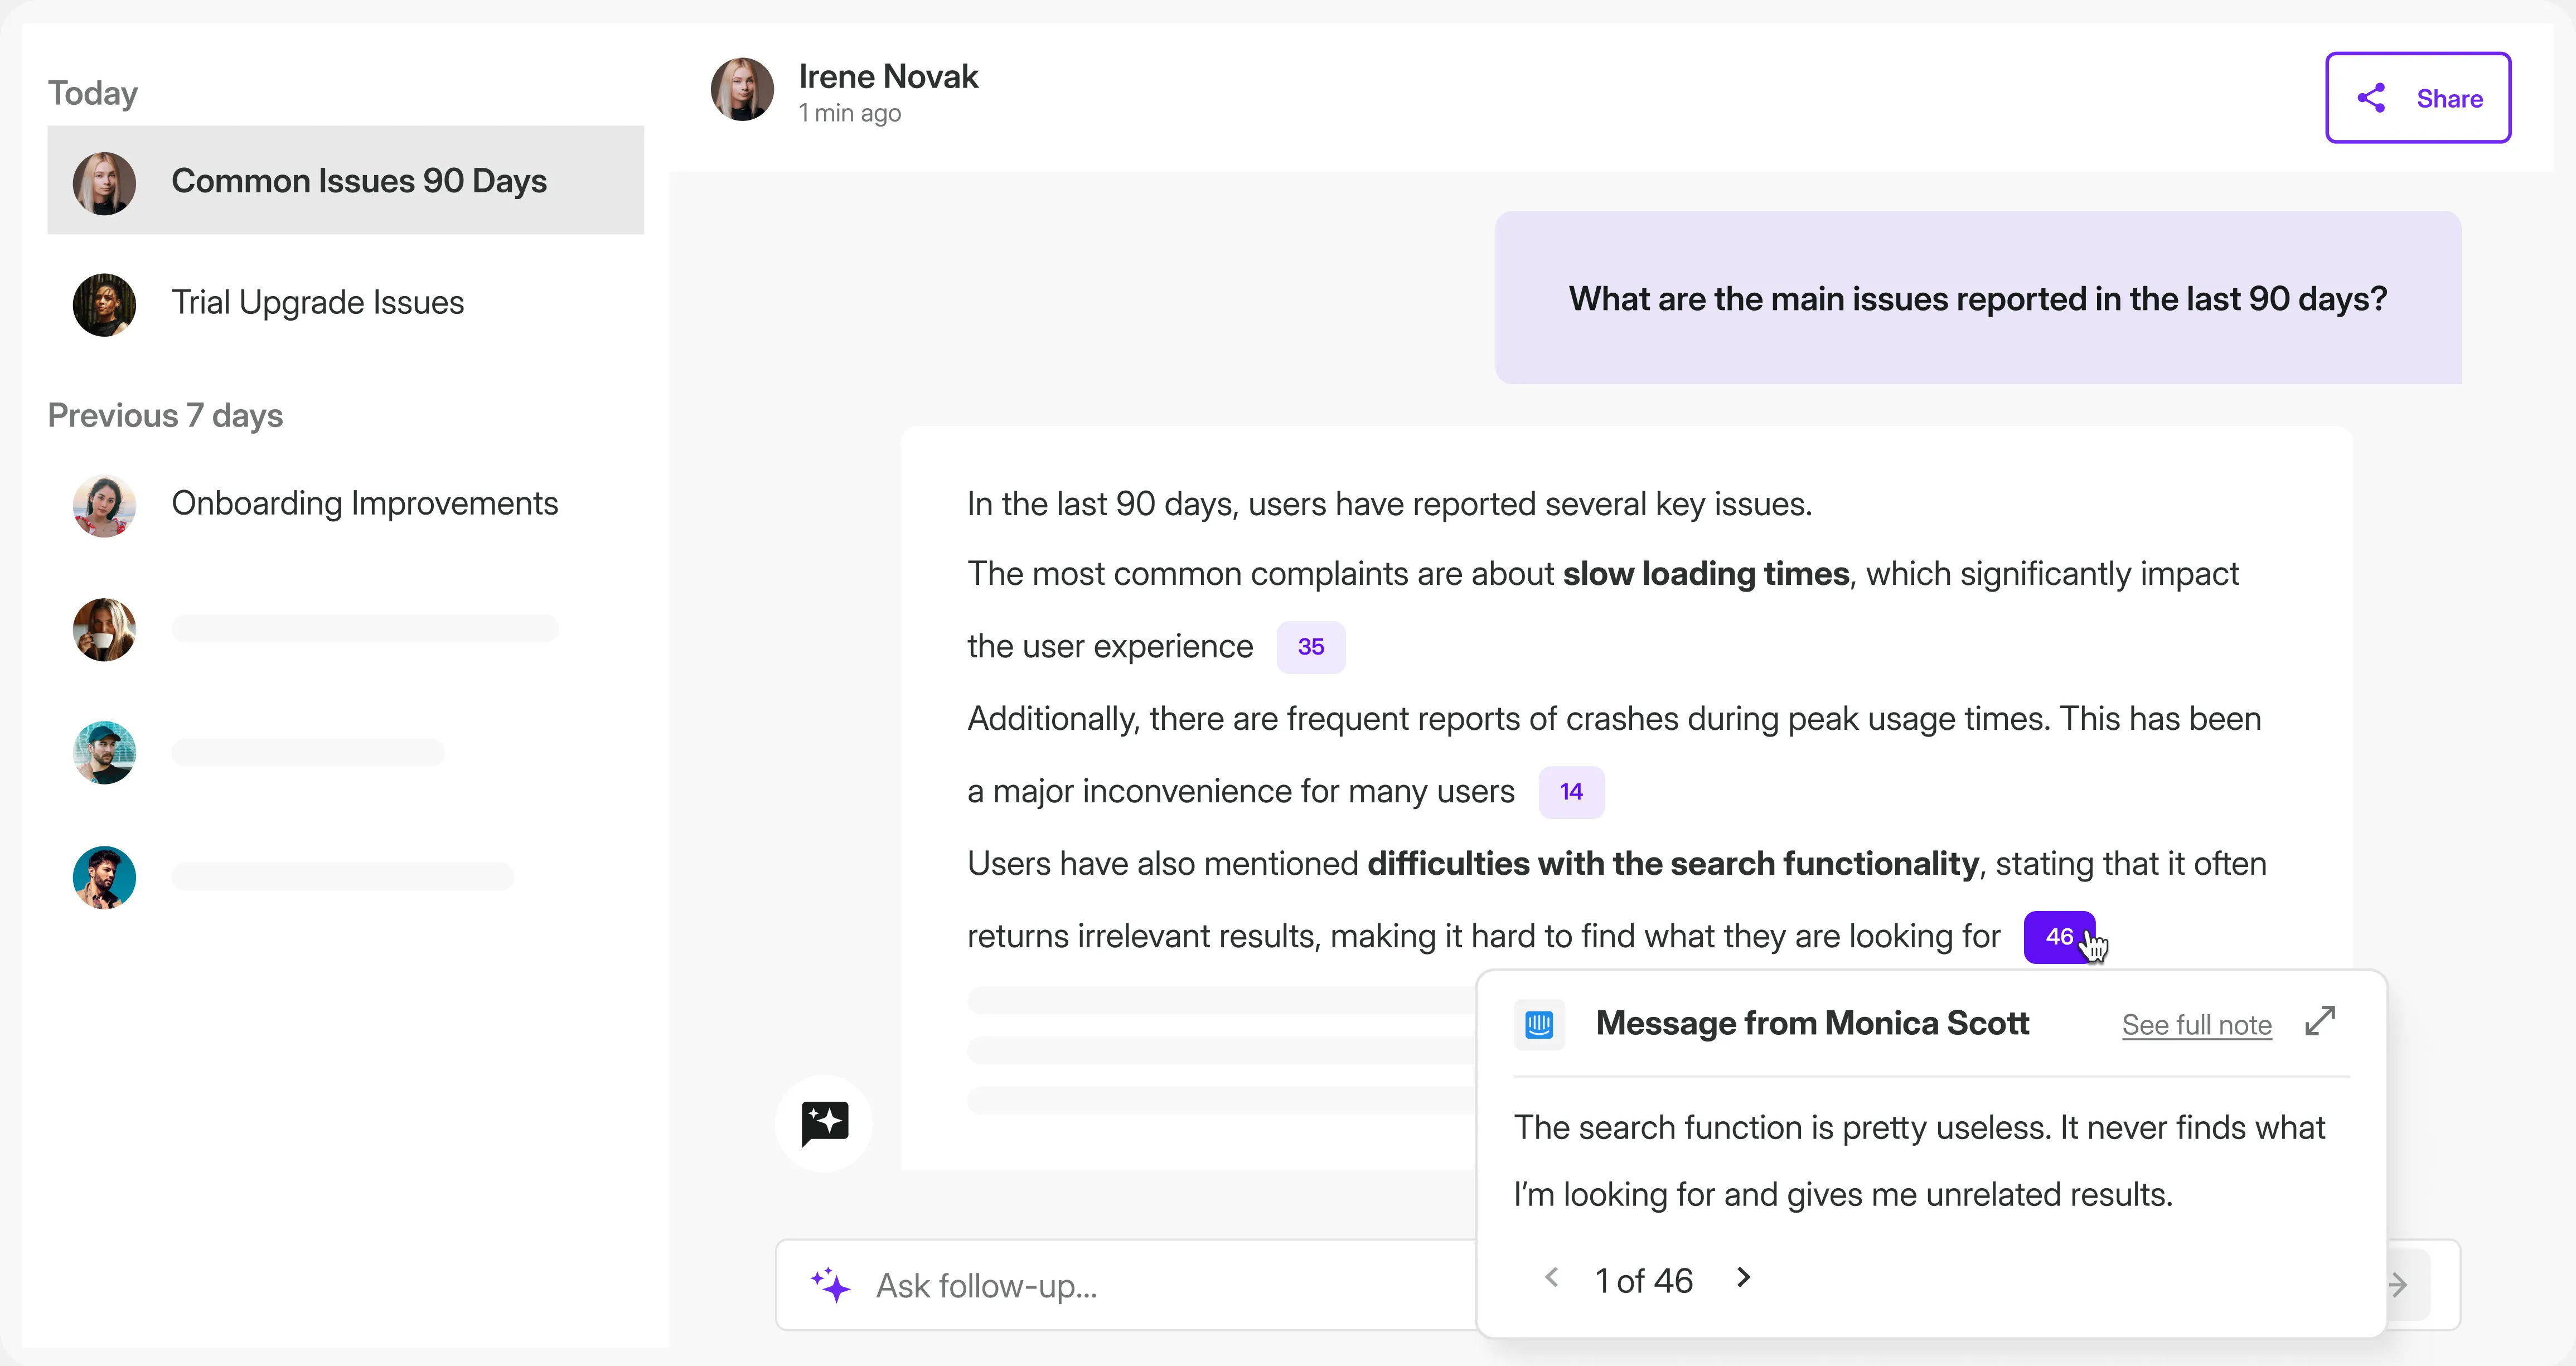
With it, you can ask the AI Chat to compare insights from Q4 interviews on specific topics, like validating a new feature idea from a Product Manager for 2026 with a feature validation survey run at the same time.
AI Chat will give you the answer quickly supported by the exact data sources and data points to help you validate ideas faster and show whether or not your sources all point in the same direction or not.
To narrow down the answers, you can filter the feedback by time range (past year, past quarter, etc.) and exact sources from all connected feedback data.
Sharing insights
We've covered connecting data and analyzing it. Now sharing it.
If you don't want your research scrolled past faster than a boring video on Instagram, the findings have to answer the specific questions your team is asking, and the answers have to come first.
With Survicate there are a few ways to do that (all best with a bit of your own human touch).
You get to invite your team to Survicate so that every stakeholder can review the reports you’ve created.
You can share the generated charts and AI summaries for each pattern alongside your own conclusions by copy-pasting and sending to stakeholders.
You can connect Survicate to Slack so teammates (even those without a Survicate account) can chat with the connected feedback directly in Slack, privately or published for others to react to.
And with Dashboards, you can build custom comparison widgets side by side, then keep that page live and updated so stakeholders self-serve the answers they'd otherwise ping you for.
Turn insights into decisions
As a cherry on top, Survicate connects with 45+ native, one-click integrations that are easy to set up.
Integrations with tools like Fullstory, Mixpanel, and Amplitude let researchers connect behavioral data with survey responses.
You can also automatically build your roadmap by triggering Linear or Zendesk tickets from survey responses, collect more reviews by emailing happy NPS users, or catch churn risks by offering support on Intercom right after an unsatisfying interaction.
This way, feedback and insights doesn't just sit in a dashboard, it all flows into the tools your team already uses.
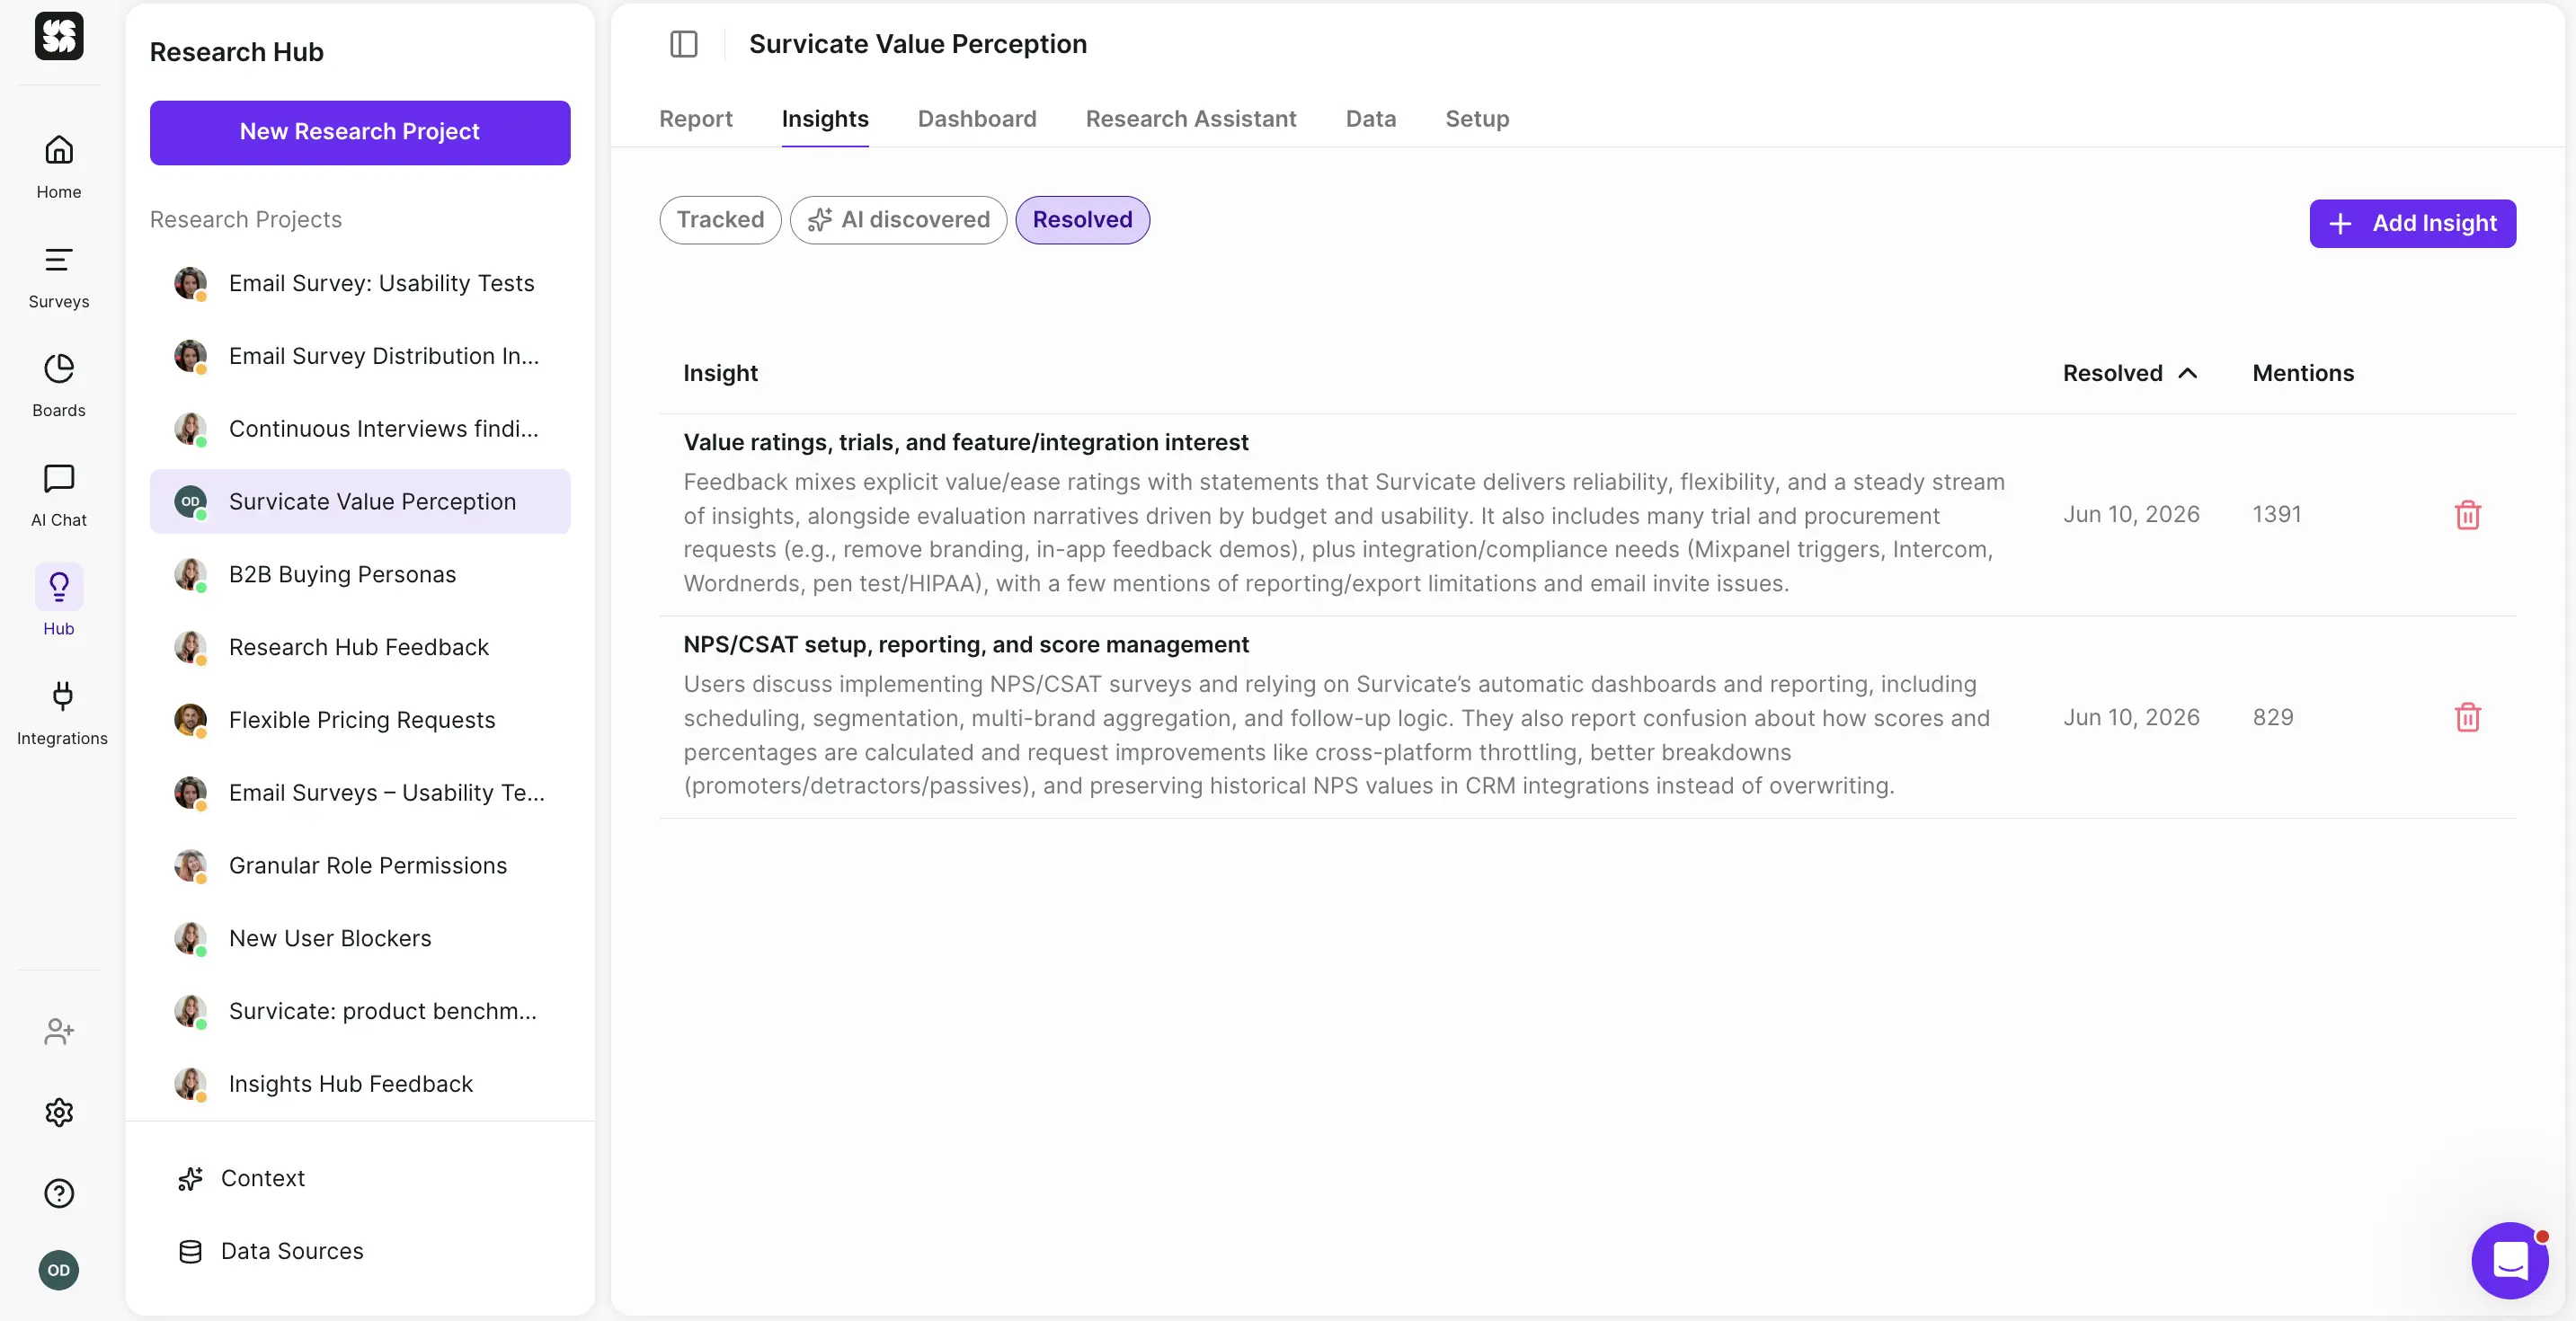
PS, if you decide to track AI-found insights within Research Hub, you can also then mark them as resolved as soon as they influence a given decision. That way, connecting ROI to research may be at least a tad bit easier. 😉
Icing on the cake: advanced, use-case-ready surveys
Even though this guide is about repositories, Survicate's built-in surveys are a real help to researchers, so they're worth a quick mention.
Researchers run surveys for a variety of reasons.
From exploratory research in the learning and discovery phase, aiming to understand users, their needs or specific problems. Even though it’s usually interviews or observations used, surveys can also serve as an additional study method with surveys like:
Following, other phases are also often complimented with surveys. Like validation to get a better understanding of the significance or consistency of findings, especially across a larger sample size with surveys like buying criteria or features prioritization surveys.
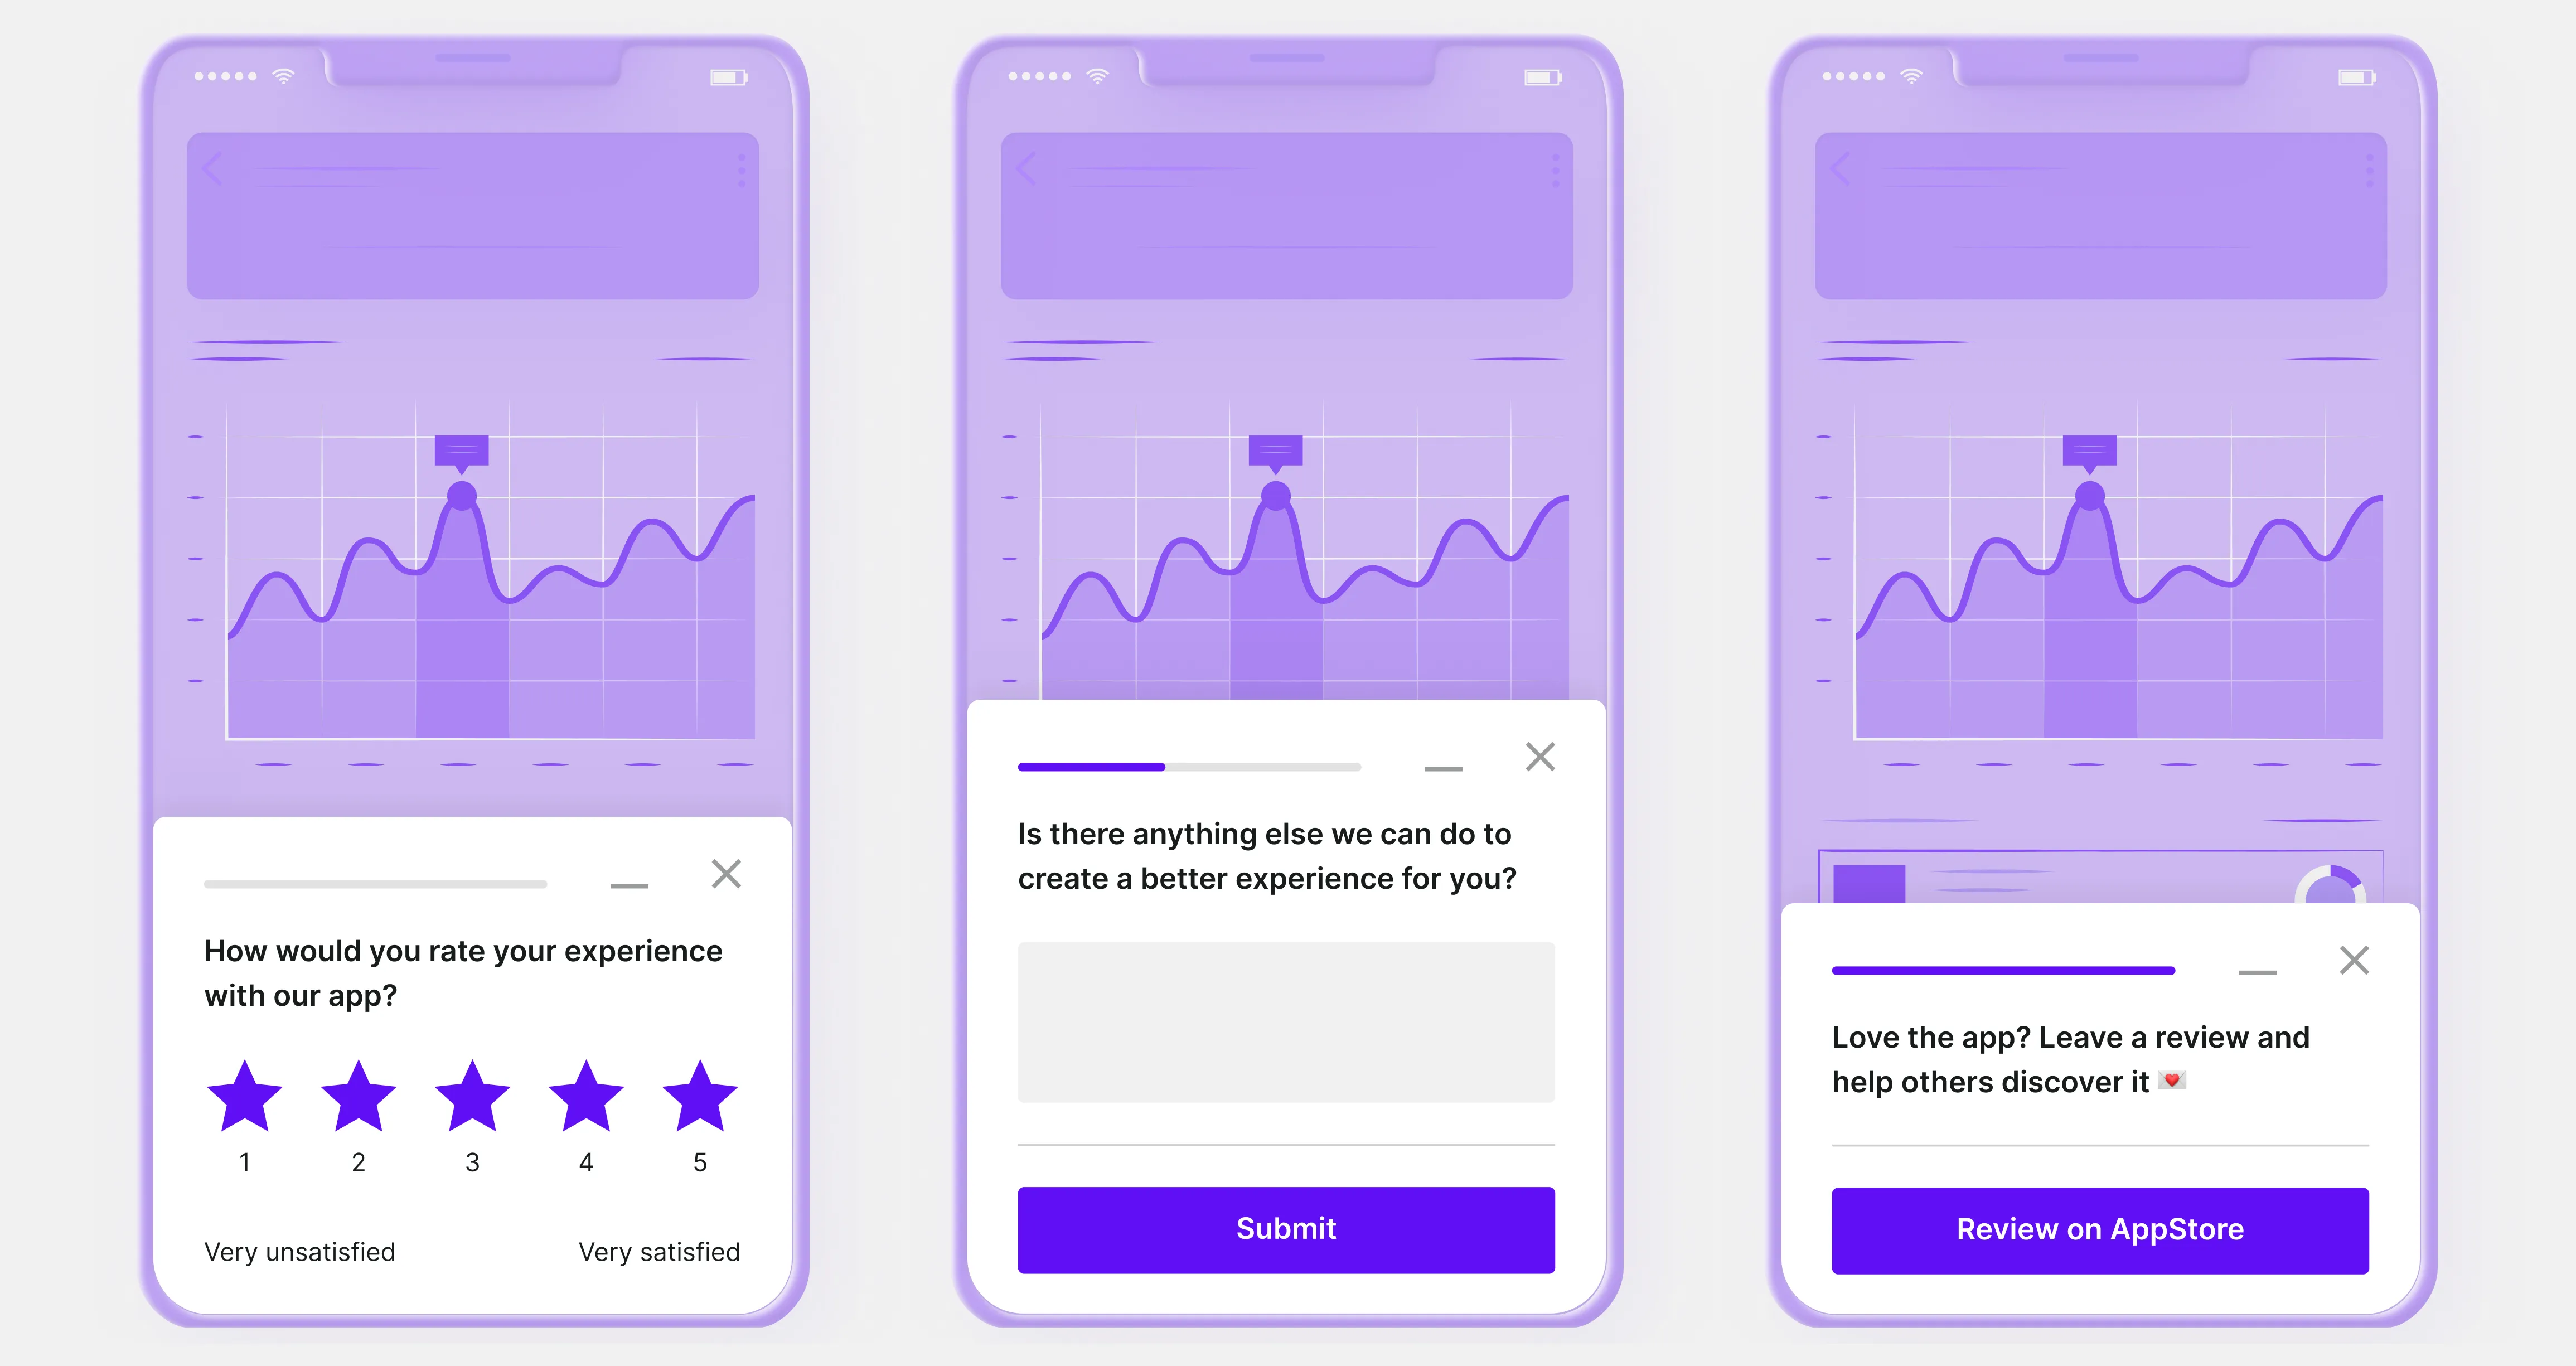
With Survicate, you can create surveys to embed in emails or share via link, or build website and in-product surveys as a pop-up or a sticky Feedback Button.
For mobile apps, Survicate offers SDKs for iOS, Android, React Native, Unity, and Flutter. You can also launch surveys directly in Braze and Intercom.
Targeting is advanced: control visibility by respondent identification, retake permissions, response caps, and link expiry. Trigger surveys by URL or by behavior (exit intent, scroll depth, specific actions), schedule start and end dates, and use anti-fatigue settings so users aren't hit with survey after survey.
To control survey behavior you get advanced logic, from branch logic that routes respondents based on answers to display logic that shows or hides questions to keep things relevant.
And with AI follow-ups, Survicate can ask one or two contextual questions per open-text answer, turning a surface-level "the reporting features" into a real explanation of which capabilities drove the decision.
Ease of use
Our tool is often praised for its modern, intuitive interface that makes data analysis genuinely straightforward, even for users who've struggled with clunky platforms in the past (or chaotic Miro boards and forgotten Google Sheets docs.)
“We have experienced brilliant integration mechanisms from Survicate, more so with numerous analytical tools and this makes it easy to evaluate the feedback shared.” G2 review
Setup and integration are equally simple, with one-click connections (no dev help required) that work smoothly.
Top notch Customer Support
Survicate's Customer Support consistently earns praise for being exceptionally responsive and genuinely helpful.
Users describe our Support team as "stellar" and "incredibly responsive," with many highlighting how they provide real conversations rather than templated responses.
The team is known for going the extra mile, not just solving problems quickly, but being creative and focused on helping customers work as effectively as possible.
“Their customer support is stellar, without a doubt one of the best teams I have ever interacted with.” G2 review
Our numbers back this up: in Q1 2026, Survicate's support team maintained a 97.6% CSAT score while handling 1,669 customer conversations. The median first response time was 3 minutes and 42 seconds, with an overall median response time of 4 minutes and 21 seconds, so you get help quickly when you reach out.
Pros and cons
Pros:
- Covers the full loop: collect (surveys), analyze (Research Hub), and act (45+ integrations) in one platform
- Traceable AI, with every insight and report claim linked to an exact quote and source
- Surveys built in, which most repositories don't have
- Genuinely easy interface and fast, human support
- Affordable relative to the category (Vendr median under $8k/year)
Cons:
- Not the most video-native option if your research is mostly interview recordings (Dovetail leans more that way). You can upload call transcripts, but not necessarily video clips just yet.
- Deepest value shows up once you connect multiple sources, so single-source users see less of it
My hot take: when Survicate isn't the right fit
I'm on the team at Survicate, which is why I know our weak spots well enough to tell you when a competitor is the better pick.
If your research is almost entirely video, with highlight reels and clip-heavy interview workflows at the center of everything, Dovetail's video-native experience is more purpose-built than ours. Especially if you’re after actually putting video clips into the repository, instead of transcripts as you can in Survicate.
If you're a solo researcher or a small agency on the tightest possible budget and you mostly upload files rather than connect live sources, UserBit or NotebookLM will cost you less.
Where Survicate wins is the combination: surveys, a traceable AI repository, and the integrations to act on what you find, without enterprise pricing or complexity.
Dovetail
.webp)
Dovetail is an AI-powered customer intelligence platform that aggregates feedback from multiple sources and turns it into strategic insights. So, a research repository.
Launched in 2017 by Benjamin Humphrey and Bradley Ayers, the platform is used by companies like Atlassian, The New York Times, Spotify, Universal, and Starbucks, operating with 100+ team members between Sydney and San Francisco.
The platform integrates with your existing channels, applies AI to surface patterns and themes, then delivers centralized insights across your organization (similar to Survicate), but not as presentable UI-wise.
It also focuses heavily on call transcription and gives you the option to create specific research projects.
What researchers should know: Dovetail won't help you build or send surveys, it's designed for what happens after data collection. If you need both survey distribution and analysis, you'll need a separate tool for gathering responses.
Pricing
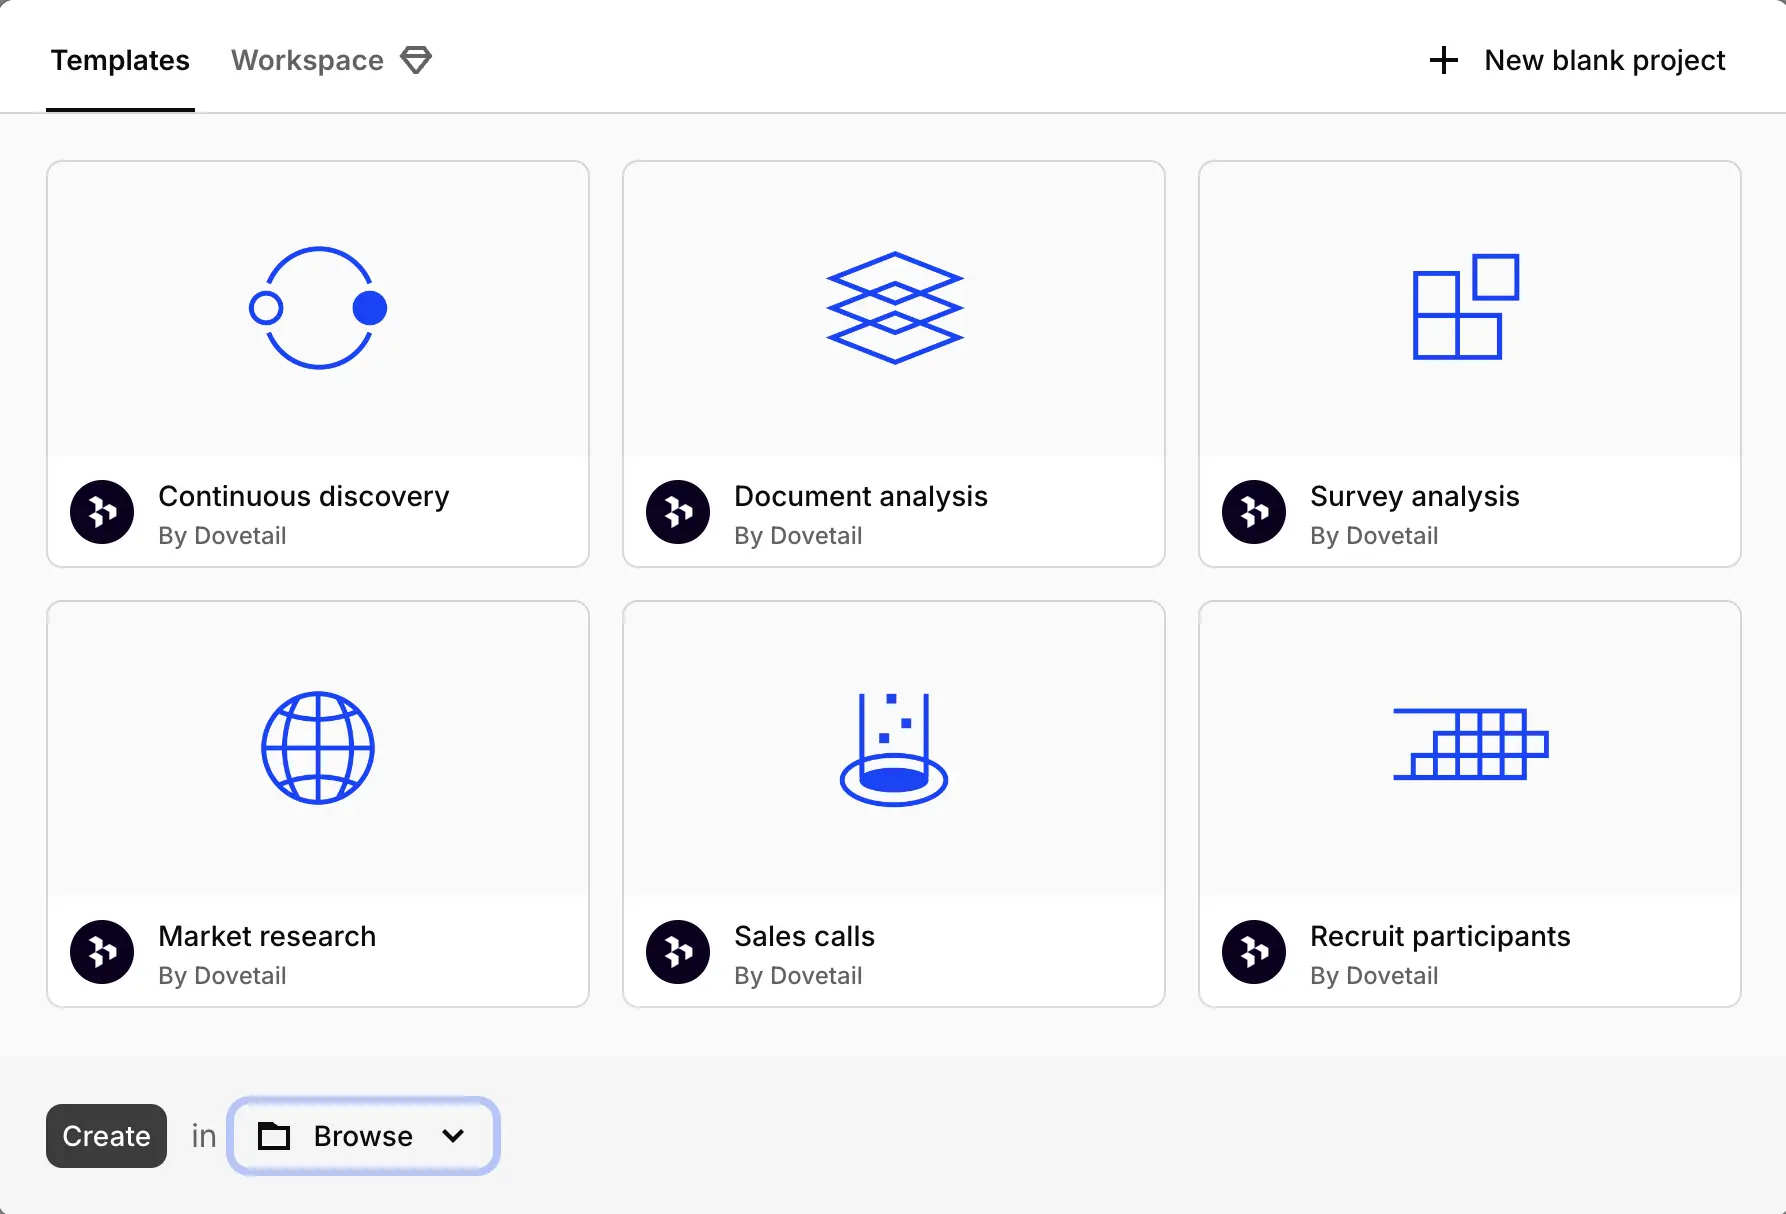
Dovetail offers three tiers that scale from individual researchers to enterprise teams.
The Free plan gives you one channel for automatic feedback classification, one project for analyzing calls, recordings, documents and surveys, plus basic AI chat for questions and summaries within that project.
Professional starts at $15 per user per month (billed annually, saving 25% vs. monthly) and includes unlimited projects, unlimited channels as paid add-ons, advanced analysis tools like charts and filters, and enhanced AI features including cross-project summaries and semantic search.
Enterprise offers custom pricing with unlimited free viewers (read and comment access), AI chat in Slack and Teams, organization-wide features like folders and global templates, advanced AI including custom vocabulary and 75-language translation, plus security controls, priority support, and dedicated customer success.
The critical factor for Researchers: Dovetail charges separately for data points—the individual pieces of feedback you analyze. For example, 500 data points cost $50/month (billed annually). This means your actual costs scale with feedback volume, not just team size, so analyzing large datasets from surveys or user interviews can get expensive quickly beyond your base subscription.
.webp)
This is clearly reflected in the median price users pay for Dovetail (according to Vendr), which is over $22, 000. Compared with Survicate above, it’s almost three times more expensive.
Features overview
Let’s now dive into exact features and our experience testing Dovetail.
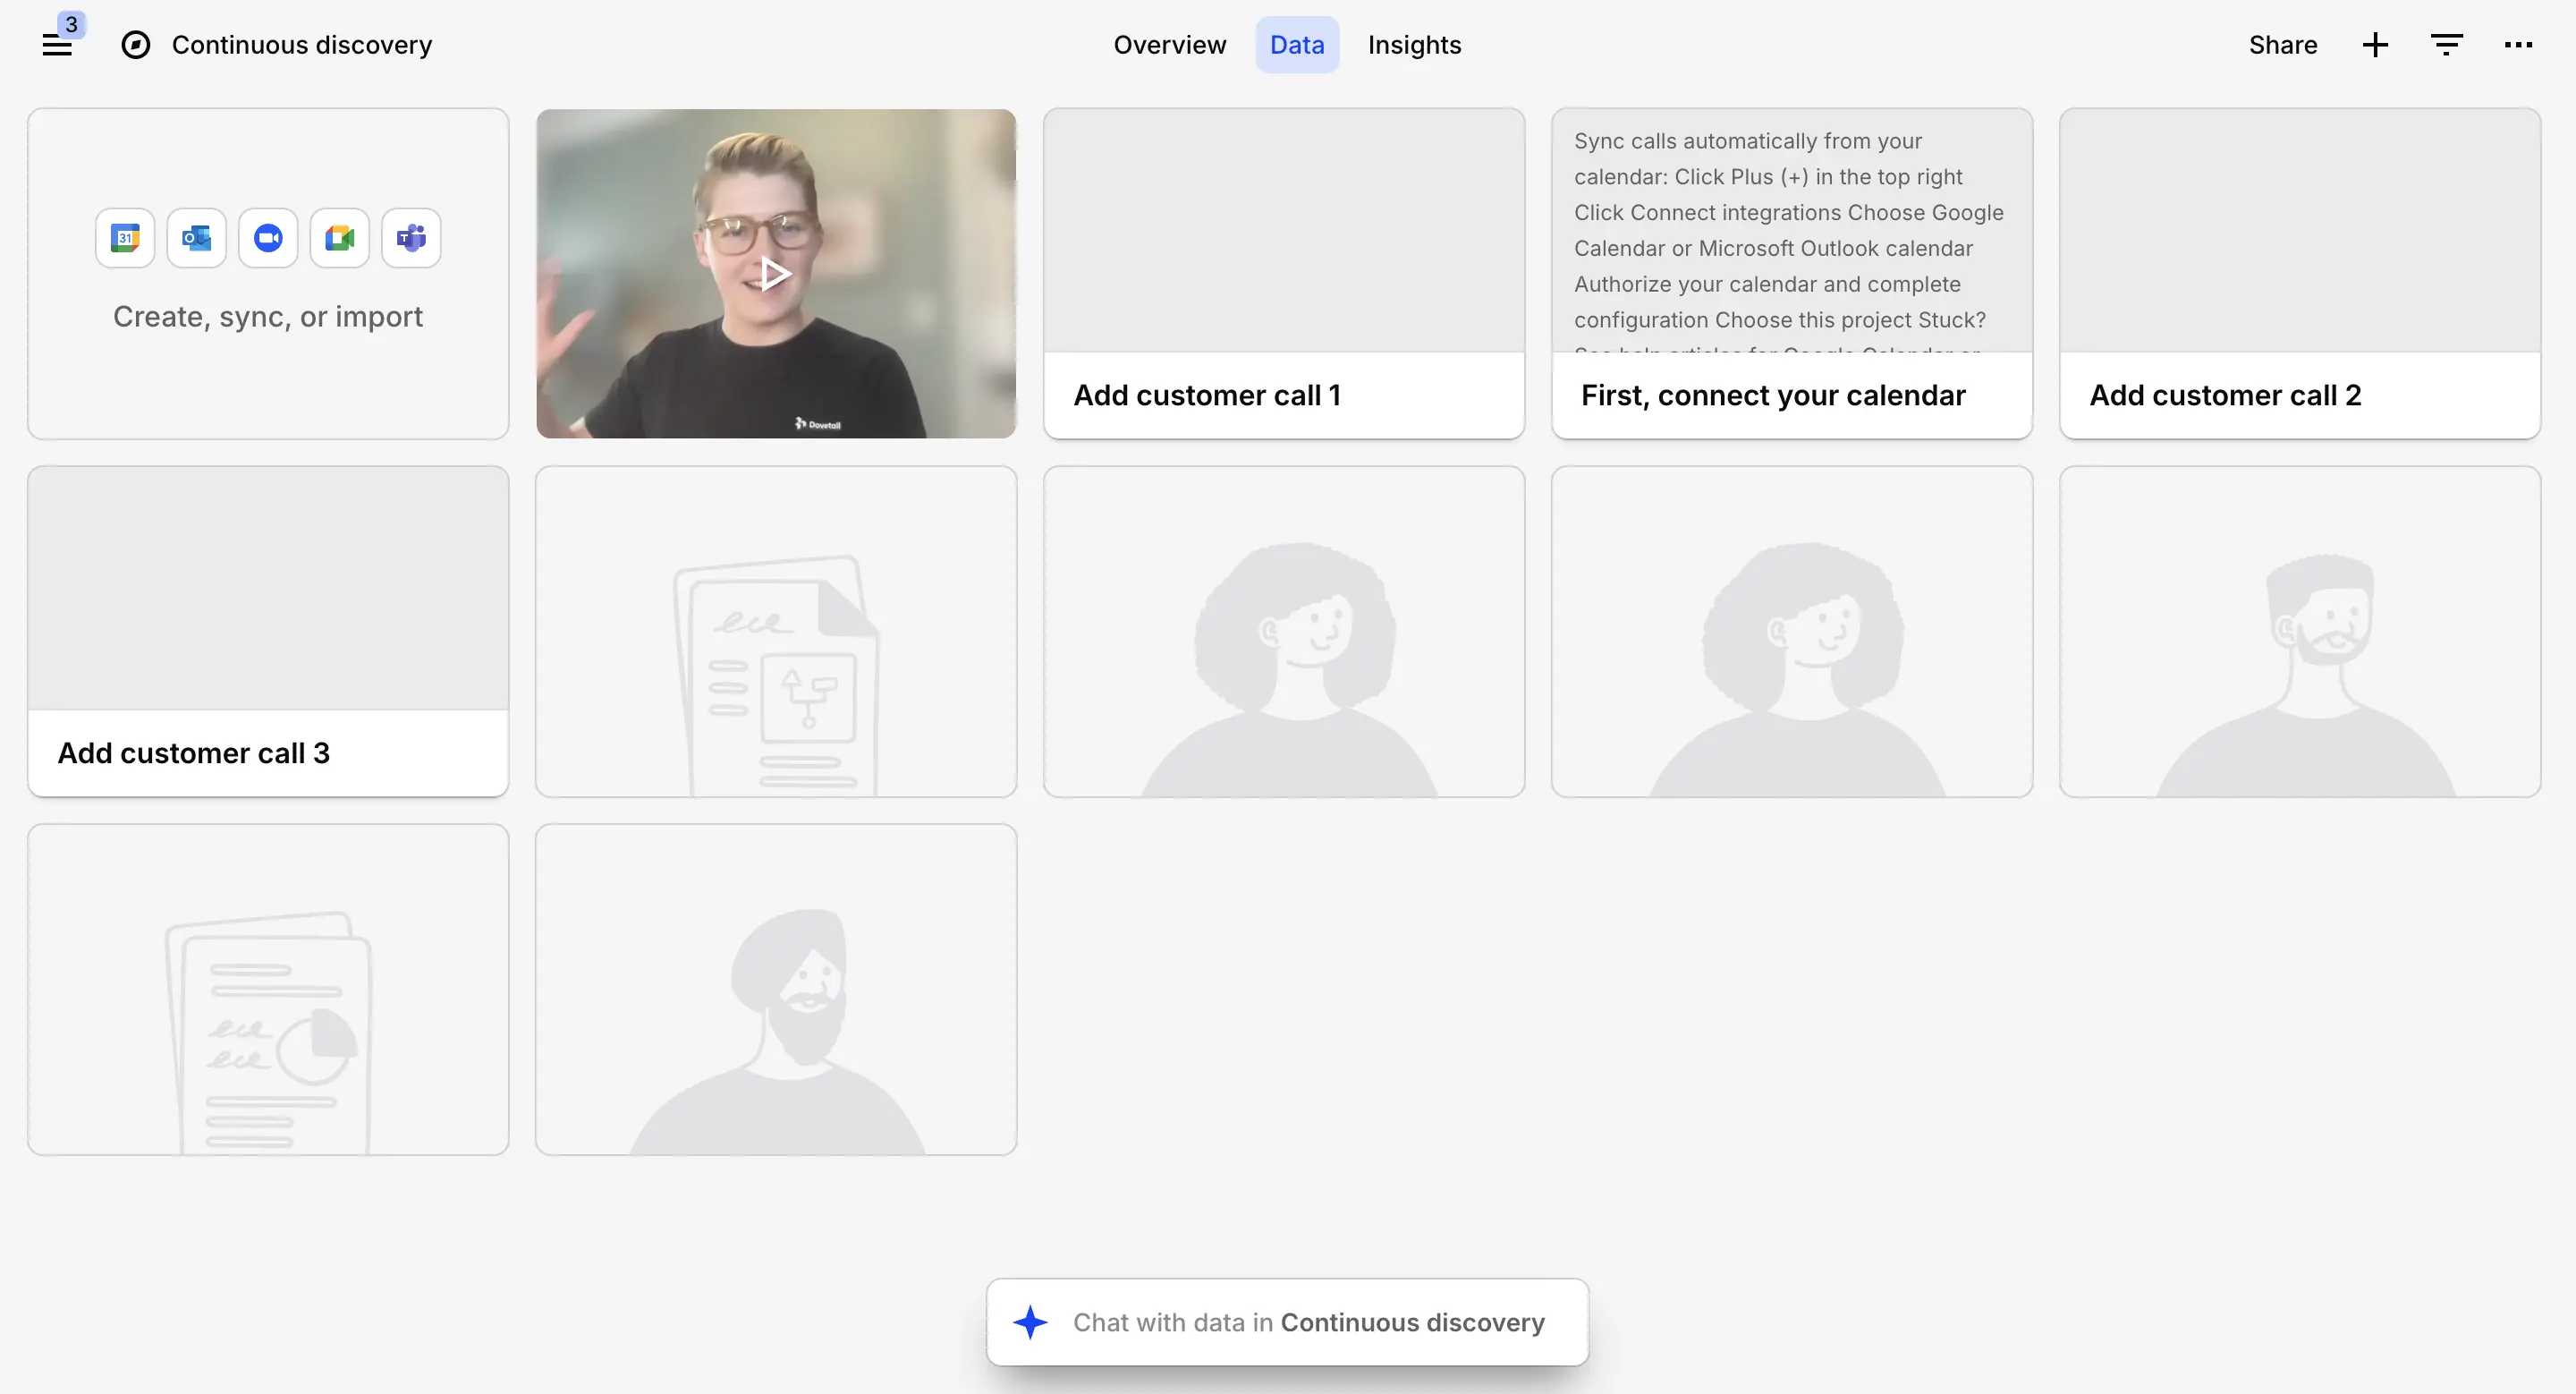
Channels
Channels is the main area of the Dovetail platform, right where you get to connect your research data sources.
And the sources you can choose to connect are:
- Support ticket platforms, including Front, Intercom, Jira Service Management, Freshdesk, HubSpot Service Hub, and Zendesk,
- App reviews: Google Play store, Apple App store, and G2,
- In-product feedback collected via Pendo,
- Call transcription platform, Gong,
- Feedback tool that has an integration with Zapier, or via Dovetail’s Public API (Dovetail integrates with Qualtrics for example).
Making it a total of 12 direct data integrations, not counting csv uploads or connecting a tool with Zapier or Dovetail’s API.
.webp)
Now, once connected, Channels will classify and track themes across integrated or uploaded data sets, monitoring the data in real time.
.webp)
A theme in Dovetail is a collection of related data points with a specified title. The platform's technology uses AI built on models from Anthropic, processing data without of course training any on your information.
What’s crucial to bring up is the fact that Professional and Enterprise workspaces can import up to 250 data points per month (which is not a whole lot), with the option to purchase additional capacity through Settings → Billing.
Although fairly easy to use and all set up on a modern interface, we did face a few limitations with Dovetail.
For one, the processing time, which can be quite significant. The AI analysis takes a while to complete, and you may need to wait a bit before insights become available. We’ve tested a quite small sample size, so it could become an issue particularly when analyzing larger datasets.
For two, CSV upload and field mapping is a little bit limited.
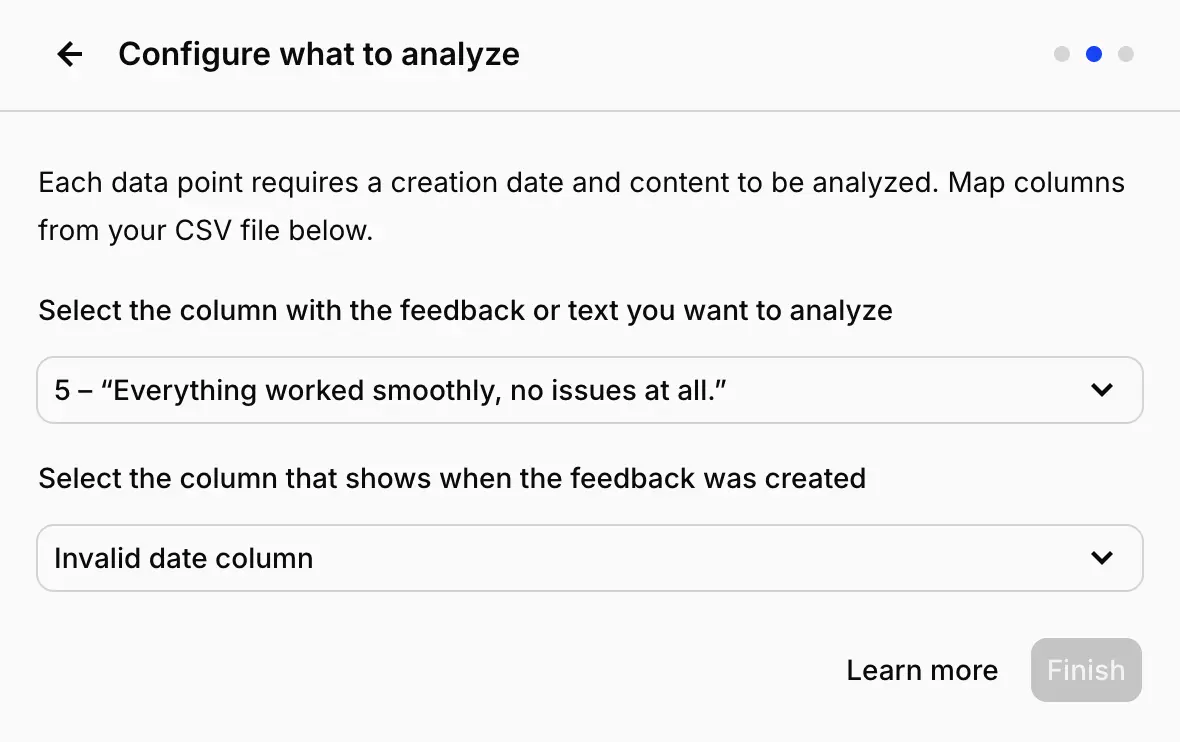
The data import workflow has some inflexible requirements that don't always match real-world datasets.
Dovetail mandates field mapping for certain attributes (like timestamps) regardless of whether they exist in your source data. If your feedback doesn't naturally include dates, you're still required to create or assign that field before importing.
Similarly, if you connect CSV columns that lack headers to Dovetail fields, those mappings will show up without labels in the platform, creating confusion when you're trying to interpret your data later.
Insights visualization in Channels suffers from readability issues, too.
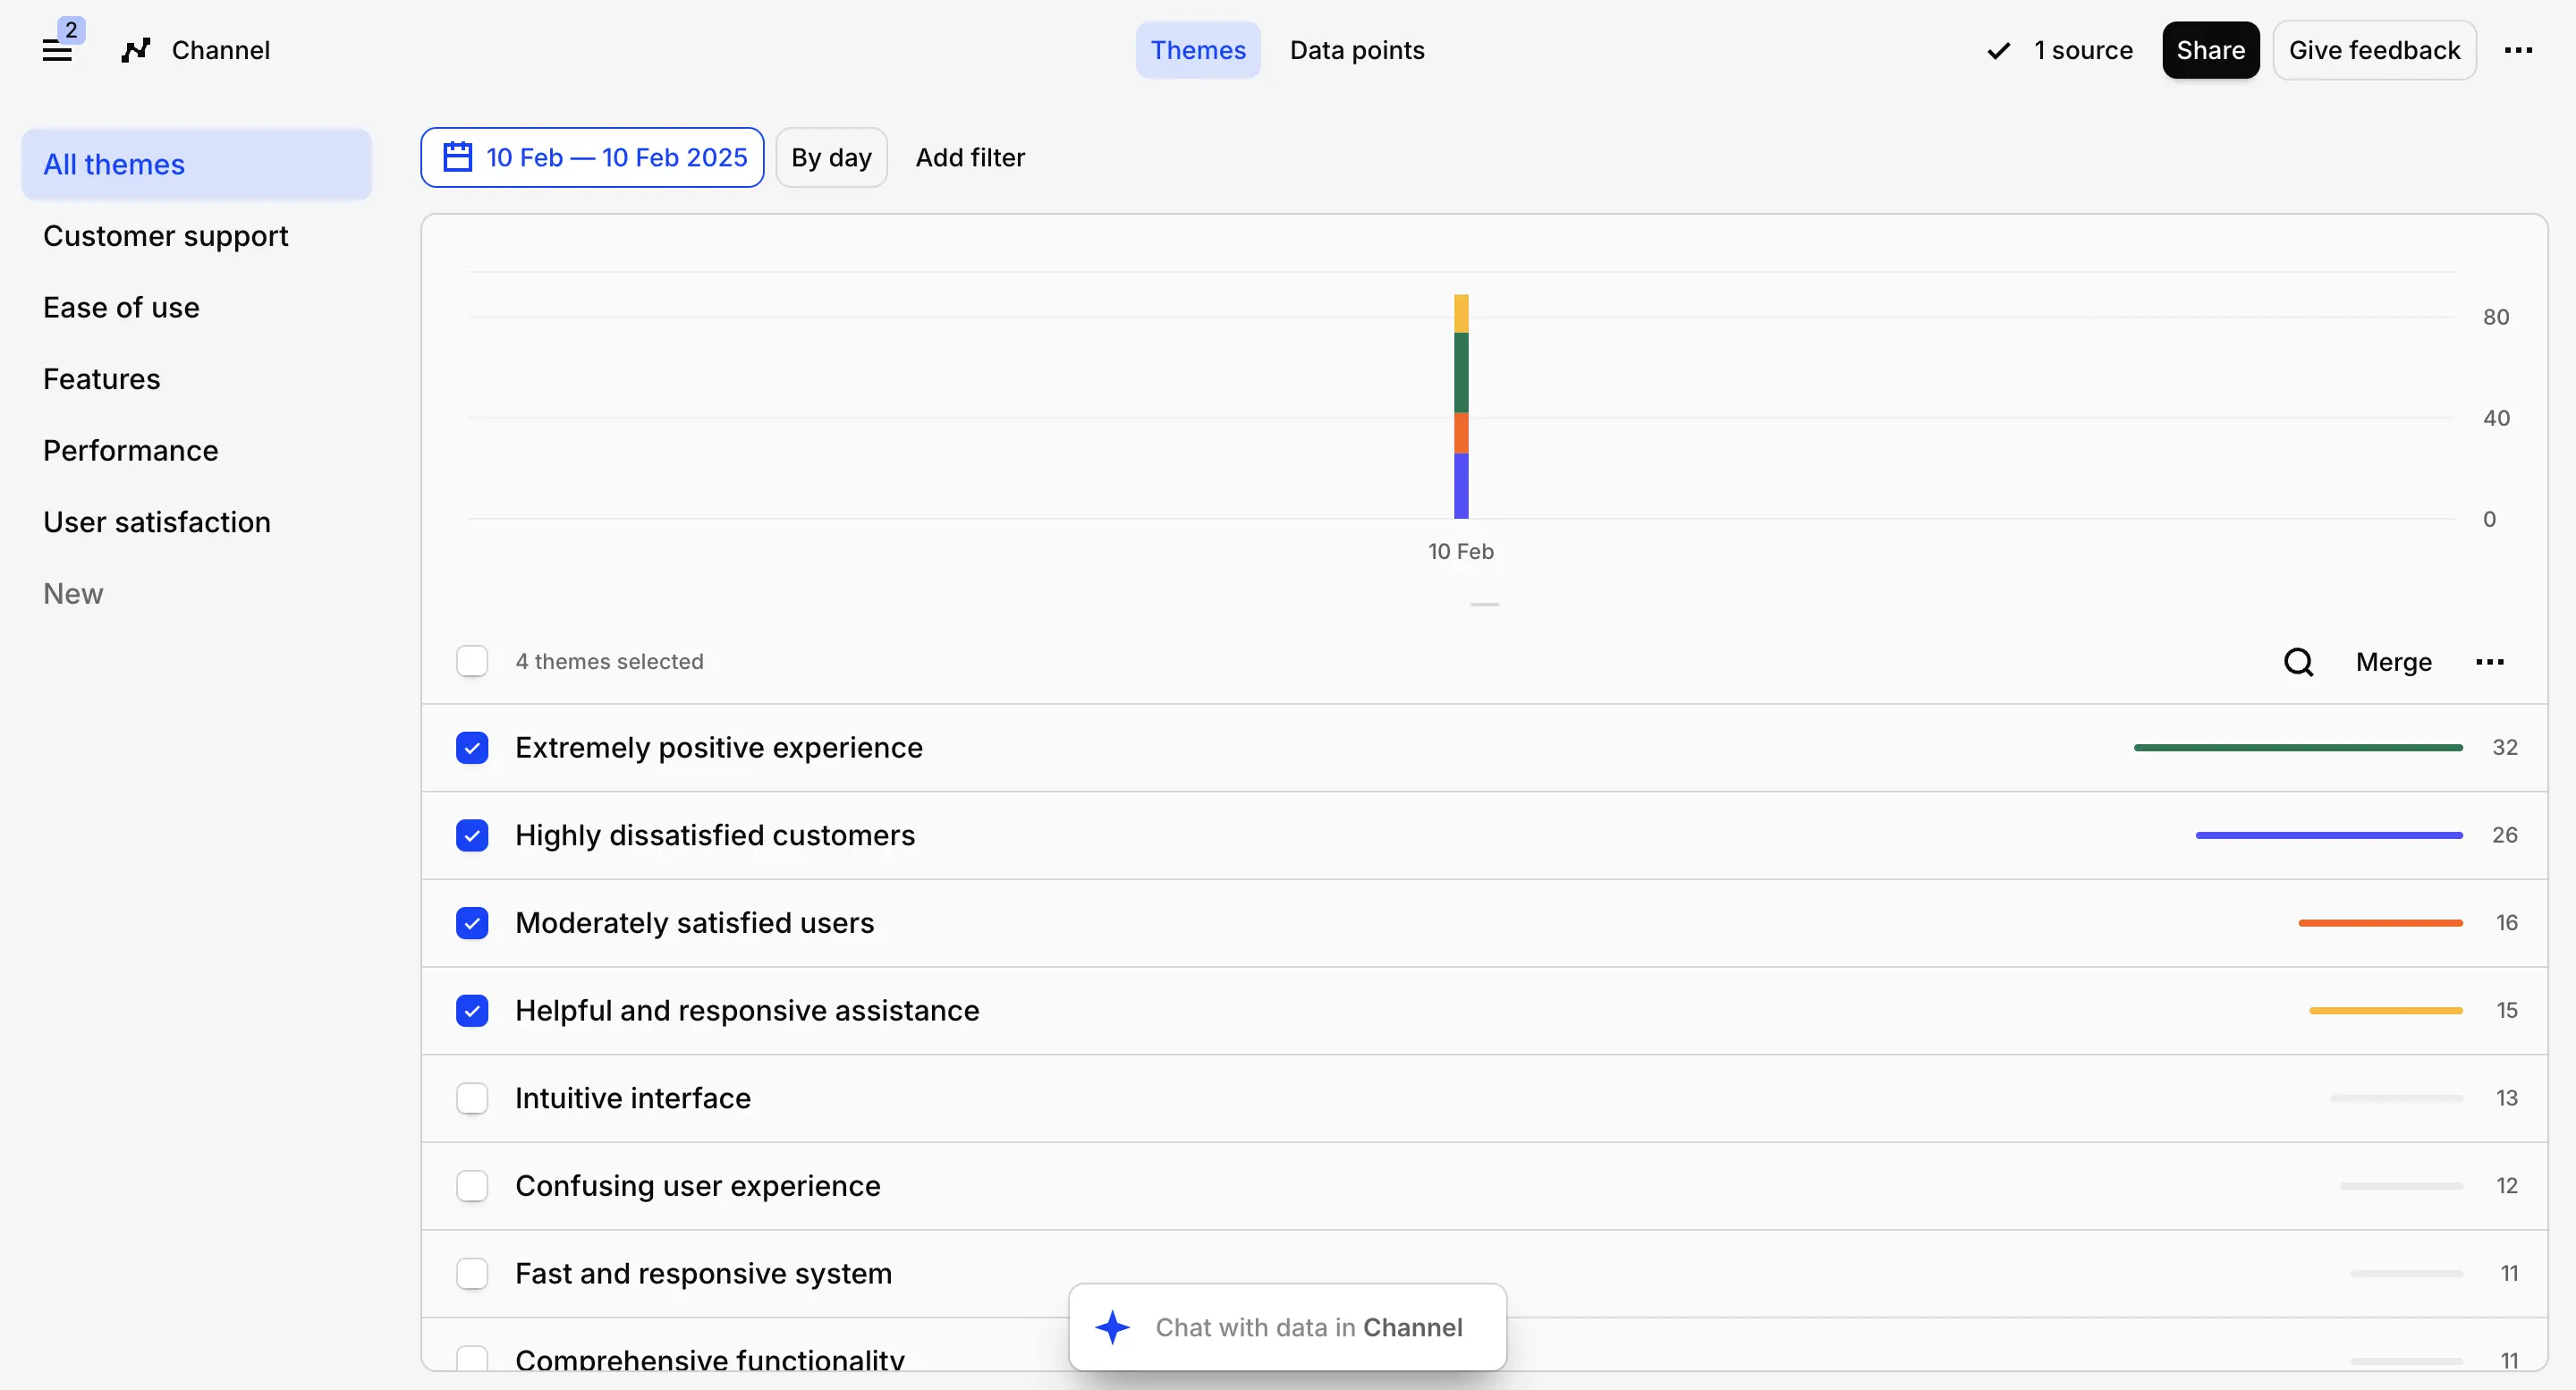
Charts display at a really small size that makes it harder to spot trends at a glance.
Even after Dovetail's AI has organized feedback into themes, the presentation feels cluttered and the analyzed information can be challenging to interpret quickly.
Adding more context
Now, Channels also let you provide context that shapes how the AI identifies themes and categorizes your feedback. During channel setup, you describe your role, research objectives, or specific areas of interest, and Dovetail uses this framing to generate relevant topics.
For instance, you might say: "I am a UX Researcher analyzing usability testing sessions to identify pain points in the checkout flow. Surface moments where participants hesitated, expressed frustration, or abandoned tasks. Flag any patterns around navigation issues, unclear labeling, or missing information that prevented task completion."
Based on your imported data and this contextual prompt, the platform automatically suggests topics with descriptions. You have the flexibility to accept these AI-generated topics, delete ones that aren't useful, or create your own custom topics. Each channel supports up to ten topics total.
Managing themes and data
After Dovetail generates your initial themes, you have several options for refining the organization.
You can consolidate similar themes by selecting them and using the Merge function, modify existing themes to improve their titles or descriptions, or build new custom themes when the AI misses something important.
Weekly Digests
Every Friday, Channels produce automated digest emails that summarize recent activity. These digests highlight themes showing notable shifts, whether that's a spike from 1 mention to 100 or a drop from 100 down to 1. The summaries also call out emerging patterns and unusual trends in your feedback data.
Digests only go to users who follow a channel. If you create a channel, you're automatically subscribed.
Action steps or summaries
Similarly to Survicate, you get to summarize your research and the auto-categorized insights with AI.
Generate specific action steps or insights based on the auto-categorized themes, to then copy, paste, and send over to stakeholders or other team members.
Projects
While Channels focus on automated theme detection across connected feedback streams, Projects are designed for investigating specific research questions with curated datasets. This includes recordings that need transcription alongside other source material.
Projects accommodate various study types like customer interviews, user testing, sales conversations, or survey data. Each project functions as a contained research study built around particular questions you're trying to answer. You can include interview recordings with transcripts (where each file represents one session), usability testing sessions with video and transcripts, or survey responses (where each completed questionnaire becomes a data object).
One frustration: when importing CSV files, each row gets created as a separate item, which clutters the data view significantly.
Projects organize around six customizable object types that you can toggle on or off to suit your workflow.
Projects are built around six customizable components that you can enable or disable based on your needs.
The system even prompts you during project creation to select a workflow template, which automatically activates the relevant tabs and objects for your study type.
- Overview functions as your project homepage where you document research background, objectives, hypotheses, methodology, timeline, and current status for team members joining the study.
- Recruit integrates with Respondent to help you source and schedule external participants without leaving the platform.
- Data stores your source materials like recordings, documents, and survey submissions as individual objects, while Highlights captures important quotes and passages extracted from your notes.
- Tags allow you to code and group highlights into thematic categories.
- Insights enable you to document findings from the current project or synthesize learnings across multiple studies.
- Charts provide visual representations of patterns emerging from your tagged highlights.
AI Chat
The final feature worth noting is AI Chat, currently in beta testing.
This conversational interface runs on Claude and lets you query your data in natural language. The system interprets where you are in the platform and automatically scopes your questions accordingly. Ask something while viewing a single transcript and it searches that file. Ask from a project view and it searches that study. Ask from the workspace level and it searches everything.
Potential applications include refining your sales methodology based on call patterns, identifying gaps in your research coverage, creating summary reports that pull from multiple projects, or helping new team members get up to speed quickly.
You can launch Chat from the sidebar or with the keyboard shortcut ⌘J (Mac) or Ctrl J (Windows). Responses include clickable links that take you directly back to source material, for easy present and future reference.
The search mechanism adapts to your current view, whether you're in a tag collection, project, channel, or looking at specific data. It uses a combination of keyword matching, semantic understanding, and filter logic. If you haven't selected a particular scope, Chat defaults to searching your entire workspace.
Each answer provides traceable citations showing exactly which data points informed the response.
Ease of use
From our experience testing Dovetail, the platform is pretty easy to get around, especially thanks to its clean, minimalistic, and modern UI.
But Dovetail is also not a feature-heavy platform.
The majority of users on G2 are satisfied with Dovetail’s ease of use, like this user here saying:
“Dovetail is incredibly easy to use and has helped us build a stronger research culture at my company.” G2 review
Selected users mention specific UI struggles, like:
“Project folders and organisation could improve. Not being able to have a personalized view of the workspace can make finding projects and general administration more complicated than needed.” G2 review
Which is pretty much in tune with our experience. Some UI things could be improved, like the csv upload issues we’ve come across or the Projects becoming messy after connecting our data points with it.
Customer support
Customer support rarely appears as a topic in Dovetail's roughly 200 G2 reviews, but the mentions that do exist lean positive.
Reviewers note quick response times and effective problem resolution, with some characterizing the support experience as excellent.
Pros and cons
Pros:
- Strong qualitative depth, especially for interview and video-heavy research
- Clean, modern interface and traceable AI Chat citations
- Backed by Anthropic models, with research projects built around recordings
Cons:
- No survey building, so you need a separate collection tool
- Most capabilities, and several AI features still in beta, sit behind custom Enterprise pricing
- Gets pricey fast (Vendr median ~$22k/yr), with reviewers flagging steep increases
- Charts and CSV handling can feel cluttered
My hot take: where Dovetail fits
Dovetail is one of the strongest tools here for deep qualitative work, particularly if your research lives in interviews and recordings.
The trade-offs are cost and gating: the genuinely useful AI and collaboration features are Enterprise-only, several are still beta, and the price climbs quickly.
If interviews are your core input and budget isn't the constraint, Dovetail is worth evaluating closely. If you also need surveys, or you want traceable AI without an enterprise contract, it's a harder sell.
Marvin
Marvin (HeyMarvin) is an AI-native customer insights platform and research repository built specifically for UX, product, and research teams.
It pulls primary research and passive feedback into one searchable, intelligent repository, and it leans hard into qualitative interview work, including AI-moderated interviews, automatic transcription, and cross-project analysis.
It's also enterprise-ready, with SOC 2 Type II, HIPAA, GDPR, and ISO 27001 certifications and customers like Microsoft.
On G2, Marvin is the highest-rated tool in this guide at 4.8/5 across over 130 reviews.
Pricing
Unfortunately, Marvin doesn't publish prices.
There are three subscription plans plus a free trial, and the things most teams want, the integrations, repository-wide AI search or advanced AI analysis, sit in the highest tier, so expect a custom quote and budget accordingly.
There's also no public Vendr median to anchor to, but the Enterprise-gated feature set suggests it isn't necessarily a budget-friendly option.
Features overview
Connecting sources
Marvin connects around 20 integrations to pull in data, on top of file uploads, and its strength is qualitative analysis: transcribe interviews, tag and theme conversations, and ask questions across your data with AI that cites back to sources.
Now, the list is modest in number, but it's well chosen for a research workflow, and it leans toward the tools your insights flow into rather than a wide net of feedback sources.
Roughly how it breaks down:
- Calls and interviews: record your interviews and let the Marvin bot join to take live, AI-assisted notes, with automatic transcripts and speaker recognition that attributes quotes to the right person.
- Quant and survey data: pull responses from Pendo, Qualtrics, and Google Forms, and import UserTesting studies, so qualitative and quantitative data sit side by side (you’ll need a third-party tool, though!)
- Participant data: sync panel and CRM records from Rally and Salesforce to keep your research panel current.
- Sharing and downstream work: push notes and tags to FigJam and Miro for affinity mapping, surface insights in Confluence, Notion, and Slack, and turn findings into Asana or Jira tasks without leaving Marvin.
Unfortunately, most of these are gated.
On the Free plan, sources are essentially just .csv uploads, with Confluence as the only listed integration and Ask AI restricted to project-level search.
The Standard plan (custom-priced, billed annually with overages) is where most of the connectors switch on: Google Forms, MS Forms, SurveyMonkey, Pendo for surveys, Intercom and Zendesk for support tickets, Slack, Gong and Salesforce for sales data, plus Notion, Miro, and Figma.
And Enterprise adds the rest: Qualtrics, Rally for panel management, OneDrive and SharePoint, repository-wide search (instead of project-level), the AI-generated newsletter, plus the SSO, redaction, and governance pieces.
AI analysis
Marvin's analysis is its core pitch: transcribe interviews, tag and theme conversations, and ask questions across your data with AI that cites back to source. When the data is solid, it's genuinely useful.
The structural catch is how it's scoped.
You add and analyze data file by file or source by source.
Each interview, document, survey export, or support-ticket file comes in as its own item, and the analysis happens within it.
To work across an entire study, you're stitching individual files together, which is the manual seam that runs through the whole tool.
For contrast, Survicate's Research Hub works the other way around. The analysis happens across everything at once, every source you've uploaded or connected, in one pass. Real triangulation.
For the AI analysis itself, on the Free plan you get to test the AI in a heavily restricted format. So AI summaries, the AI chat, and auto-created notes.
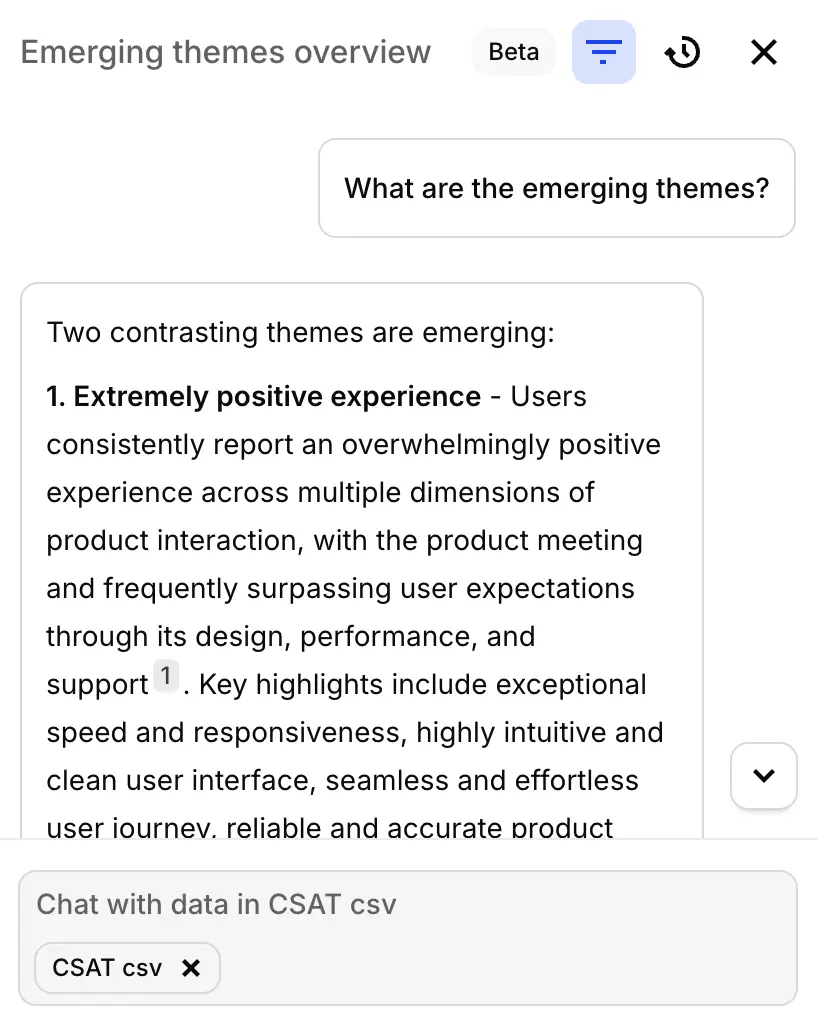
First, the AI chat.
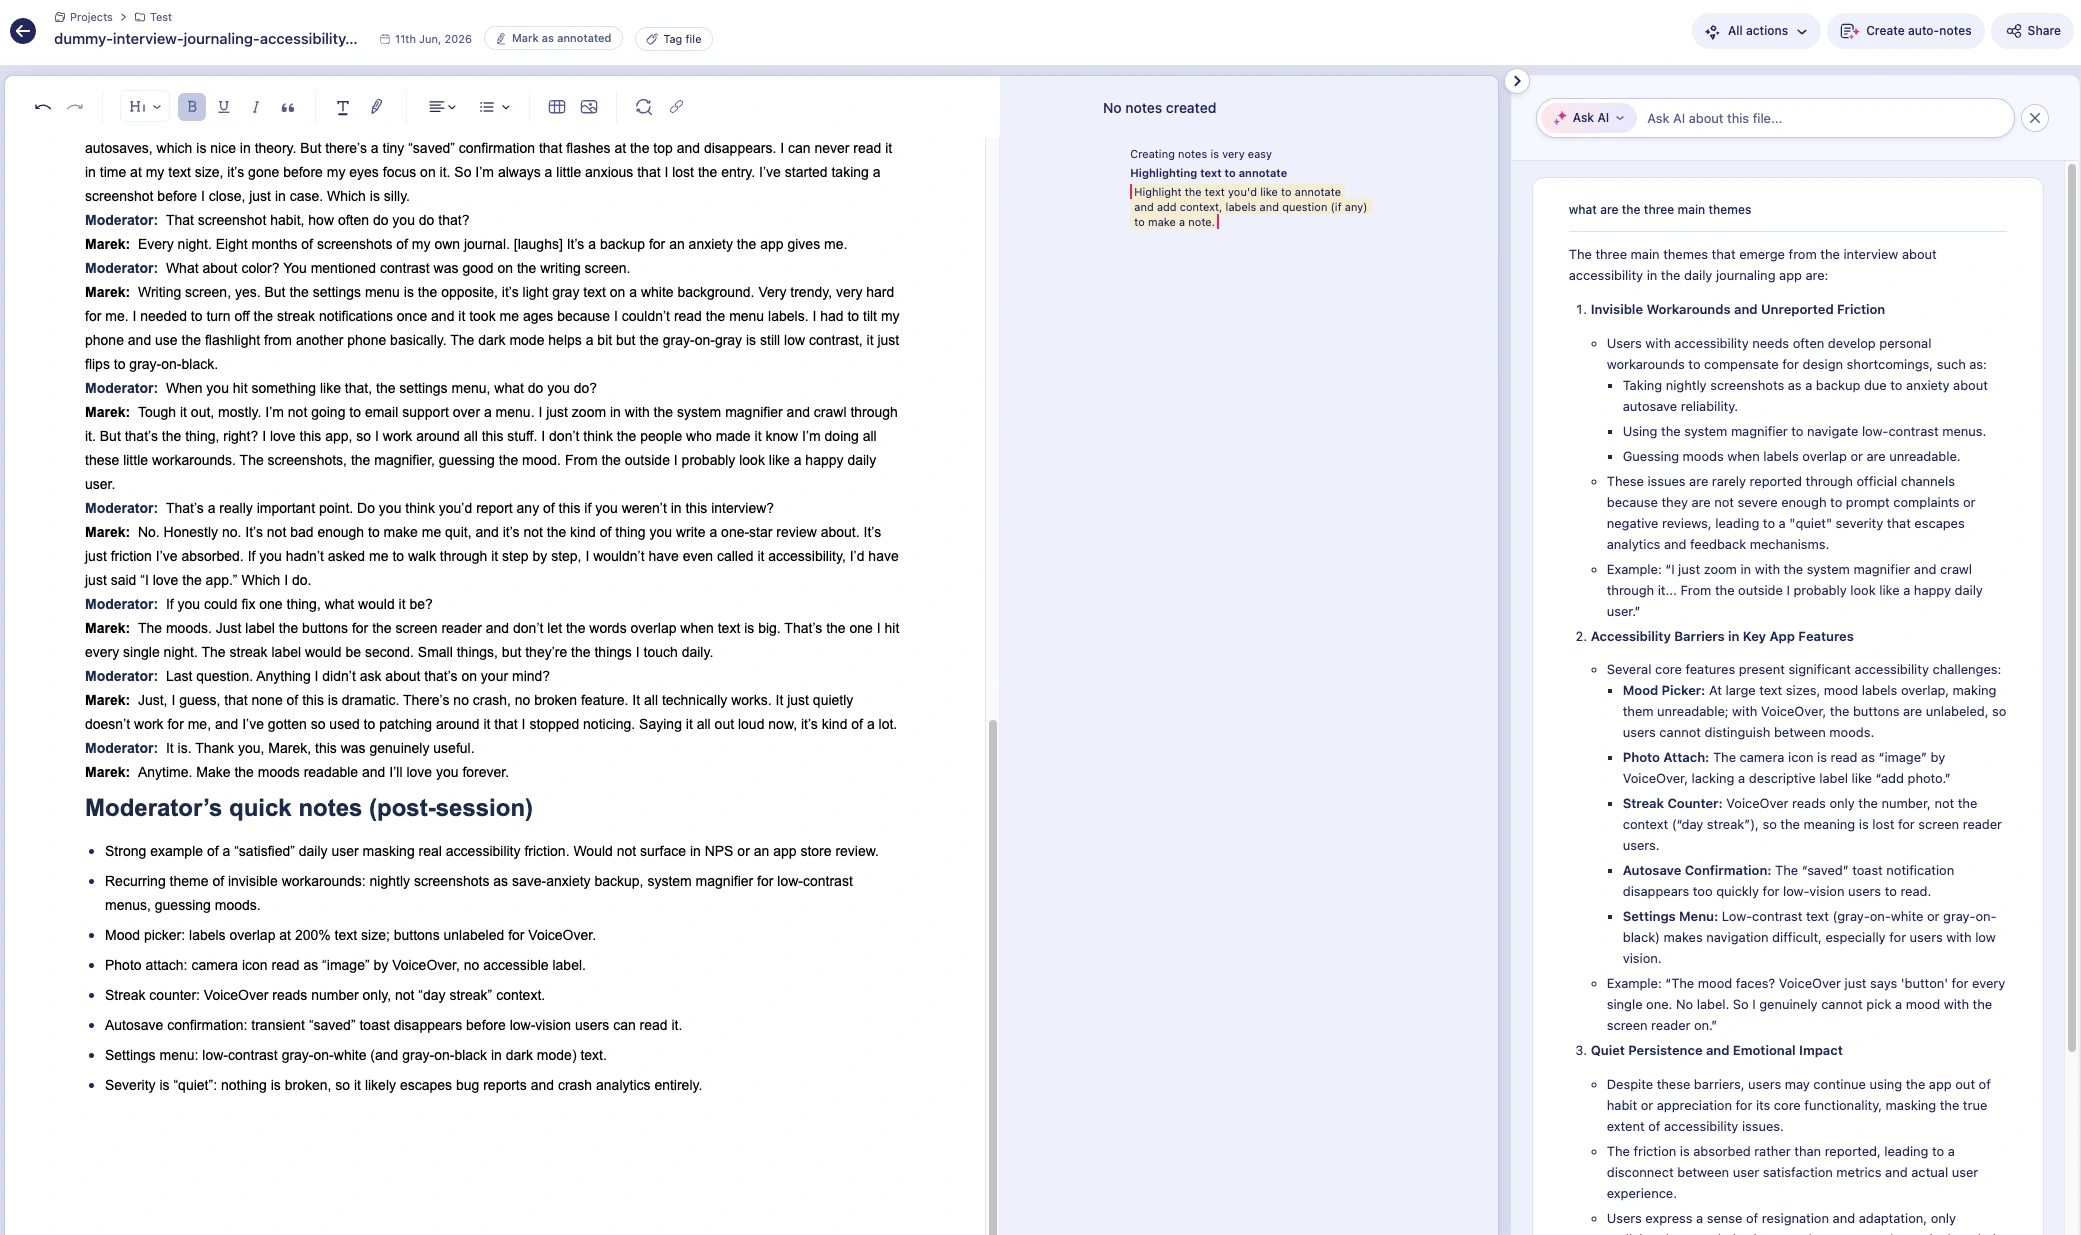
I asked it for the three main themes in an interview, and it listed them and pulled in relevant bits of the transcript. But that was the end of it.
The quotes weren't clickable, so I couldn't jump to the exact moment in the interview to confirm the AI had read it right. It reads like a ChatGPT answer: probably correct, but you have to go back into the file and verify it yourself.
For the notes, which is the most useful feature in my opinion, Marvin pulled nine notes. Because you can re-use those notes across the platform. Add it into reports (more on that in a bit), see them in a playlist, and share them with stakeholders.
Some of it comes off weird, though. Like the playlist feature.
The playlist view highlights each note's section in the original file. In theory that solves the click-through problem: you see the note and the exact text it came from, side by side. In practice it's clunky.
The notes are long, multi-sentence excerpts rather than concise themes, so instead of reading "accessibility issue: large text size," you get "participant describes that the large text size, the labels under the emoji faces blah blah blah," and then the playlist shows you those exact three highlighted sentences in context.
It reads like you're just re-reading the file with some sections marked. By the time you've stepped through all nine, you could have read the whole interview yourself and pulled the same insights.
The features that would close some of that gap (which I truly think is where Marvin’s real power comes in) are split across the two paid tiers.
Unlimited AI synthesis, AI auto-tagging, advanced AI analysis, and Deep Research all start on Standard, and Ask AI stays limited to project-level search even there.
Repository-wide search, the thing that would let you actually analyze across your whole repository, lands only on Enterprise, alongside the heavier sources (Qualtrics, OneDrive, SharePoint), SSO, and PII redaction.
So the cross-source, click-to-verify analysis you actually want is the most gated part of the product. And you can't see what either tier costs.
Now, the other caveat is accuracy.
It comes up often in Marvin’s G2 reviews. Reviewers usually raise it as a manageable trade-off rather than a dealbreaker, but it’s still mentioned quite a lot.
"The overall AI accuracy is about 75-80%, which is great compared to other platforms I've tried and is likely to improve with time."
A 75-80% hit rate is fine for a first pass you'll review anyway, but it's the opposite of the "every claim traceable to a real quote" bar a repository should clear.
If you're going to present findings to stakeholders, plan to verify the AI's output rather than trust it outright, especially when the underlying dataset is thin.
For me, I tested on a planted accessibility interview and Marvin caught every issue and hallucinated nothing, but it handed back nine long notes in the order they came up rather than ranked themes, leaving the actual synthesis to me.
Building out reports
Here's the part that surprised me.
For a tool that leans this hard into AI, the actual report-building is a manual job.
There are templates, but you still fill them in yourself. And if the templates don't fit your use case, you're starting from a blank "Untitled Insight" page with a "Start typing..." placeholder and a Word-style toolbar.
You pull the quotes, write the narrative, and structure the findings by hand.
There is a faster second route, though, and it leans on the AI-generated notes from earlier.
Instead of writing from scratch, you pull the notes Marvin surfaced from a file and drop the selected ones straight into a report. So if the AI returned nine notes from an interview, you cherry-pick the ones worth keeping rather than retyping them. It's the one place the notes feature earns its keep, since you're reusing the AI's output instead of just reading past it.
For comparison, Survicate's Research Hub drafts the report for you. Every project produces an AI-generated report with the findings already structured and each claim traced back to its source, and you then edit, cut, and refine it into the version you want.
Even with the notes shortcut, you're still the one assembling the report: picking which notes go in, ordering them, and writing the connective tissue.
So a fair question is how different that really is from running your analysis in Claude and writing it up in Notion. Marvin's answer is likely that everything lives in one repository: the transcripts, the tags, the source links, and the insight you're writing all sit together, so your report stays connected to the underlying data instead of drifting into a standalone document.
That's a real benefit for traceability and reuse. Whether it's worth the price over a DIY stack depends on how much you value keeping it all in one connected system versus doing the assembly yourself either way.
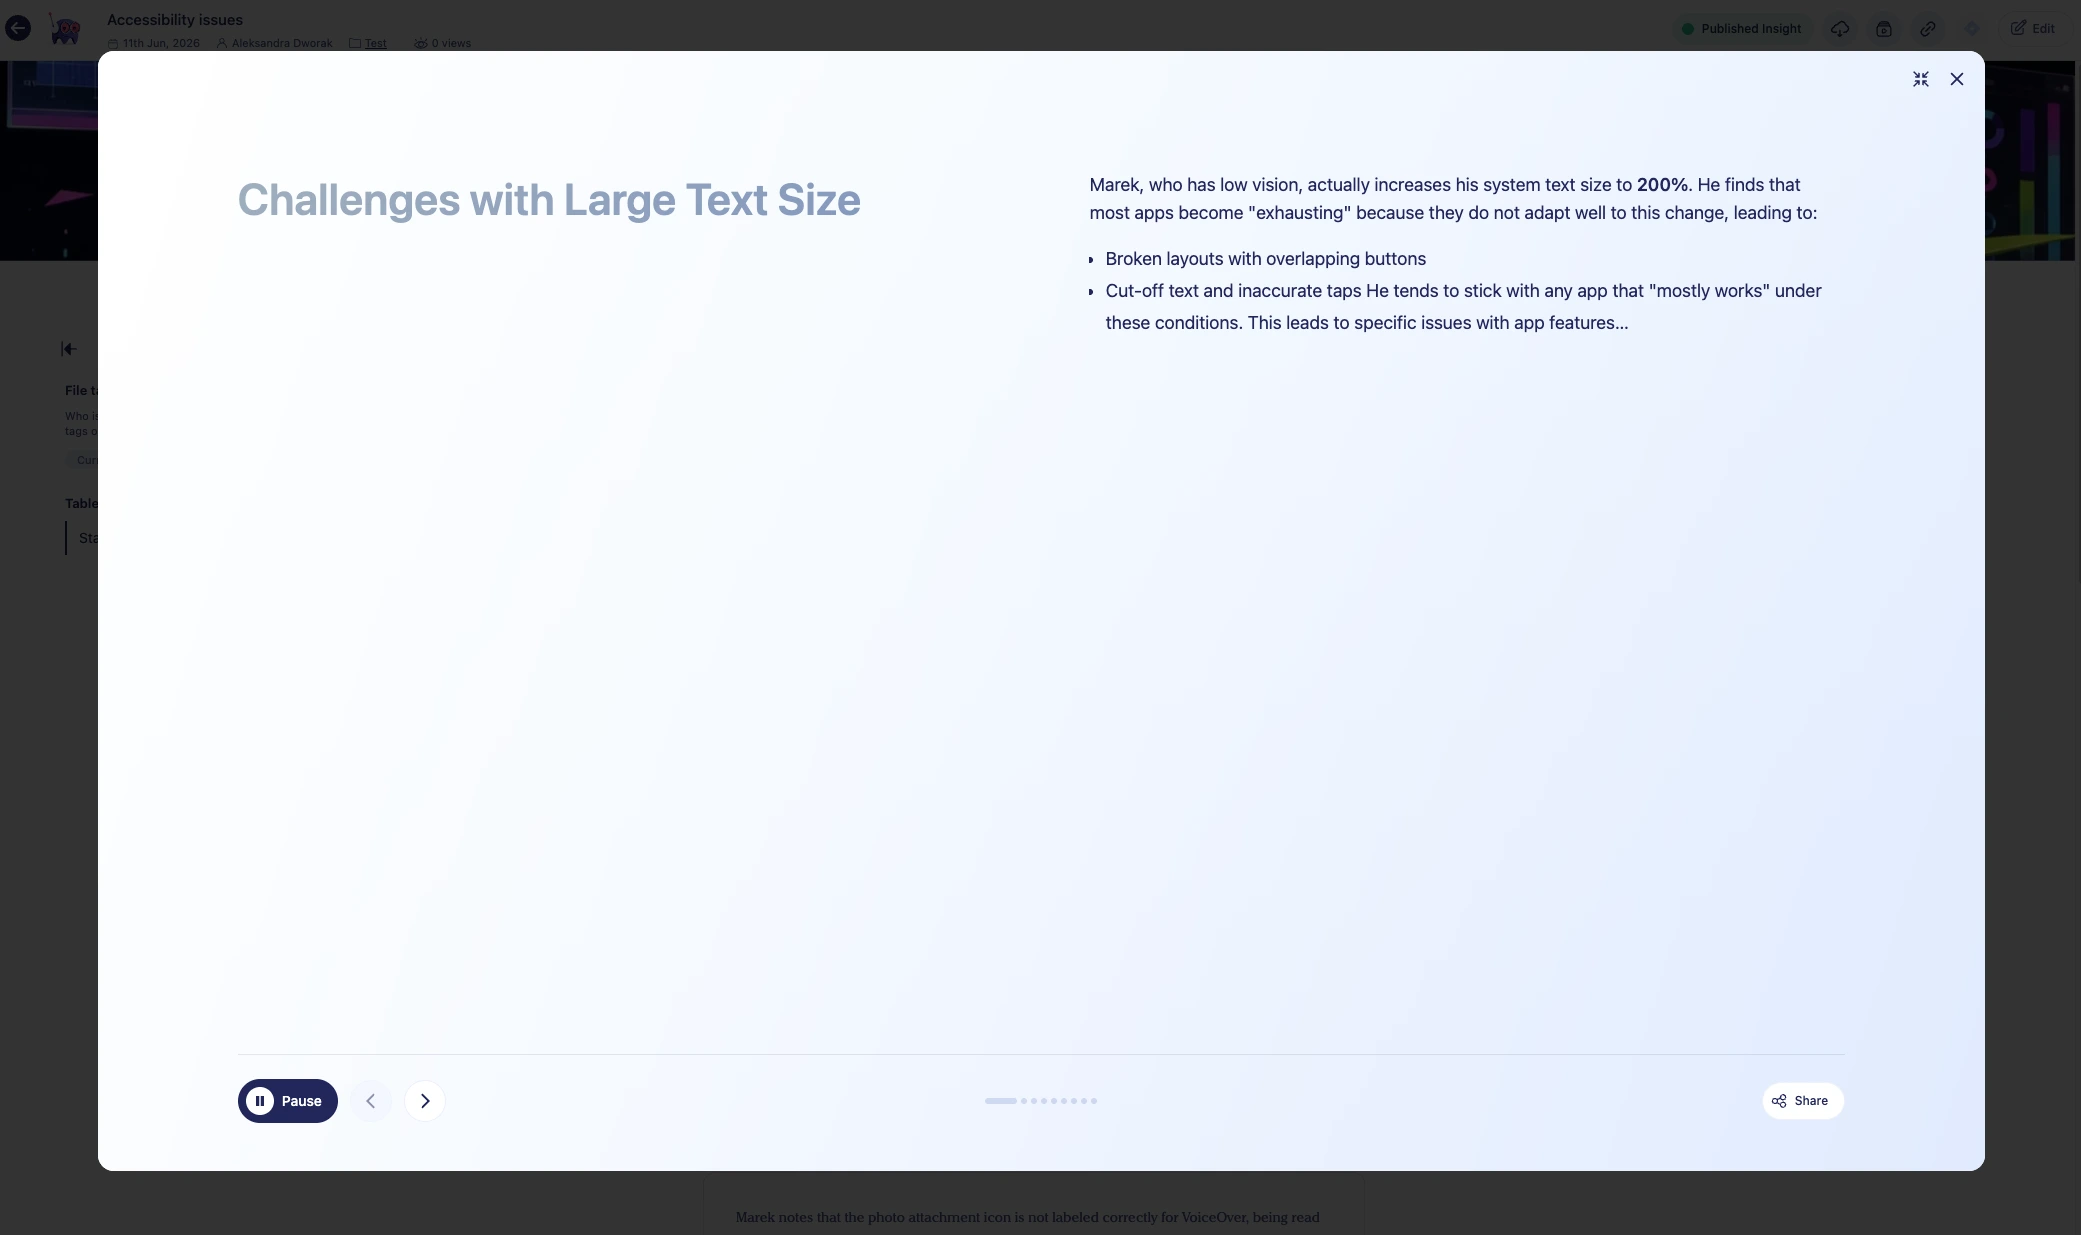
There's also a beta feature for turning a finished report into a presentation. Marvin builds the slides from your report, then plays them back with an AI-generated voiceover, so in theory you walk away with a ready-to-present deck without building one. In practice, the beta label is doing a lot of work.
When I tried it, the first slide didn't read its voiceover at all. The second slide did read, but then it got stuck, and I couldn't move past it. Closing the presentation and reopening it didn't help, it just stalled on the same slide again. Promising idea, but not something I'd rely on for anything real yet.
Sharing insights
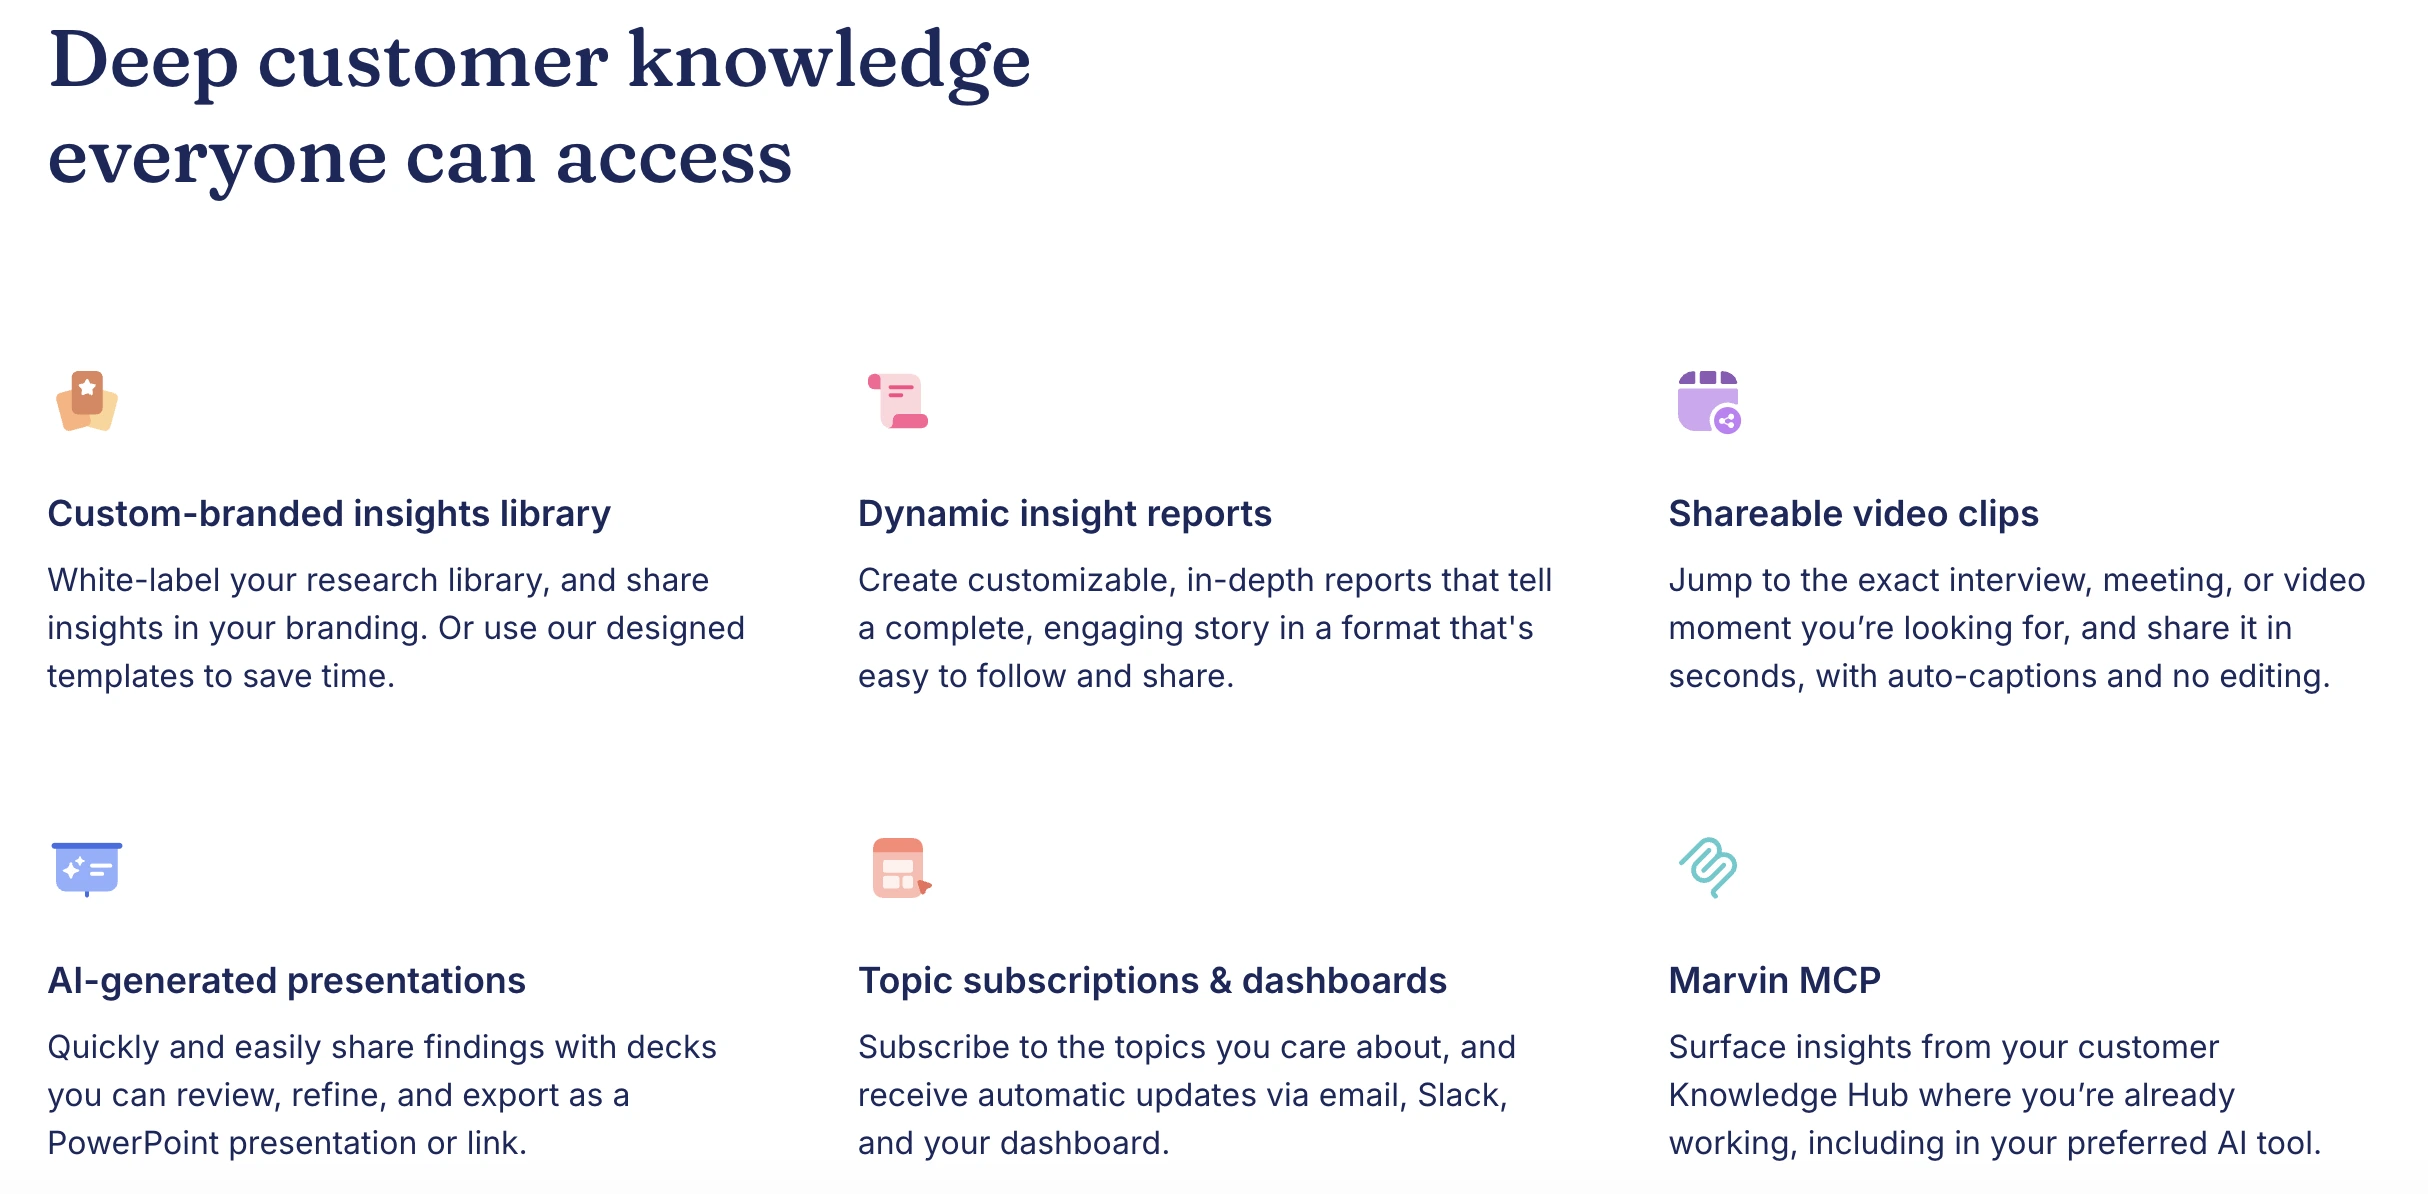
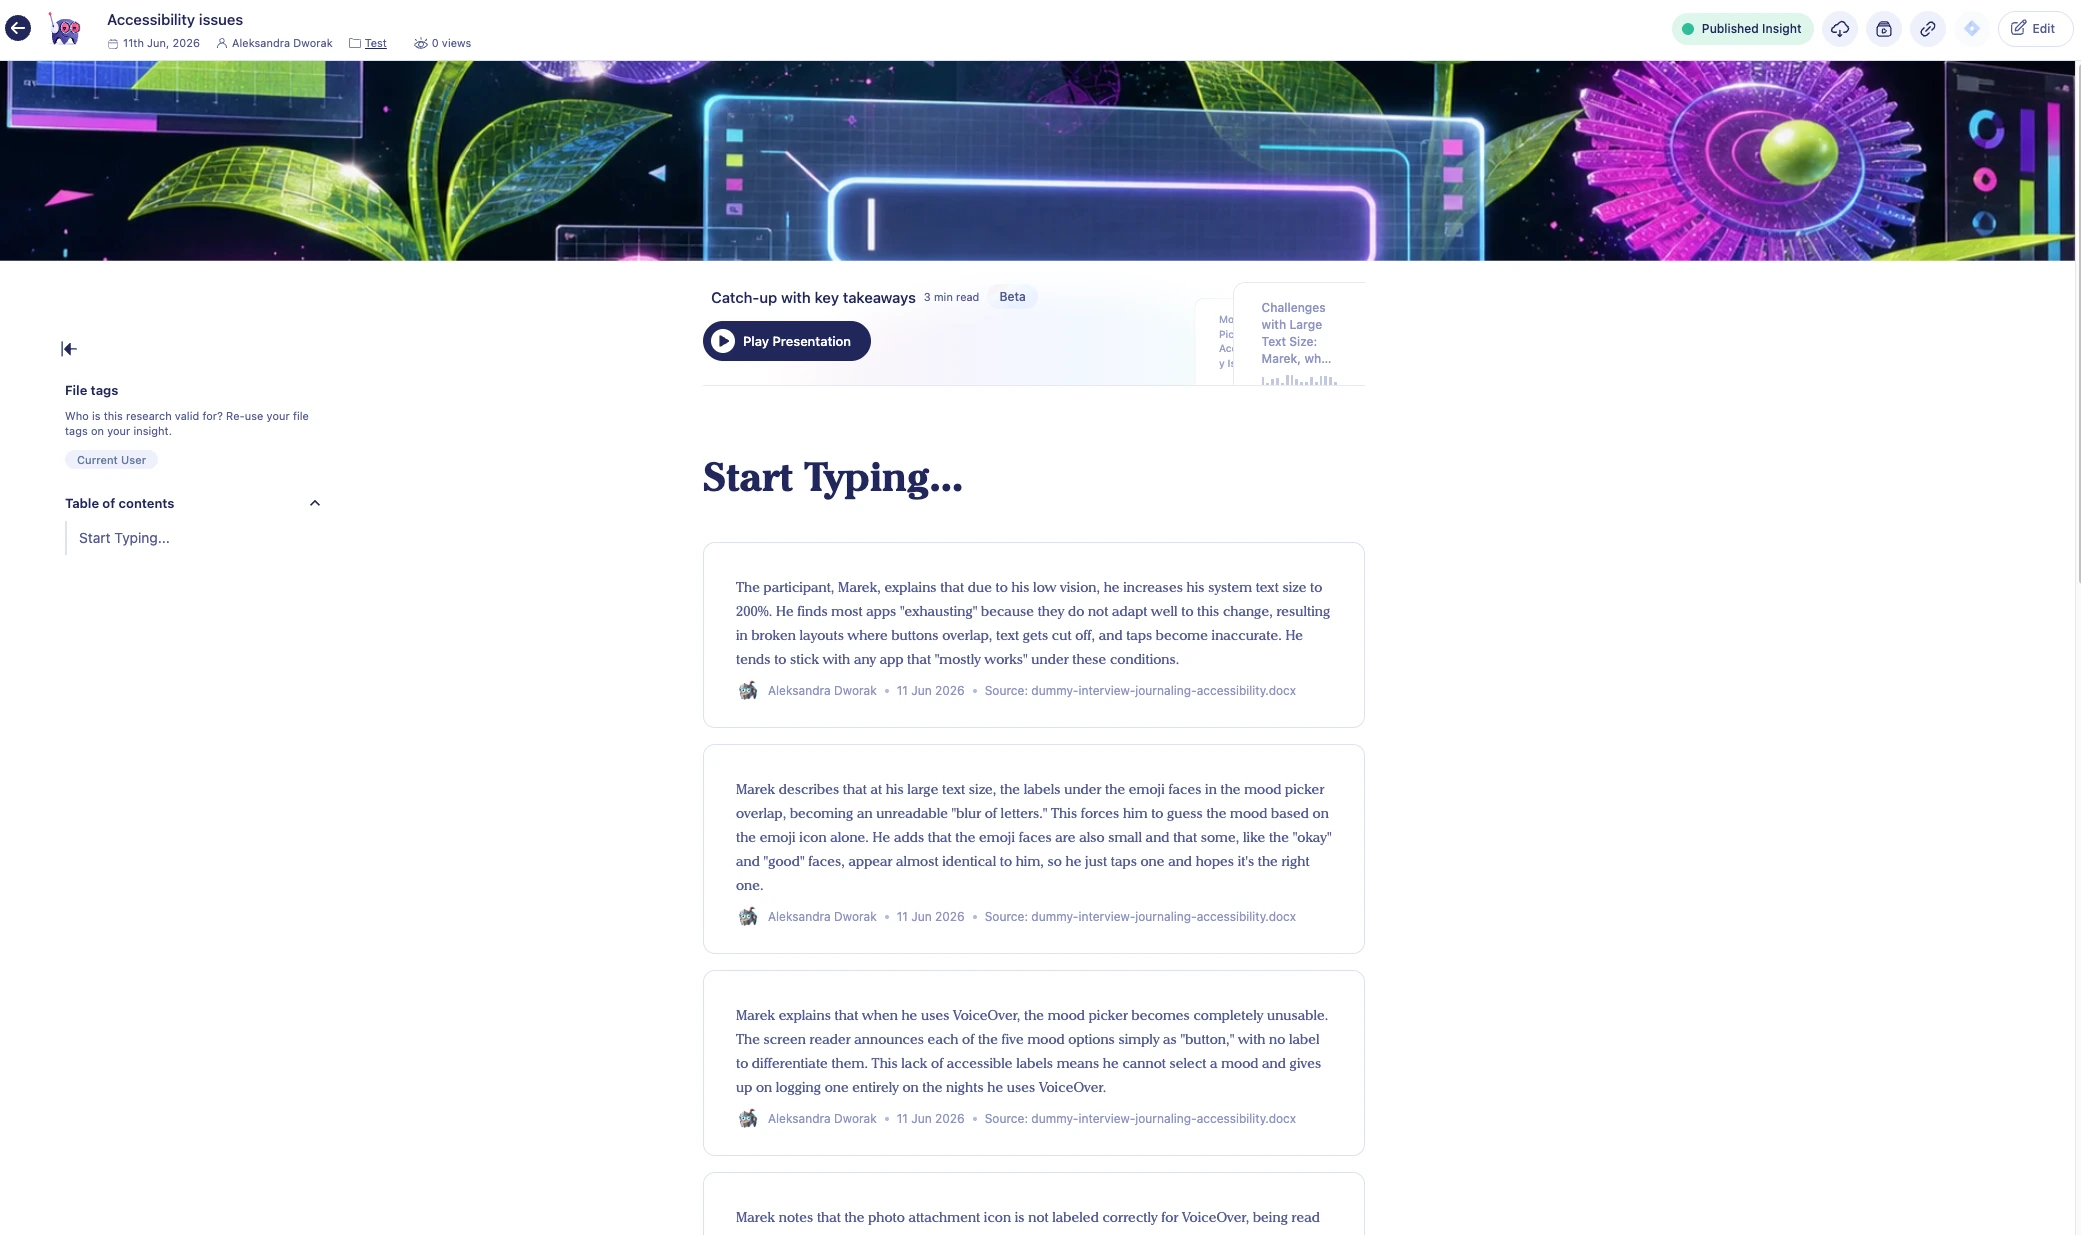
Once a report exists, Marvin is built for getting it in front of people. You can publish to a branded Knowledge Hub where stakeholders browse every insight your team has shared, and let them follow specific topics to get personalized dashboards and digests so findings reach them without being chased.
The standout is video.
You can clip the exact interview moment, auto-captioned and with no editing, and drop highlight reels into a report so stakeholders hear customers in their own words rather than reading a summary.
There's also the Marvin MCP, a single integration that surfaces your insights inside Claude, ChatGPT, Copilot, and Figma, so people can ask questions and get cited answers from your research without opening Marvin.
It's a genuinely strong sharing story, arguably Marvin's best act, even if getting there means doing the analysis and report-building by hand first.
Ease of use
There’s one G2 review that describes my experience with Marvin and the first steps perfectly:
“I think that one of the things that can be improve is the UI, sometimes I feel like I don't know exactly where to go to get something” G2 review
Although the UI is modern enough and there are lots of tooltips, it’s not always super intuitive.
Customer support
G2 reviewers consistently call out helpful, responsive support, and several mention plenty of integrations and good day-to-day assistance.
Pros and cons
Pros:
- One of the highest G2 rating in this guide (4.8/5 across 130+ reviews), built specifically for researchers
- Strong qualitative tooling, including AI-moderated interviews, automatic transcription, and cross-project analysis
- Genuinely strong sharing: video clips and highlight reels, a branded Knowledge Hub, and an MCP that pipes insights into Claude, ChatGPT, Copilot, and Figma
- Enterprise-grade security and compliance (SOC 2 Type II, HIPAA, GDPR, ISO 27001)
Cons:
- Analysis is scoped file by file, so cross-source work means stitching files together yourself
- The trustworthy, cross-source, click-to-verify analysis is gated to the paid tiers, and you can't see what they cost
- Reports are assembled by hand, even with the notes shortcut
- Accuracy comes up repeatedly on G2, so AI output needs verifying before it reaches stakeholders
- The UI isn't always intuitive, and the presentation feature is still buggy in beta
My hot take: where Marvin fits
Marvin is a serious, researcher-first repository, and the 4.8 rating reflects real satisfaction.
Its standout is the back half of the job: once you have insights, the video clips, the branded Hub, and the MCP make sharing them genuinely strong, arguably the best in this guide.
The catch is everything before that.
When I tested it on our planted accessibility interview, the AI caught every issue and invented nothing, which is a real point in its favor. But it scoped the analysis to one file, handed back nine long notes in the order they came up rather than ranked themes, and left the synthesis and the report-building to me.
The cross-source, click-to-verify analysis that would fix that sits behind paid tiers you have to negotiate for, with no public price.
So Marvin is for qualitative teams who do heavy interview work, care a lot about sharing insights well, and have the budget for a custom quote.
If you want analysis that runs across all your sources at once with every claim traceable, without piecing it together yourself or guessing at the price, Survicate's Research Hub gets you there with less manual work and clearer pricing.
Enterpret
Enterpret is a platform that enables you to centralize and analyze customer feedback to then help shape product development. But they also dedicate their tools for other teams, not just UX Researchers and Product people, but also Sales teams to help analyze user needs better.
Taken as a research repository specifically, it covers features such as:
- Connecting feedback data into the platform with 50+ native integrations and file uploads,
- Analyzing the data with AI and Dashboards,
- Classifying the feedback and insights with tags,
- How about charts, graphs, and sharing insights, though?
At the time of writing this article, Enterpret has a 4.5 out of 5 star rating with a little over 50 reviews submitted on G2.
Enterpret pricing
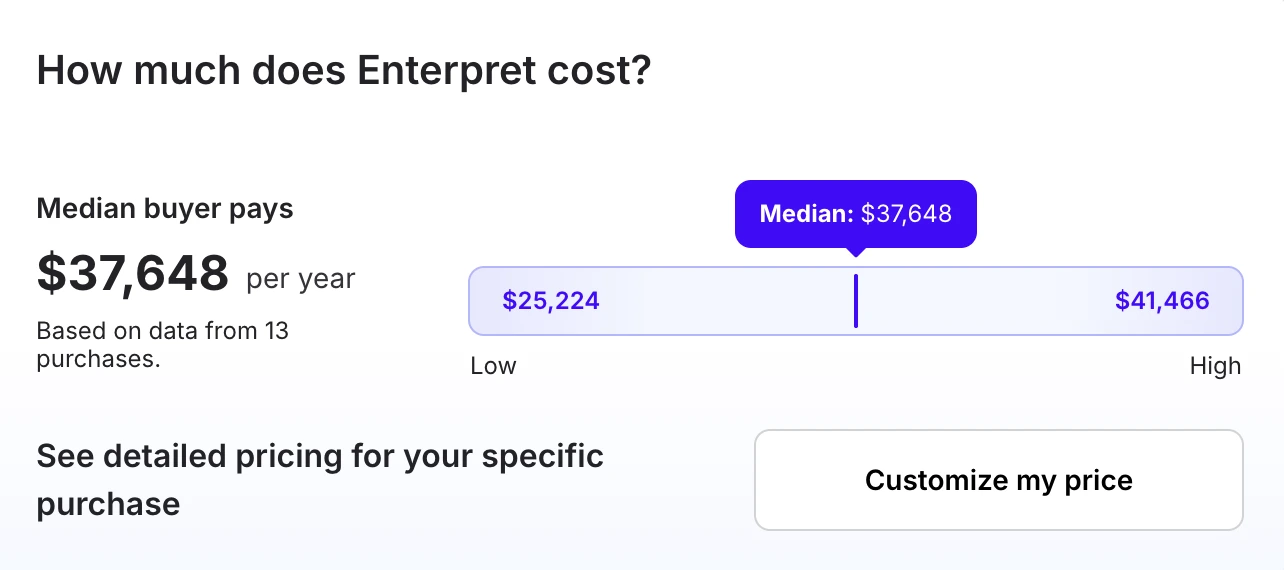
Unfortunately, Enterpret's pricing is not disclosed on their website. To get to know the exact pricing, you have to book a call with Enterpret’s team.
But, to get a rough idea on how much you’d need to spend on Enterpret’s research repository, we took a look at Vendr again, which told us that the median buyer pays nearly $40k per year for their Enterpret subscription. Making it the most expensive solution from the top research repositories platforms we took for a close up look.
Features overview
Enterpret is one of the tools that not only hides its pricing behind a demo, but also the possibility to test out the tool on a self-serve free trial.
But, they don’t leave you completely empty-handed. So, if you don’t feel like booking a whole demo just to take a quick look whether Entrepret is a match for your research needs, you can take a 5-minute platform tour directly on their website.
Here’s how the tour goes and what it presents.
Unifying customer feedback with context
The platform tour starts off by giving you three paths for it to happen.
We chose one closest to exploring a research repository solution, so the one where the platform unifies feedback with context, connecting sources, eliminating manual tagging with AI analysis, and understanding feedback at scale.
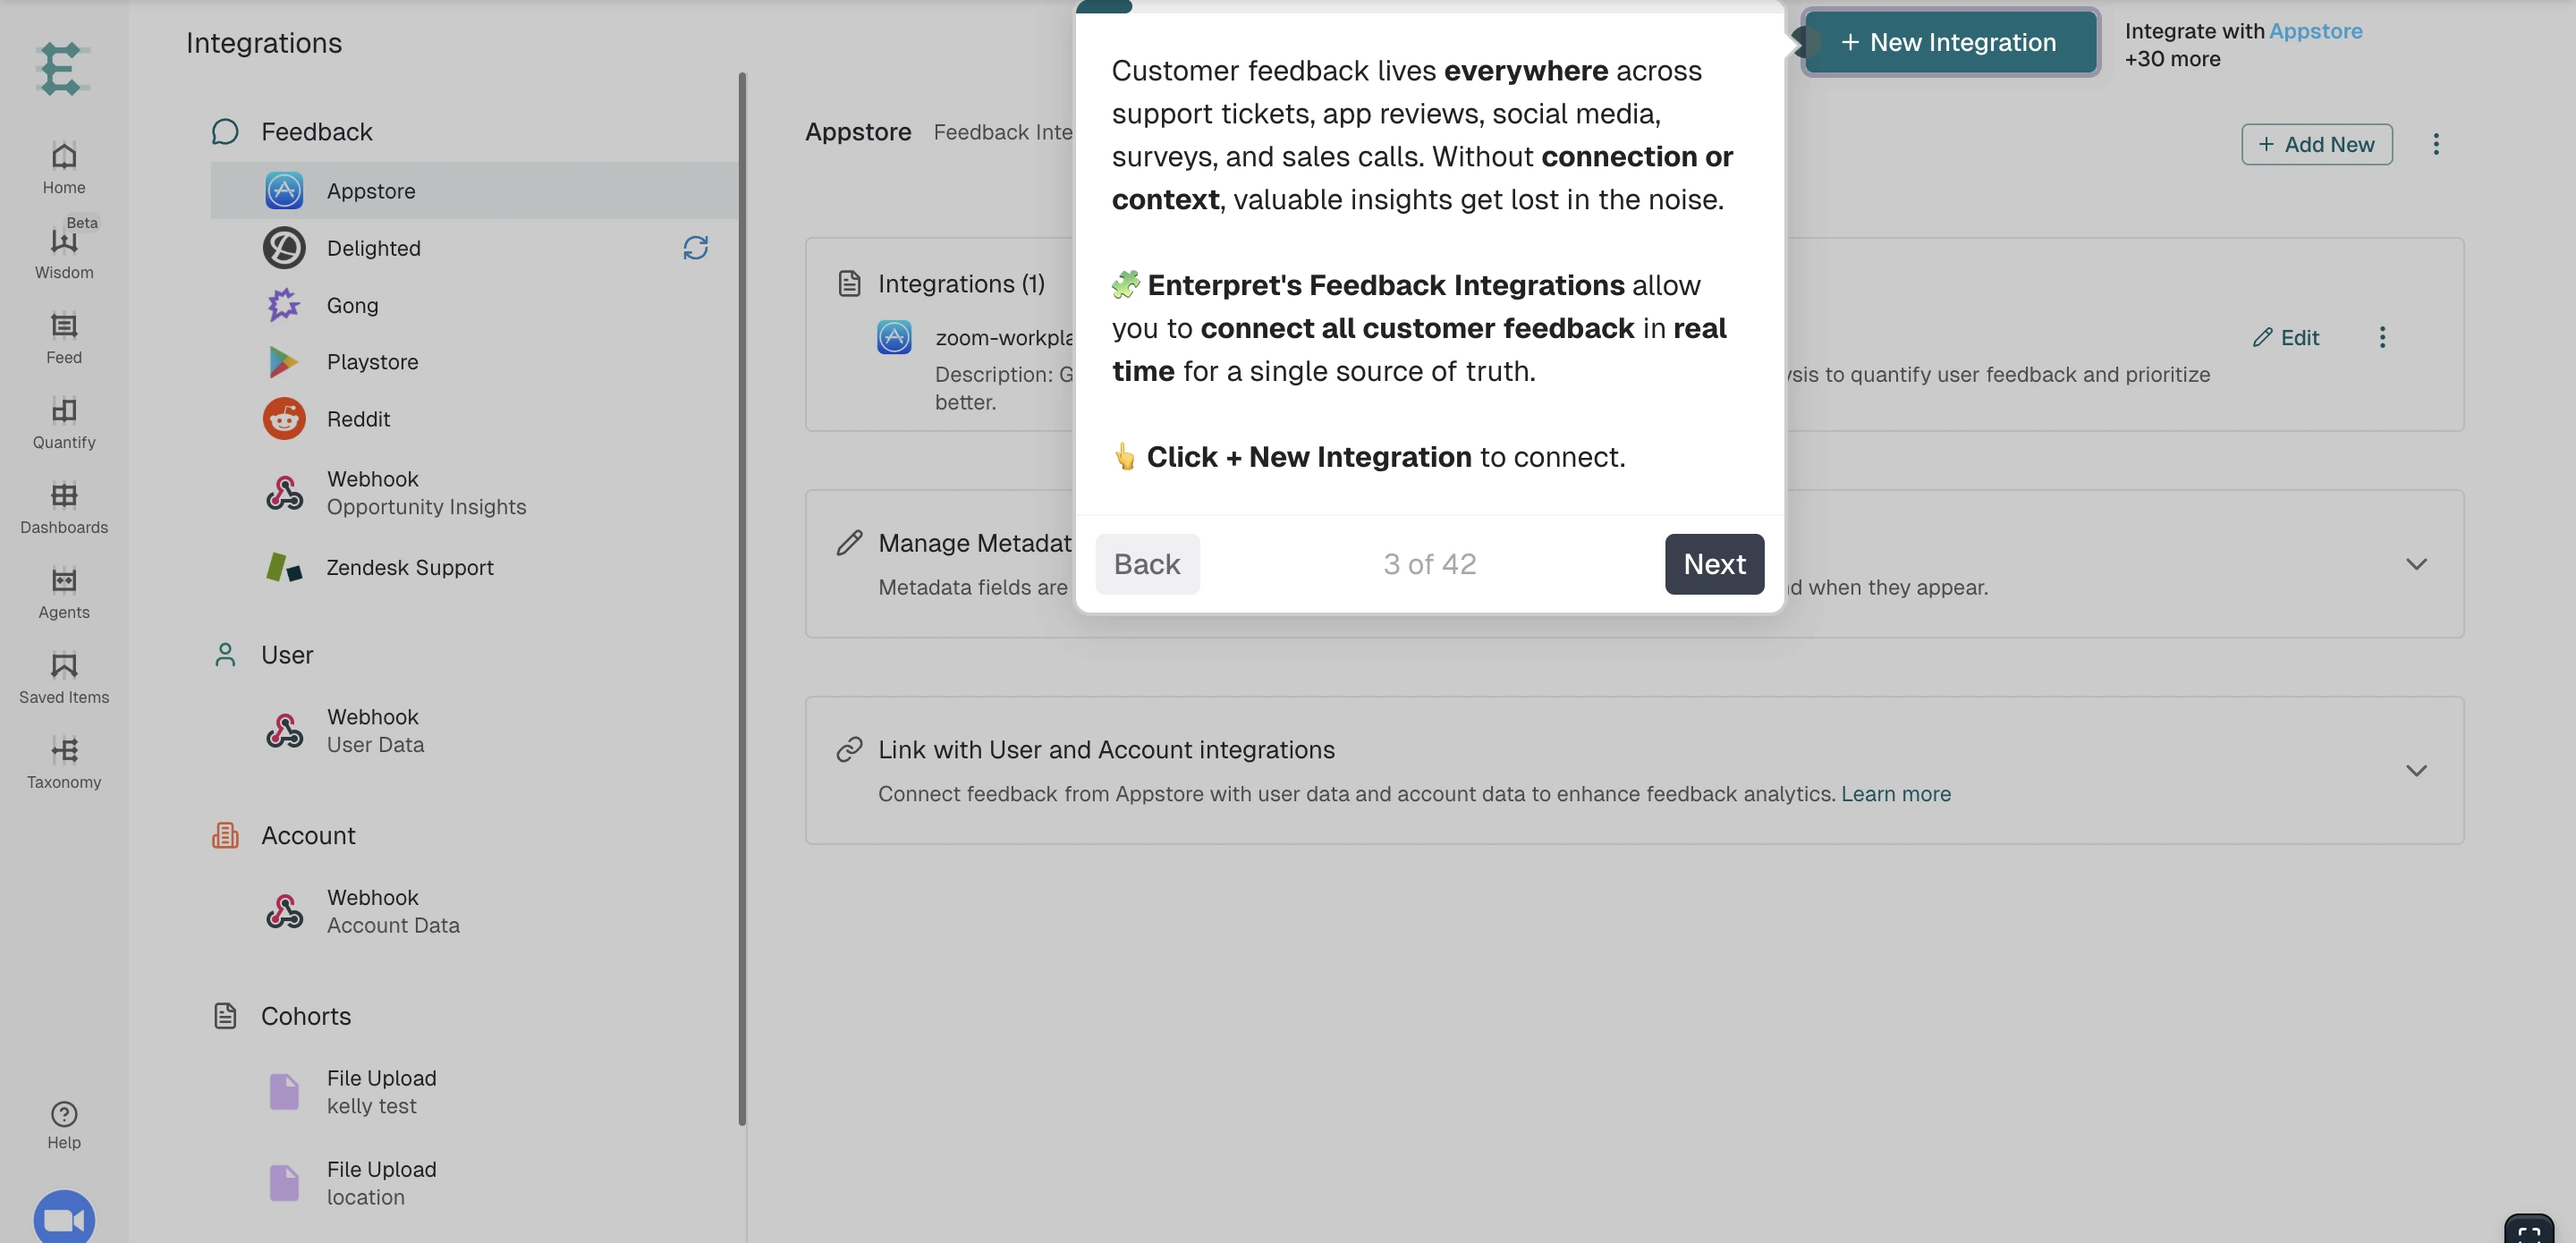
Now, the first part, connecting feedback, Enterpret, although most expensive, gives you the biggest number of integrations to connect feedback from within them. You get to connect 50+ platforms, from Gong, to Slack, to G2, or Playstore.
An added option that wasn’t possible with the previous platforms is to add more context into the tool, just as you would when working on an AI agent. You can import your existing resources like detailed documentation about the product, help content, guides, and changelogs.
AI and taxonomy
Enterpret’s Adaptive Taxonomy uses AI to eliminate manual tagging and automatically classify feedback into contextual themes that uncover the full granularity and “why” behind every comment.
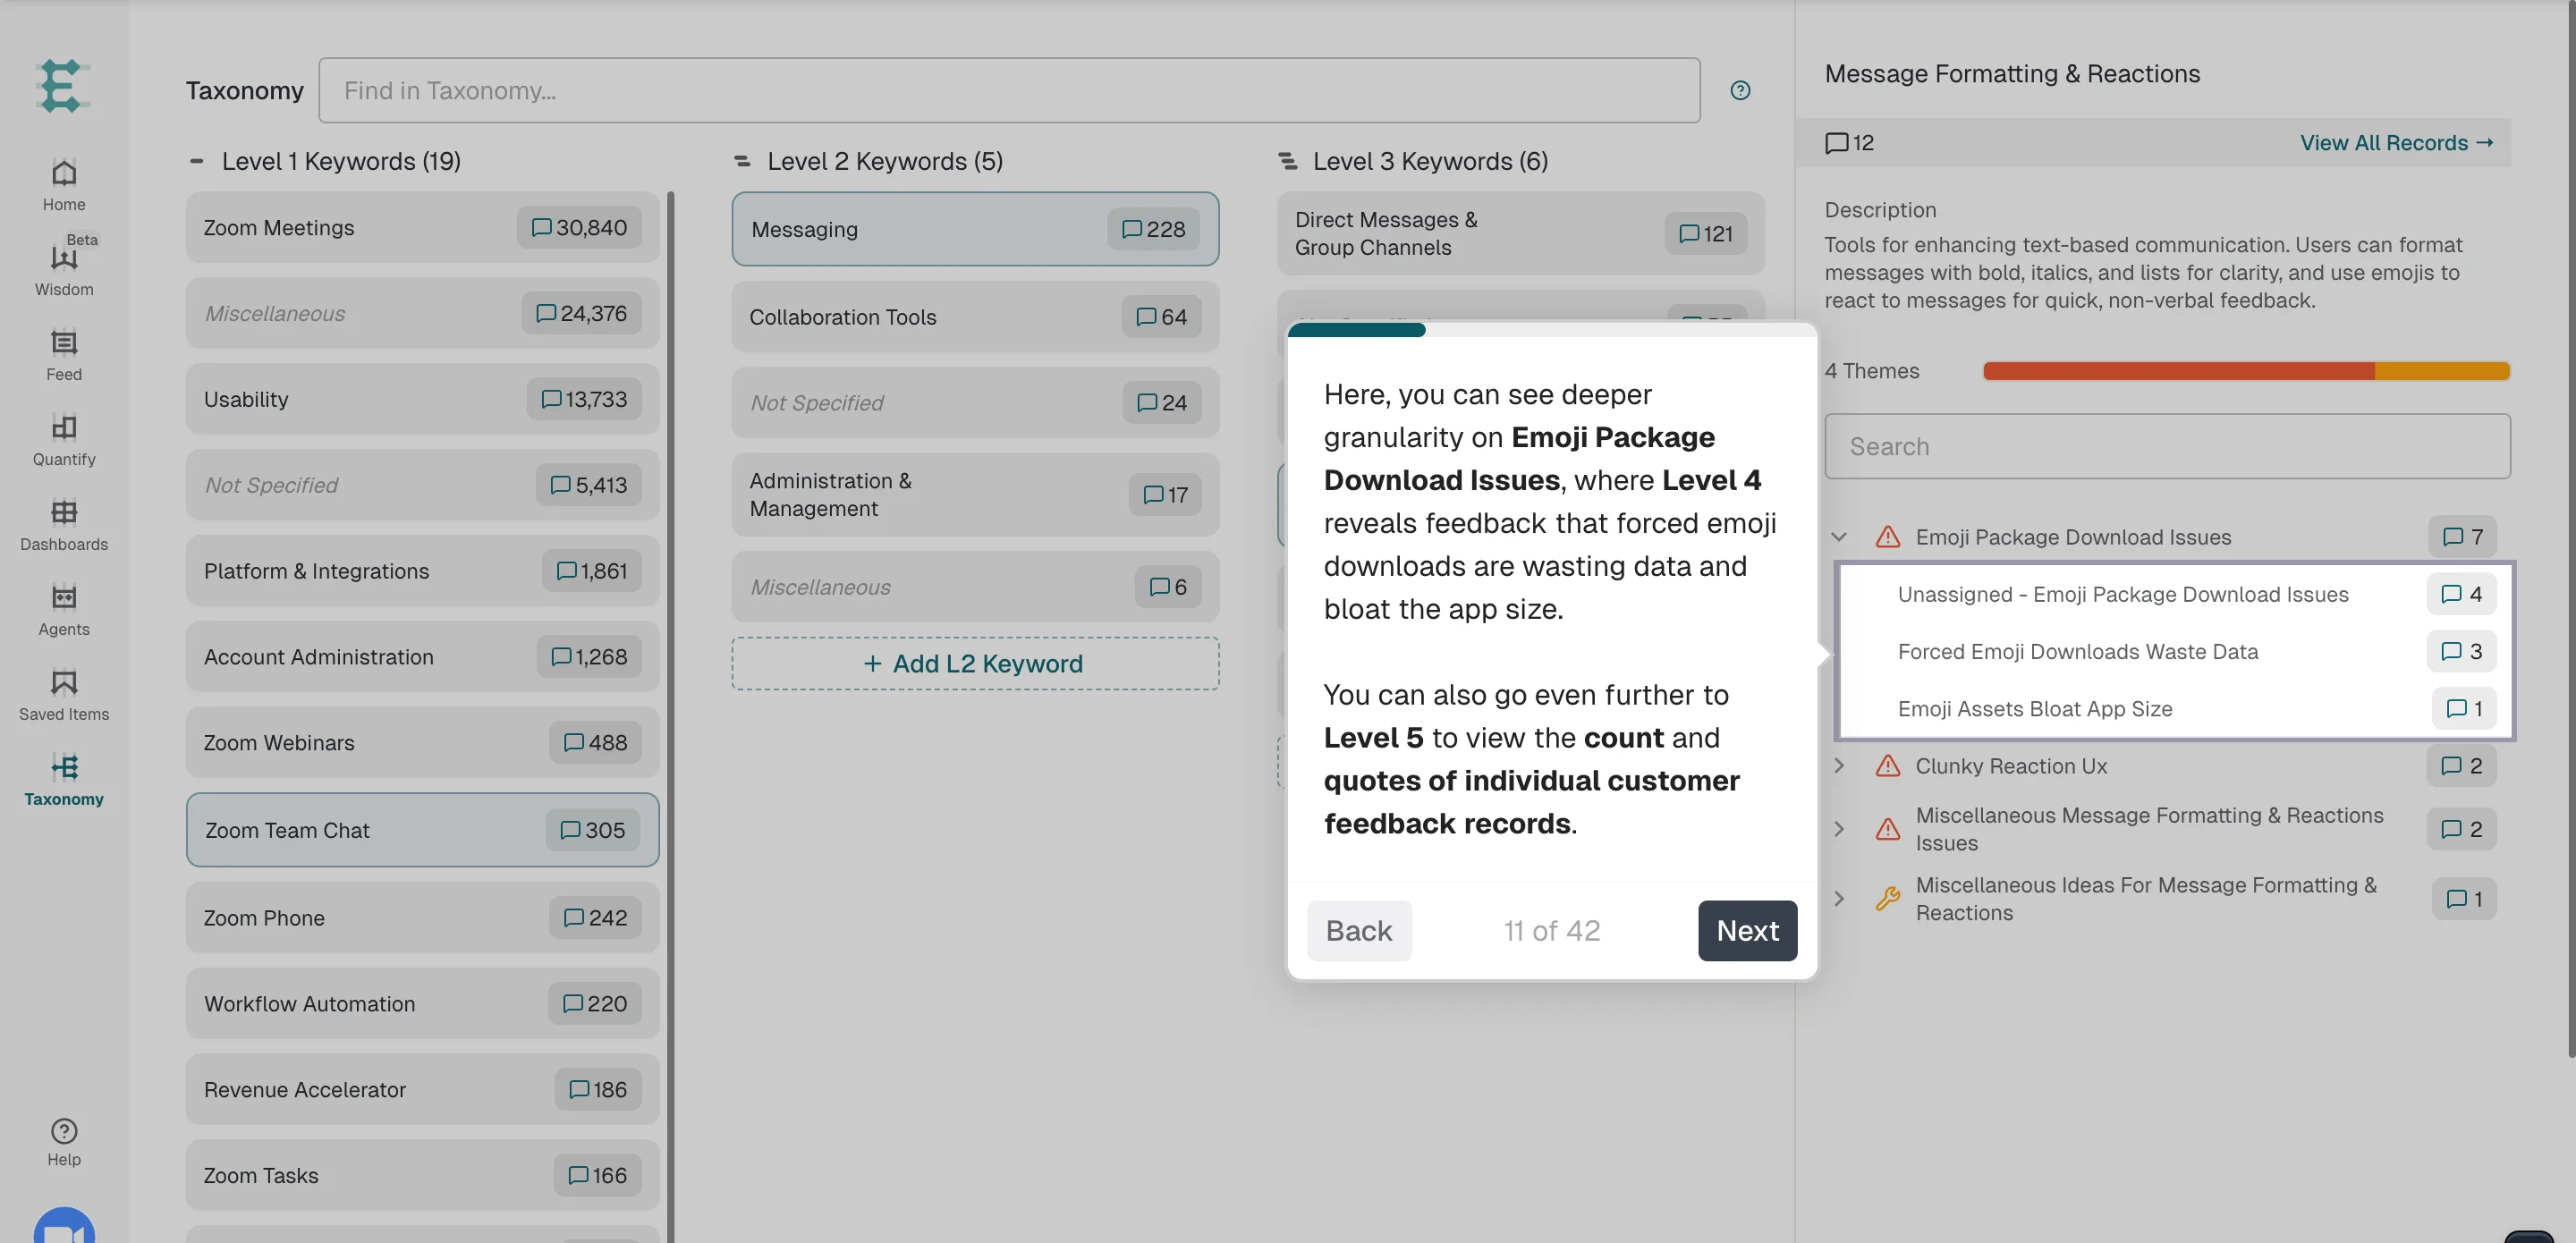
Now, each added source is broken down into 5 levels of insights depth.
Starting with level 1, you get the most surface level overview of the overall topics and themes found within the data, level 2 is specific topics within each theme, level 3 is even more specific pain points within a given topic, level 4 goes even more granular, but still stays within the idea of insights based on data, and level 5 is actual feedback count and exact quotes that support a given idea.
Explaining how granular the platform gets, breaking down the data into ever smaller pieces was a challenge in itself, but apparently, it’s also a particular challenge for Enterpret’s users too.
Users mention the following issues:
- “I found the different levels of filters difficult to navigate at first. I also find that the formatting in each Quantify isn't always consistent even if the prompt hasn't changed. [...] Outside of that I experience intermittent slowness and loading issues.” G2 review
- “For a team like my own who may design for more applications than my fingers can count, with so many integrations pulling in feedback it can be difficult to filter out actionable insights from noise. It may take you some time to fine tune to ensure you’re getting relevant, high impact trends rather than sifting through redundant or low priority feedback.” G2 review
- “It can be difficult to maintain taxonomy and requires a significant amount of manpower to constantly merge duplicate reasons, etc.” G2 review
Understanding feedback
Next comes deeper understanding of the uploaded data besides just overviewing the extracted insights.
Similarly to two other top research repository platforms on this list, Survicate and Dovetail, Enterpret also gives you the possibility to chat with your data using a trained AI.
You can ask AI any question across your feedback to get insights and data on your customers
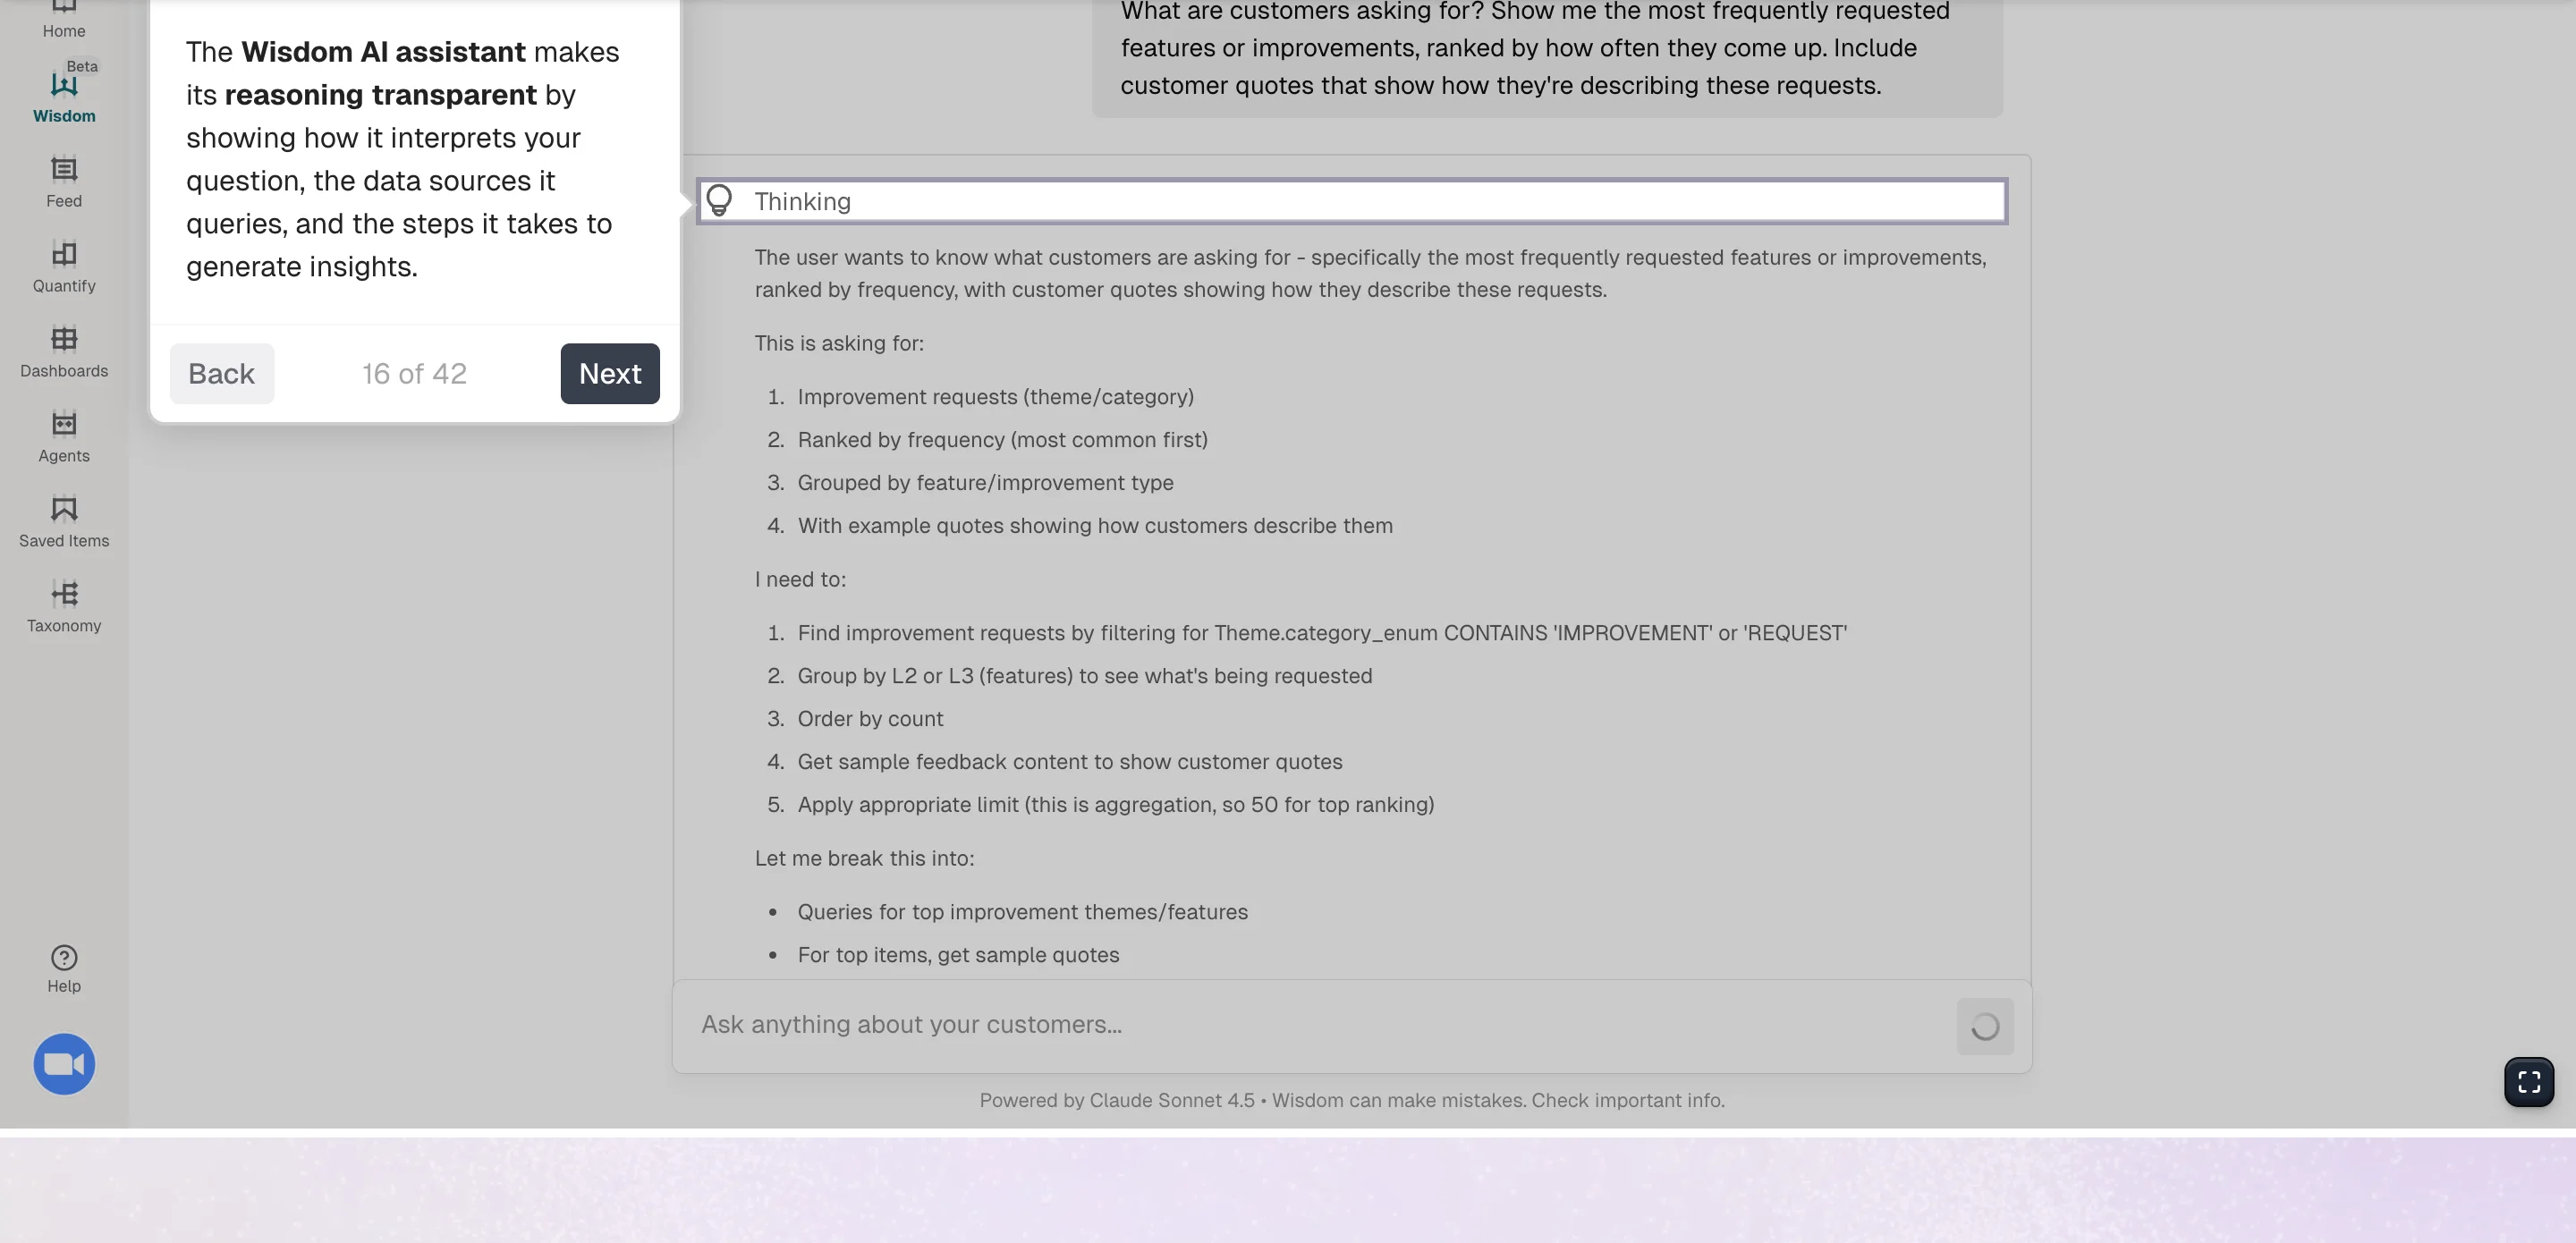
Enterpret’s Wisdom AI is powered by Claude Sonnet 4.5.
The AI chat gives you quick answers to your questions while linking back to specific quotes and sources it extracted the feedback from for added transparency.
What’s unique about this particular AI chat within a research repository is that it’s also available directly from tools like Claude or ChatGPT. Similarly to Survicate, Enterpret also makes it possible to chat with your data directly from within Slack.
Dashboards
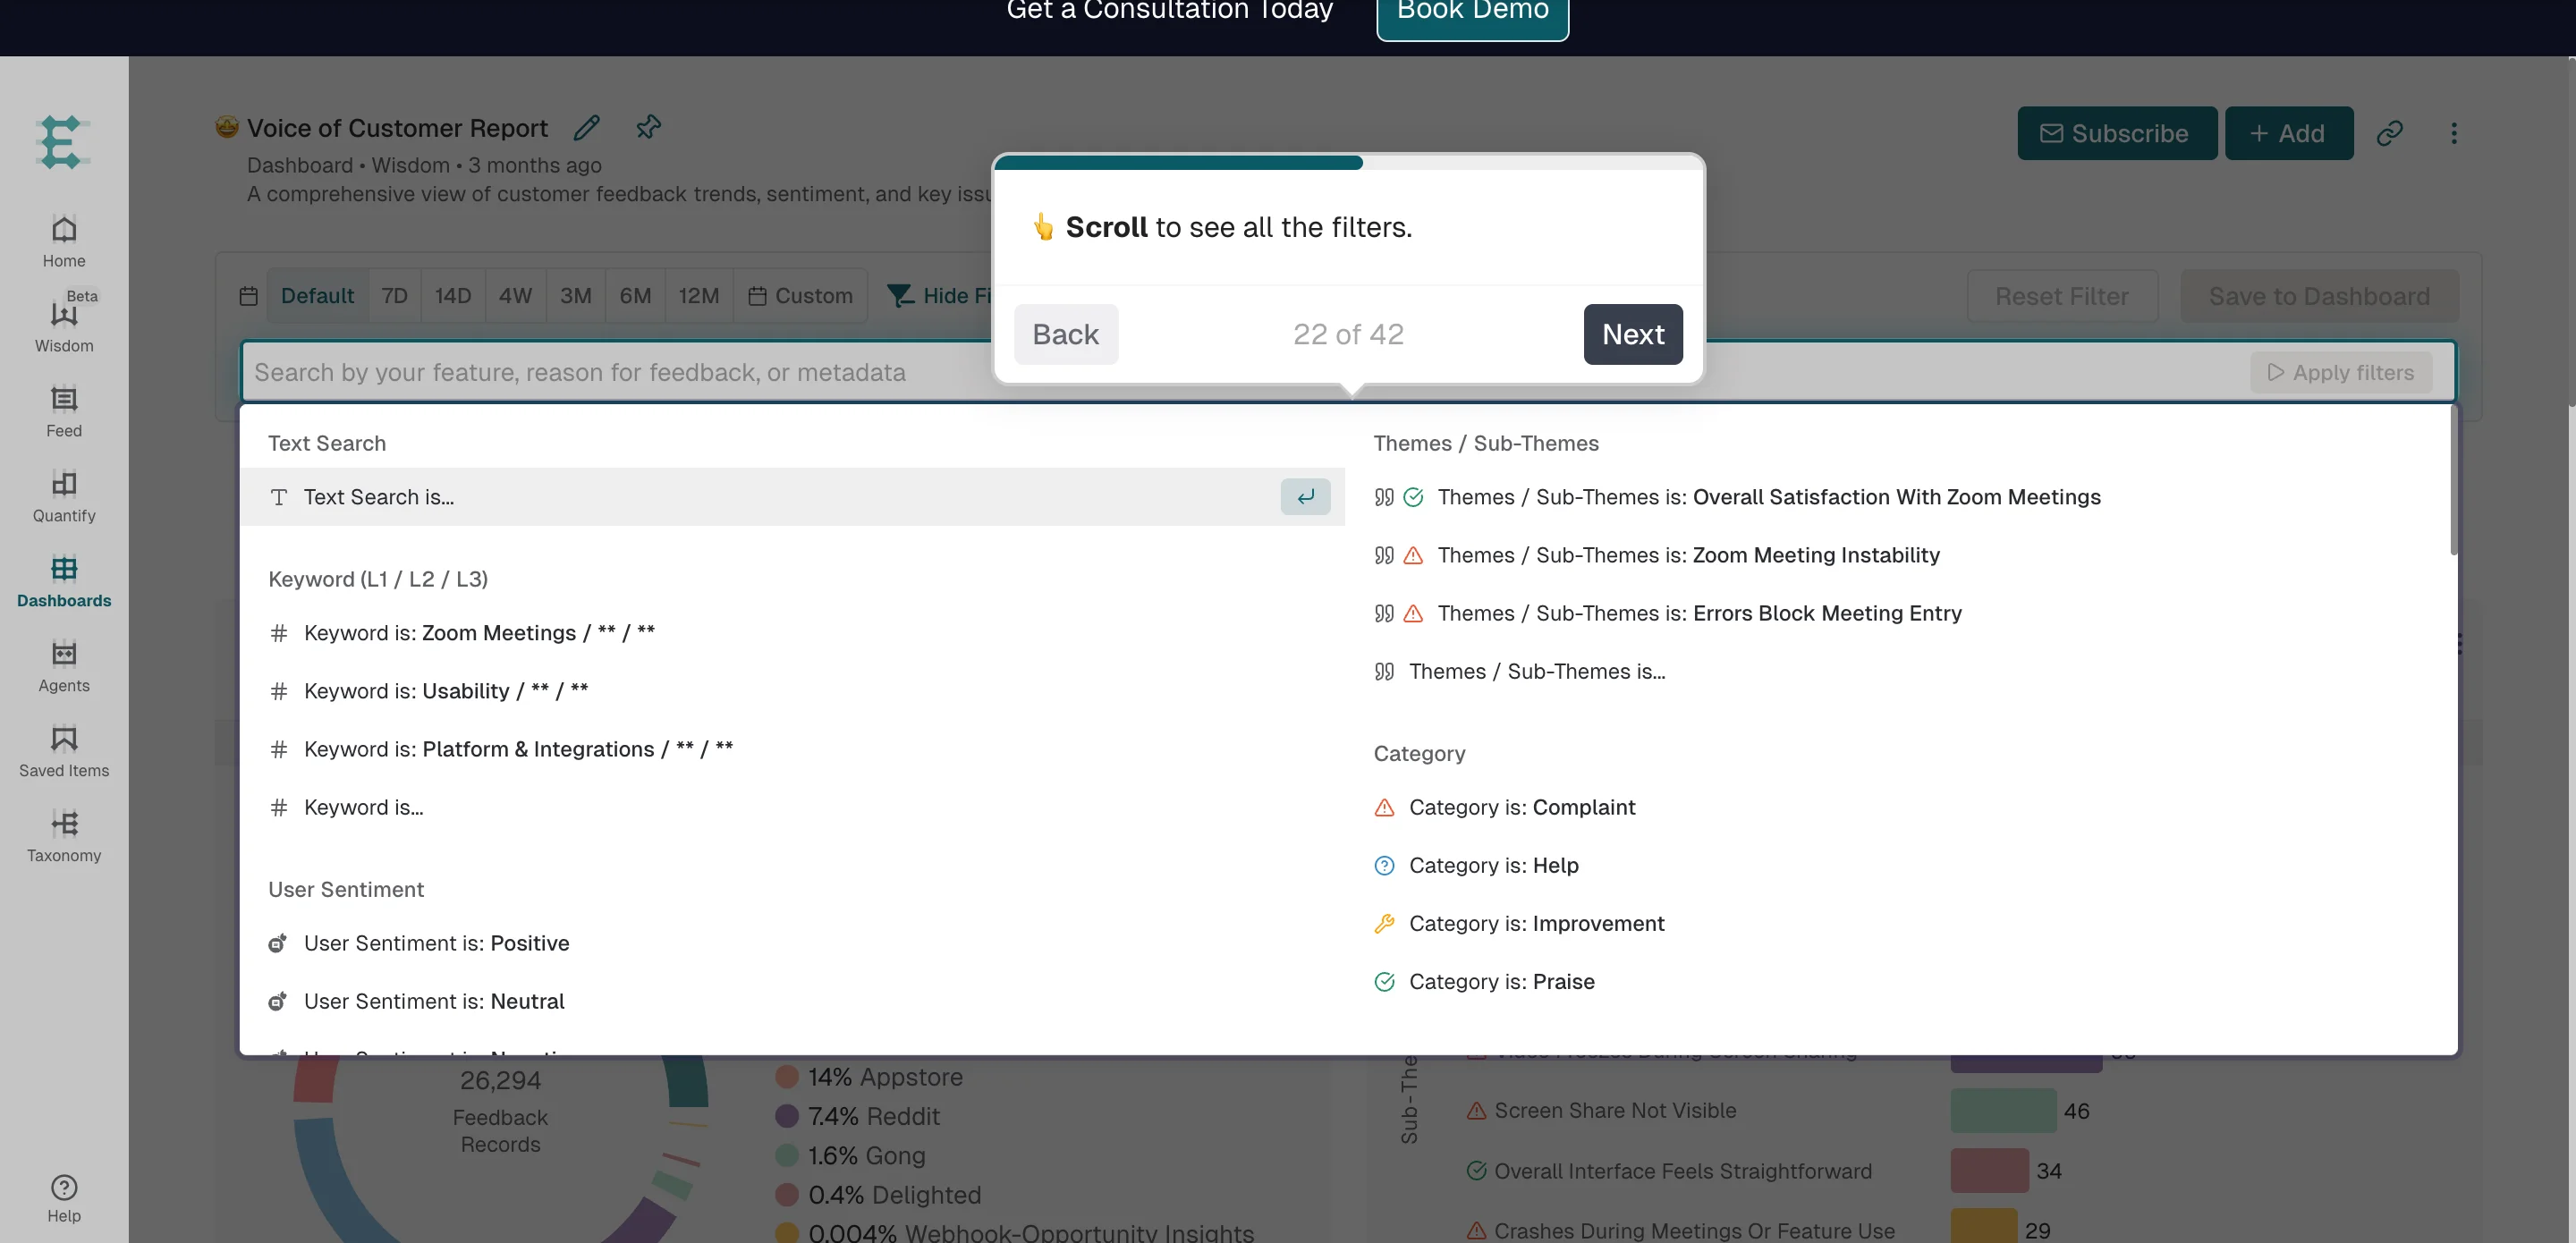
Next on the list of features we’d like to take a closer look at is Dashboards.
Now here, it’s again pretty similar to what Survicate offers, giving you a custom view of your feedback with charts, graphs, and data in bird-view mode. Especially useful for giving easy access to the most important data to stakeholders.
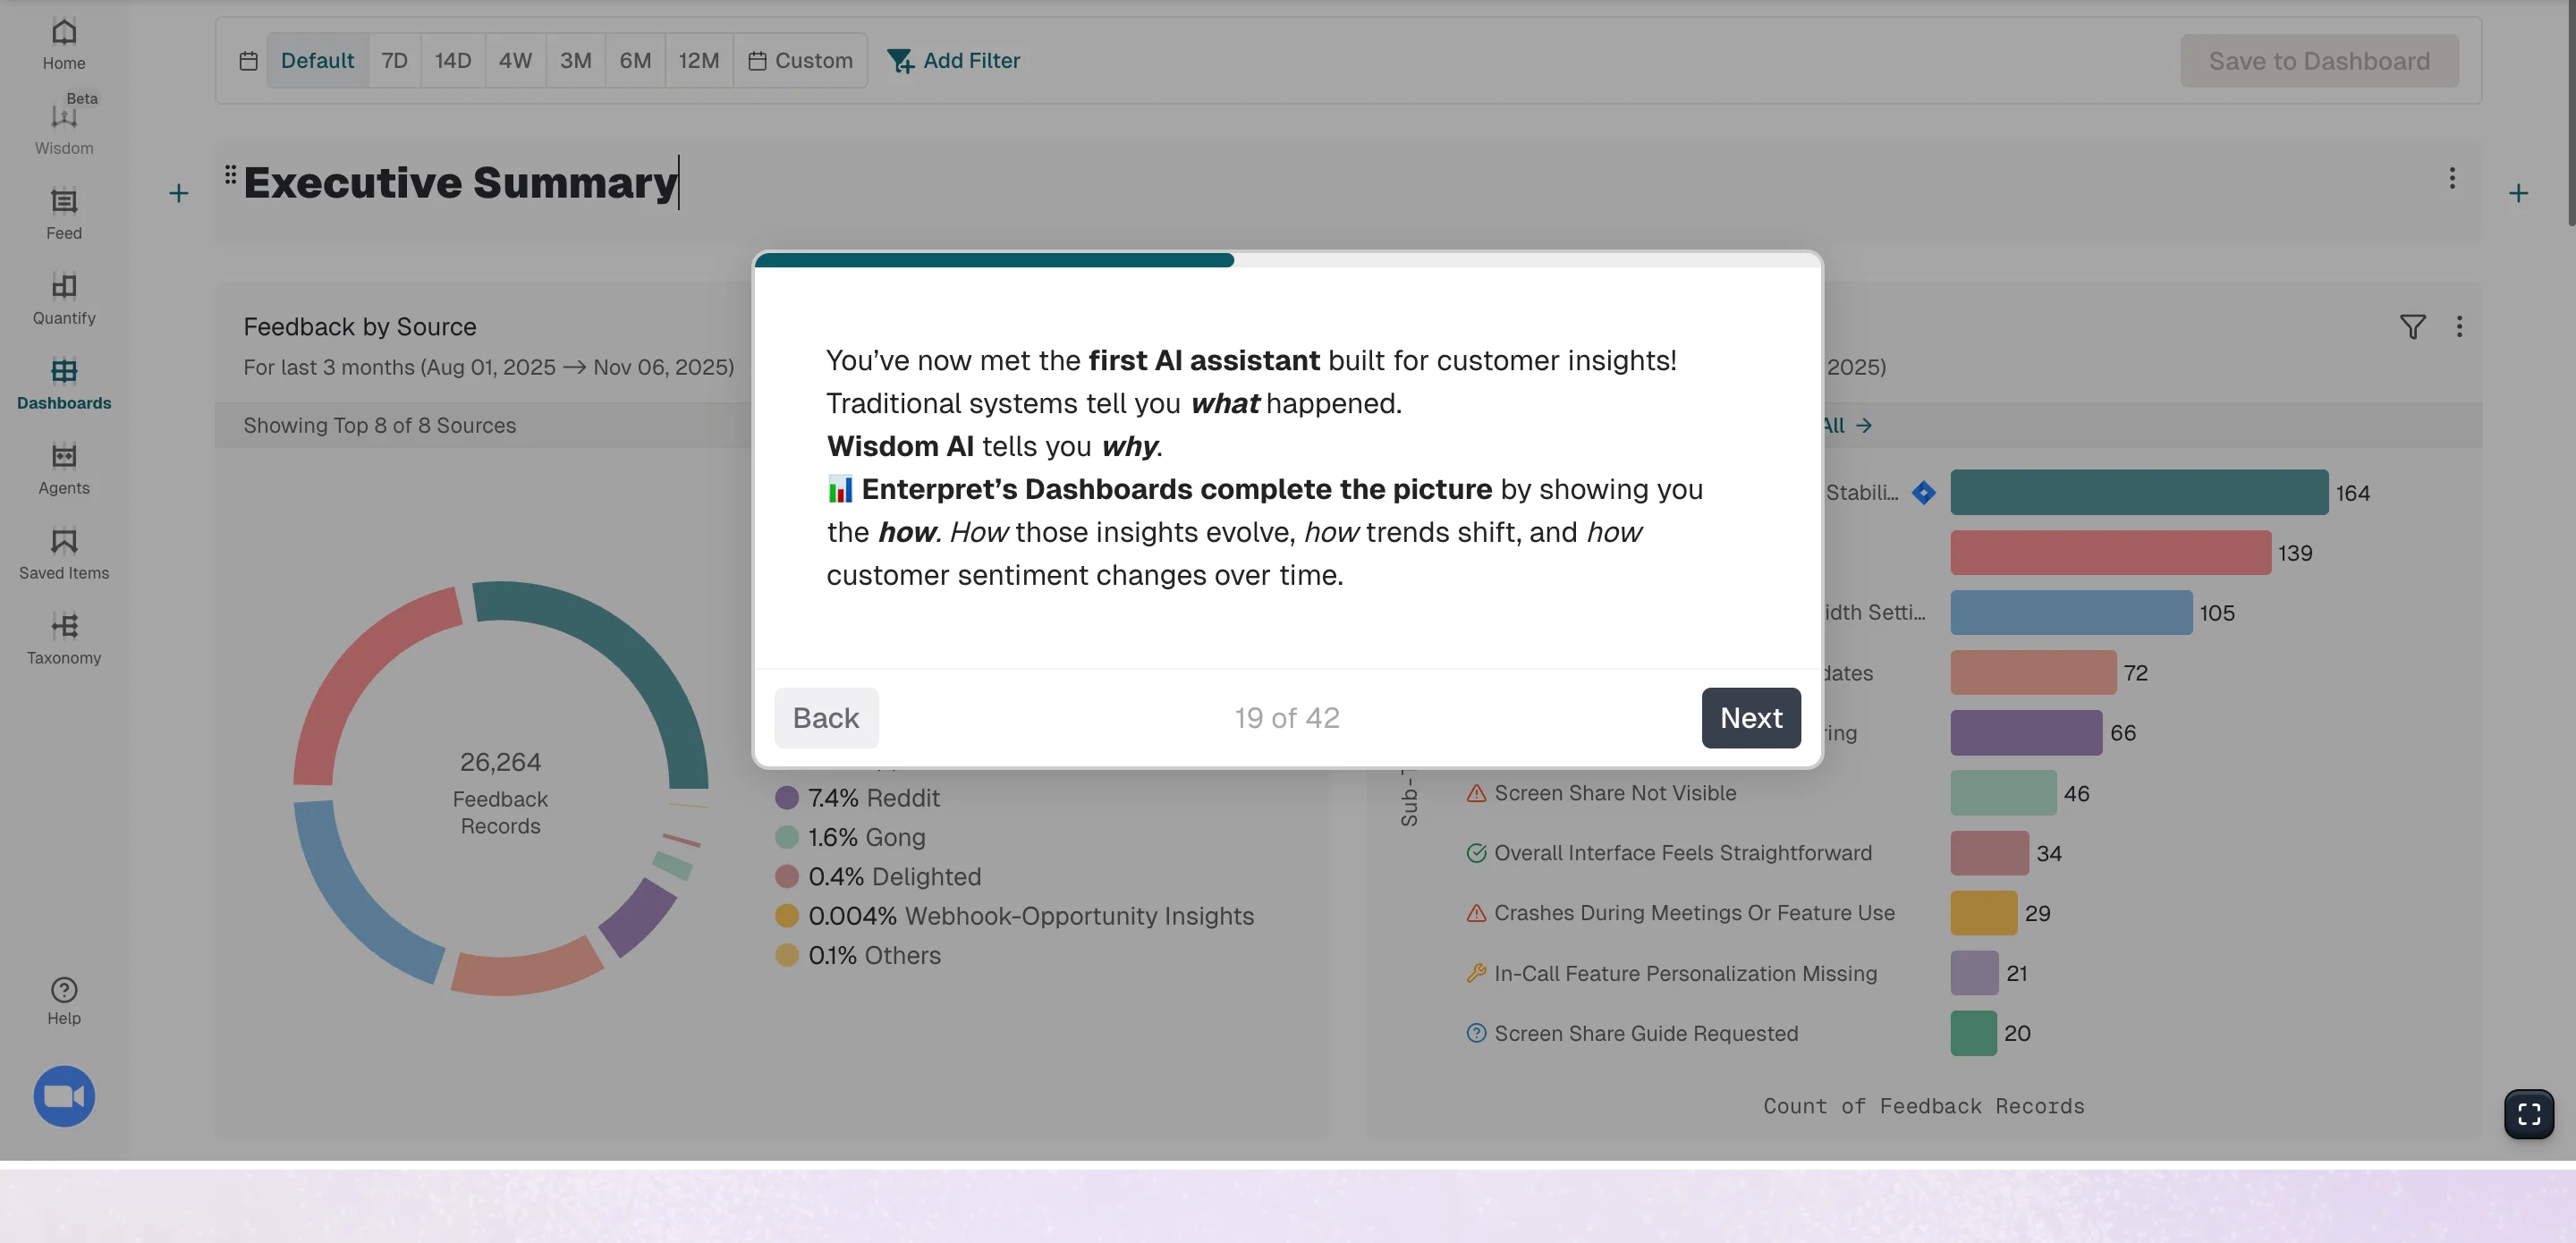
What’s up for praise when it comes to Enterpret’s Dashboards is definitely the amount of filters available. You can break feedback down by keyword, theme, source, sentiment, and language.
From within the Dashboard, you can also reach the trained AI directly to ask any more questions that pop into your head while viewing the data.
To act on feedback, you get to assign work to Jira directly from Dashboards (more on that in the next section.)
But before we get into acting on feedback, we have to mention the biggest con that’s visible even without testing the platform ourselves: the outdated design.
Not the most visually pleasing UI may not only affect the aesthetics, but often hinder how user-friendly a given platform is too.
Although most users who left their reviews for Enterpret on G2 are happy with the ease of use, some report issues with specific features (particularly how granular the platform gets, as explained earlier), but also with how intuitive it is, especially at first.
Saying things like:
- “It can be difficult to get started on, sometimes very simple things can be very complicated.” G2 review
- “Enterpret, while not too difficult to use still is not as intuitive as it could be.” G2 review
Agents
Enterpret is very similar to Survicate (the top, robust research repository solution on this list), in many ways.
Enterpret connects with around 50 external solutions, Survicate with around 45 platforms. Those native integrations make it possible not only to send research or feedback data for analysis, but also to act on the extracted insights.
Say your team learned that the new checkout process in the mobile app is not working as expected, not loading properly for half of the users. Right after spotting that pattern, you can create a direct ask in Jira for a fix to be made.
Or you’d like to set up AI-generated summaries and reports sent directly to a specific Slack channel for easy insights sharing. All those scenarios are possible with both platforms.
Although similar, Entrepret offers a slightly different approach here.
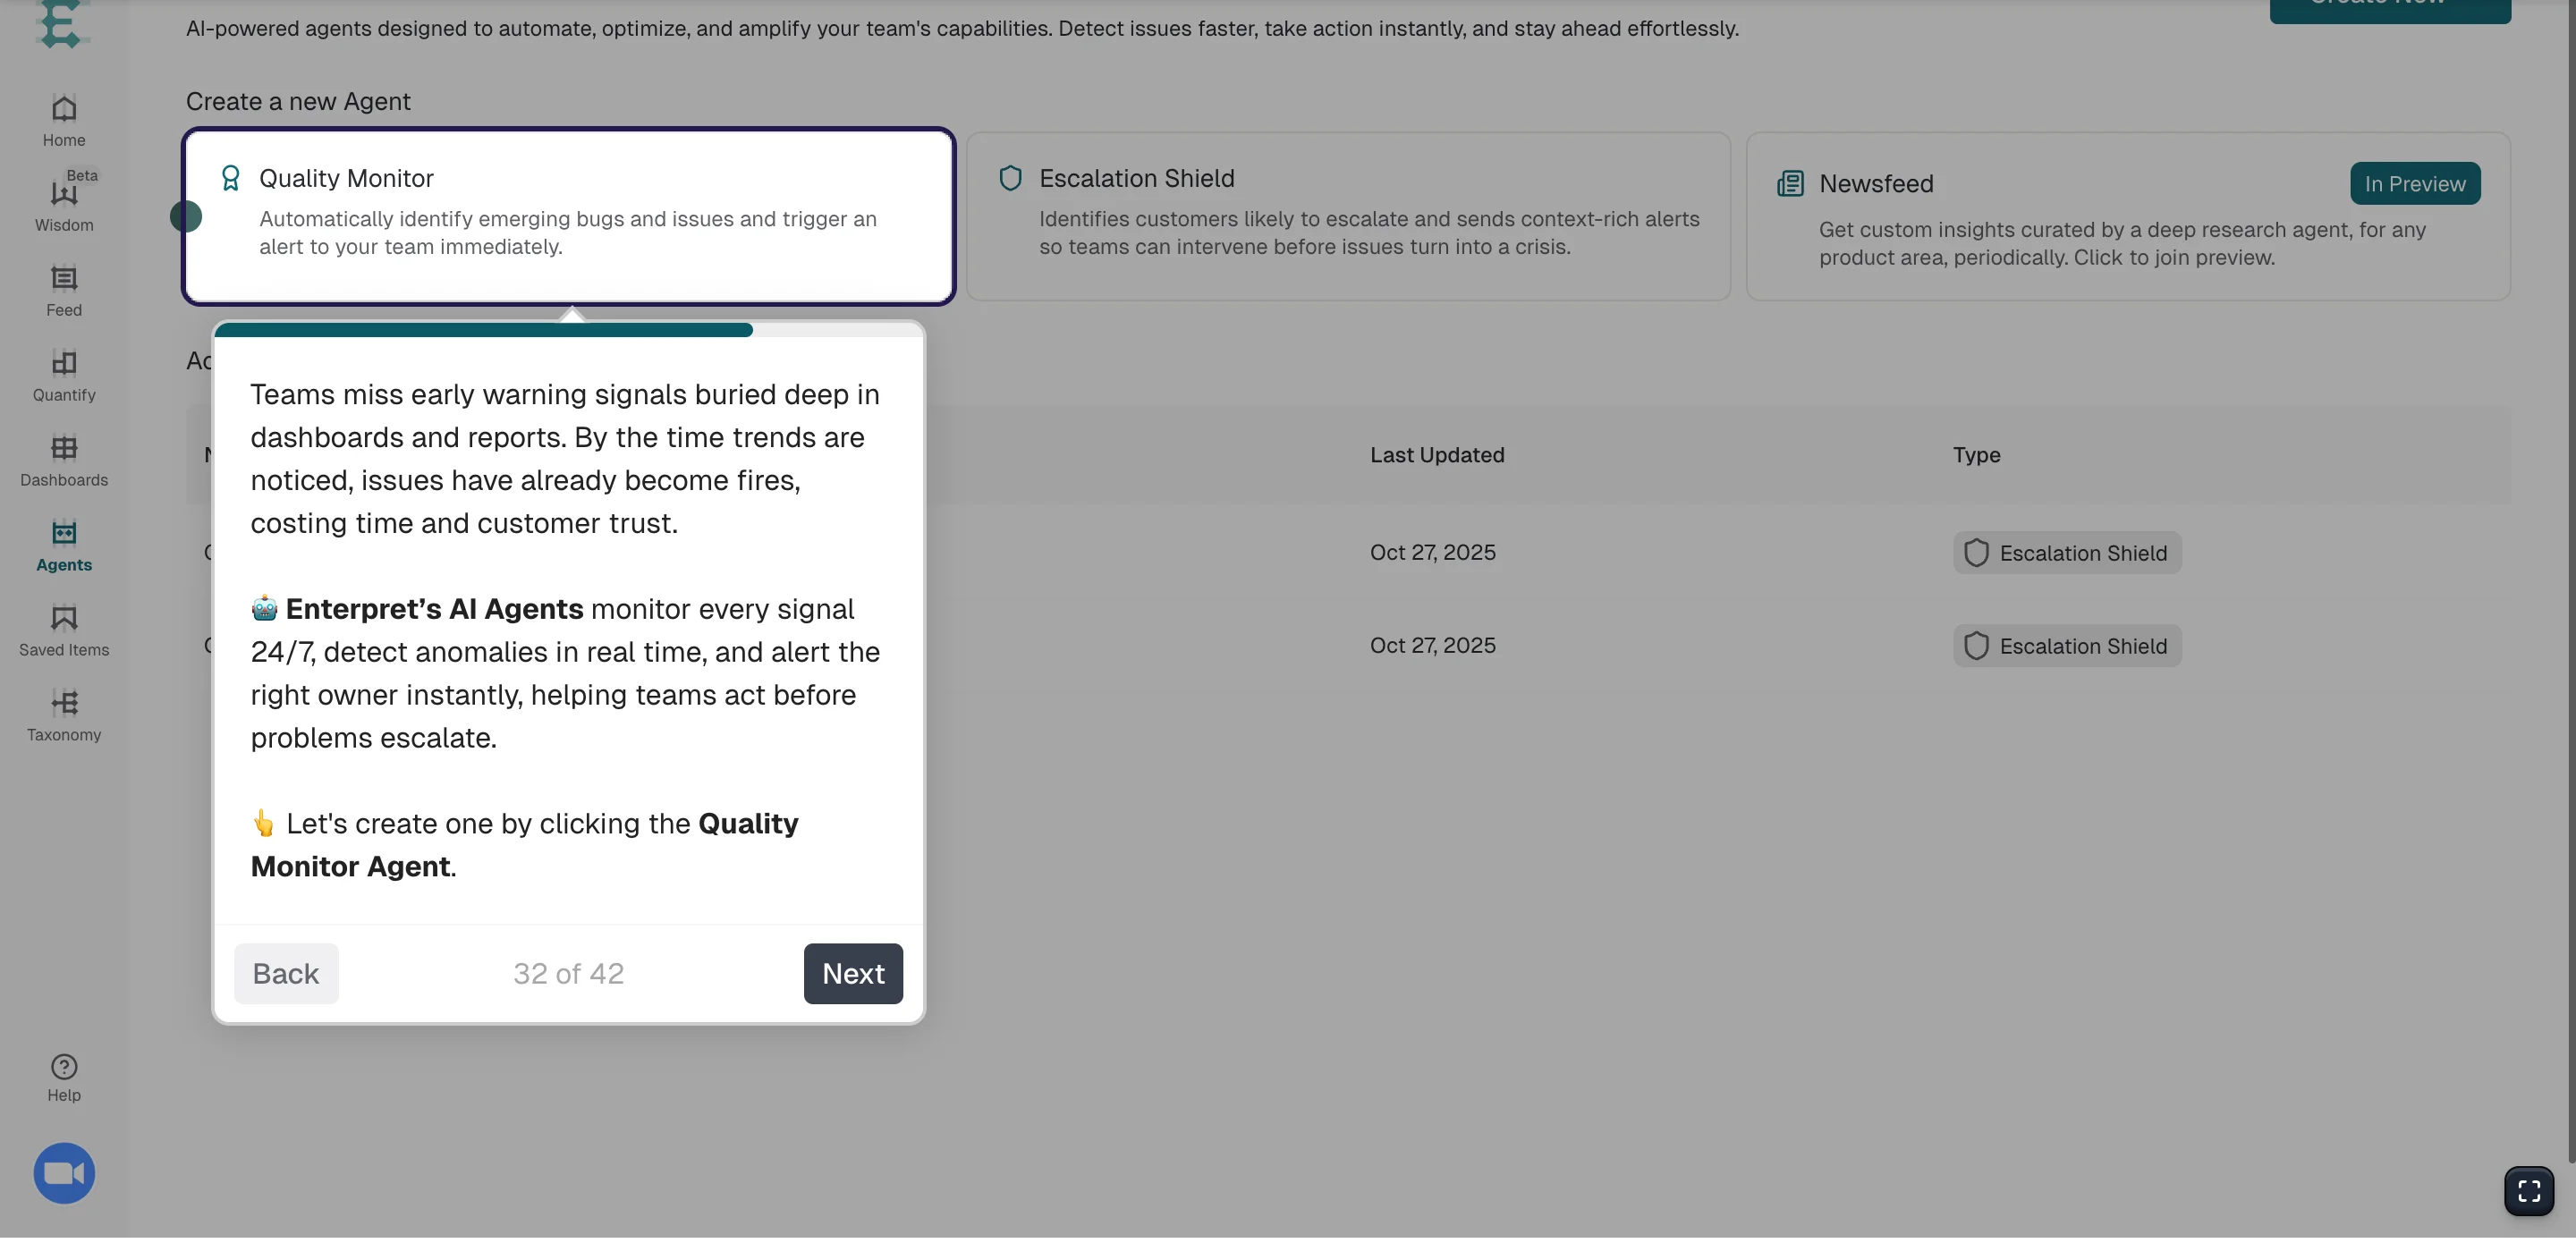
Here, you can choose to set up three different AI agents that track the data within the platform and spot anomalies to then send alerts through a selected channel.
The AI agents in question:
- Quality Monitor Agent: tracks signals constantly, detects anomalies in real time, and instantly alerts the right owner through Slack.
- Escalation Shield: identifies customers likely to escalate and sends context rich alerts so teams can intervene before issues turn worse.
- Newsfeed: customer insights delivered periodically.
Ease of use
Enterpret's ease of use presents a mixed picture with most users finding it easy to use and user-friendly, while some mention specific problems
The platform may have an initial learning curve, with users reporting that getting started can be difficult and that "sometimes very simple things can be very complicated," while others note it's "not as intuitive as it could be."
The platform's depth can create substantial navigation complexity too, particularly around its 5-level taxonomy system that breaks down feedback from high-level themes to individual quotes. Users specifically mention finding "different levels of filters difficult to navigate at first."
The amount of data we can connect with Enterpret can also be a double-edged sword.
For teams managing multiple products with many integrations pulling in feedback, filtering actionable insights from noise becomes challenging and requires time to fine-tune the system for relevant, high-impact trends rather than redundant or low-priority feedback.
Lastly, the outdated design, while not the most visually pleasing, may also hinder user-friendliness beyond just aesthetics.
Overall, Enterpret appears to be a powerful platform that requires a bit of time investment to master, particularly for teams dealing with large volumes of feedback across multiple sources. But definitely not on the super difficult list of platforms that could end up being unusable.
Customer support
With Enterpret, you can certainly expect a good Customer Support team.
Users on G2 explain it best:
- “The Enterpret team are very attentive, and respond to any questions really quickly, whether it's a bug, asking for support with an analysis, or any other questions. They have implemented new features at our request on multiple occasions, and take feedback onboard for small improvements to the UX.” G2 review
- “The support from the Enterpret team has also been great - they're super response, friendly and helpful.” G2 review
- “The implementation process for Enterpret was straightforward and remarkably user-friendly. The Enterpret team played a pivotal role in expediting our onboarding process, offering assistance through comprehensive training sessions, support, and a close working partnership.” G2 review
Pros and cons
Pros:
- Deep, granular analysis with a five-level taxonomy and the most integrations here (50+)
- AI chat with source-linked answers, strong dashboards, and proactive AI agents
- Highly rated, responsive support
Cons:
- Most expensive option (Vendr median ~$40k/yr), with no public pricing
- Depth and taxonomy create real complexity and a learning curve
- Dated UI
My hot take: where Enterpret fits
Enterpret is the most capable tool here for large orgs drowning in feedback across many sources, and the granularity is genuinely powerful.
It's also the most complex and by far the most expensive, and the depth that helps a big enterprise team becomes overhead for a smaller one.
If you have high feedback volume, many sources, and someone to own the taxonomy, it earns its place. If you want most of that capability without the price or the complexity, lighter repositories will get you there faster.
Condens
Condens is a tool that positions itself as a purely research repository tool, aiming to centralize all your user data and insights into one place. This Germany-based platform was co-founded in 2018 by Alexander Knoll, Matej Svejda, and Maximilian Hackenschmied.
At the time of writing this article, Condens’ G2 rating remained solid at 4.8/5 stars with over 90 reviews submitted on the platform.
When it comes to research repository features, Condens checks off:
- Organizing research data into Projects,
- Data upload (csv files and limited external integrations),
- Charts and highlights,
- Sharing insights with stakeholders,
- Miro or Figma-like boards with different research templates,
- Managing a participant pool (adding manually and importing participant data).
Unfortunately, Condens is a platform that requires much more time spent implementing your research data into, as well as manual tagging, in order to receive highlights and charts that previous tools all generated manually after auto-categorizing connected data.
Condens pricing
Condens offers three pricing tiers designed for different organizational scales.
The Lite plan starts at €15 per month (or €165 annually, saving you one month) and targets individual researchers or small teams working on discrete projects. It includes one contributor seat with additional users at €15/month each. You get unlimited automated transcription, core analysis tools, basic integrations, unlimited projects, and the ability to share findings publicly via read-only links. Personal support and onboarding are included.
The Business plan costs €500 per month, billed annually at €6,000/year, and is built for organizations scaling research across multiple teams. It includes five contributor seats, with additional contributors at €85/month each. Beyond everything in Lite, this is the plan where you get access to the repository features for centralized knowledge management, access to all integrations, unlimited viewer seats for stakeholders, a dedicated interface for non-researcher stakeholders, and data security assessments. SSO and HIPAA compliance are available as optional add-ons.
The Enterprise plan offers custom pricing for organizations with specific requirements, starting at a minimum of five contributors. It includes everything in Business plus negotiable contract terms, service level agreements, automated data deletion capabilities, and advanced user and permission management features.
Unfortunately, there’s no data for average Condens costs, so we decided to take a peek at G2 reviews some more, and find some information there.
Out of a little over 90 reviews, 3 mention Condens being a bit expensive, specifically if your organization is rather big.
- “I would like pricing solutions for small business (ex: something in-between 50-100$ for 2 researchers with repository features).” G2 review
- “Unfortunately, the bill can get salty if your organisation is big. But the product is worth it.” G2 review
Features overview
Let’s dive into specific research repository features in Condens.
Projects and data upload
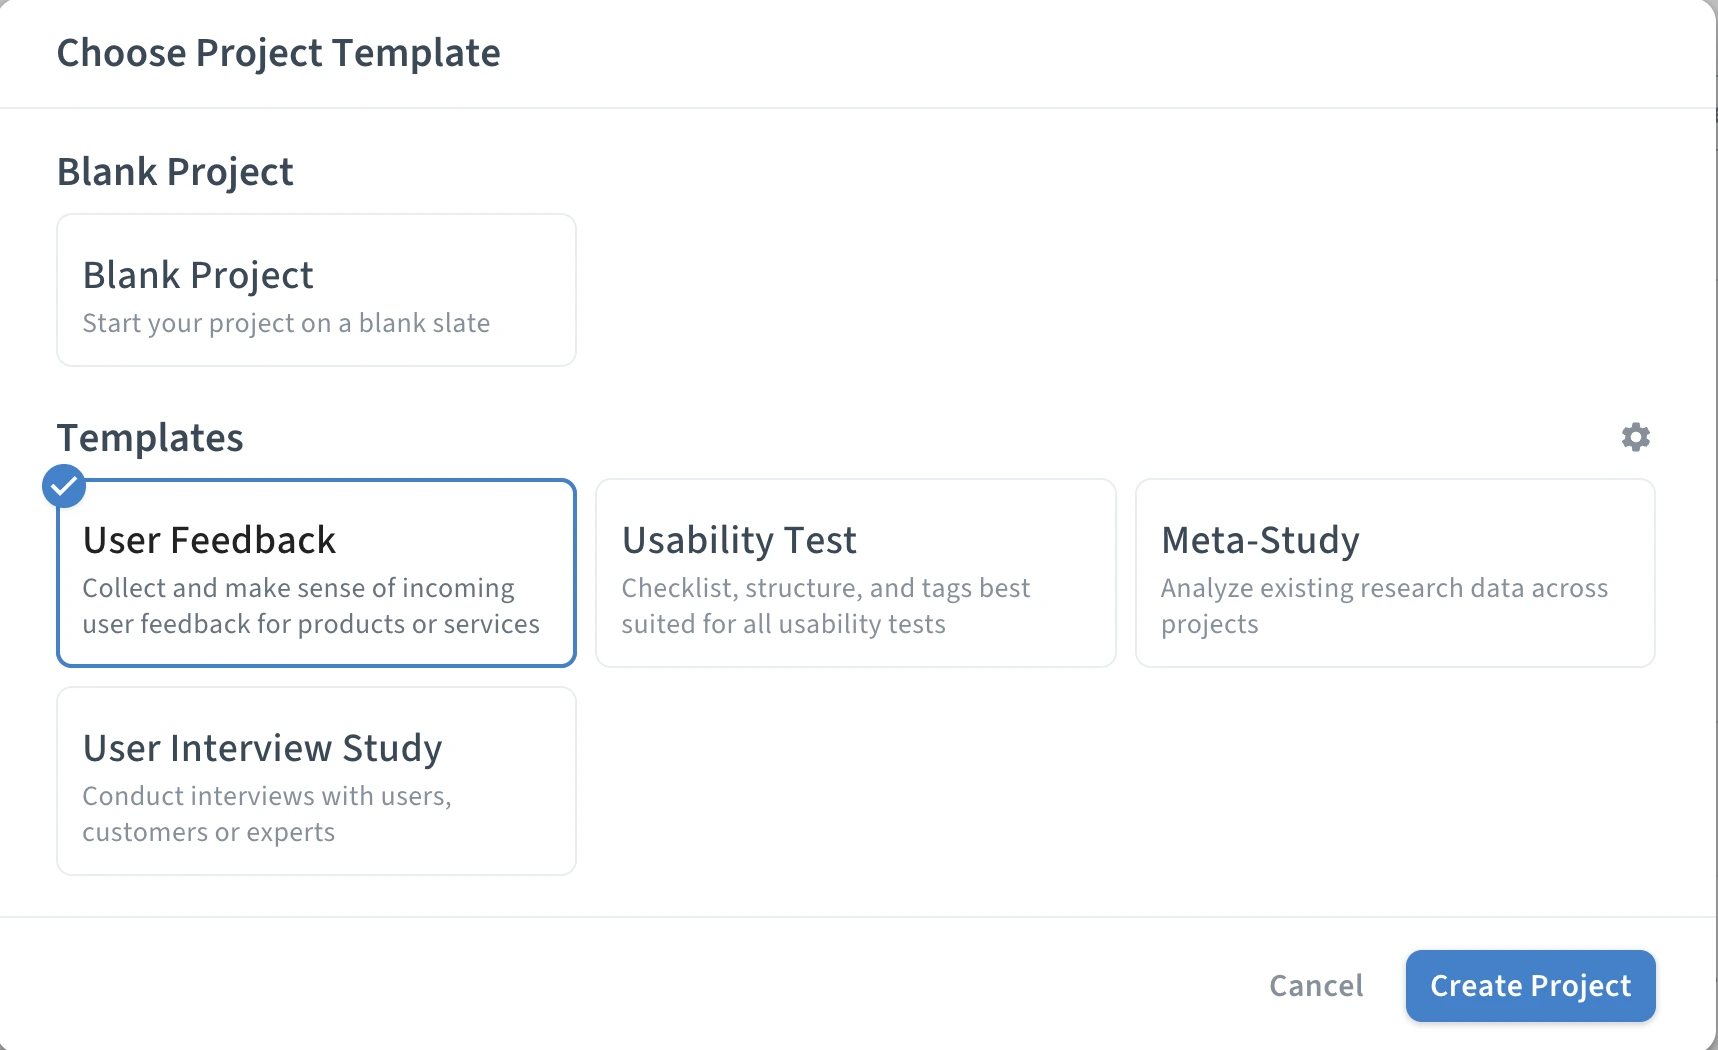
Starting with Projects, one of the core elements of Condens platform. To add one, click “Create new project” and choose one of the available options, from starting with a blank page to using a few templates (user feedback, usability test, meta-study, and user interview study).
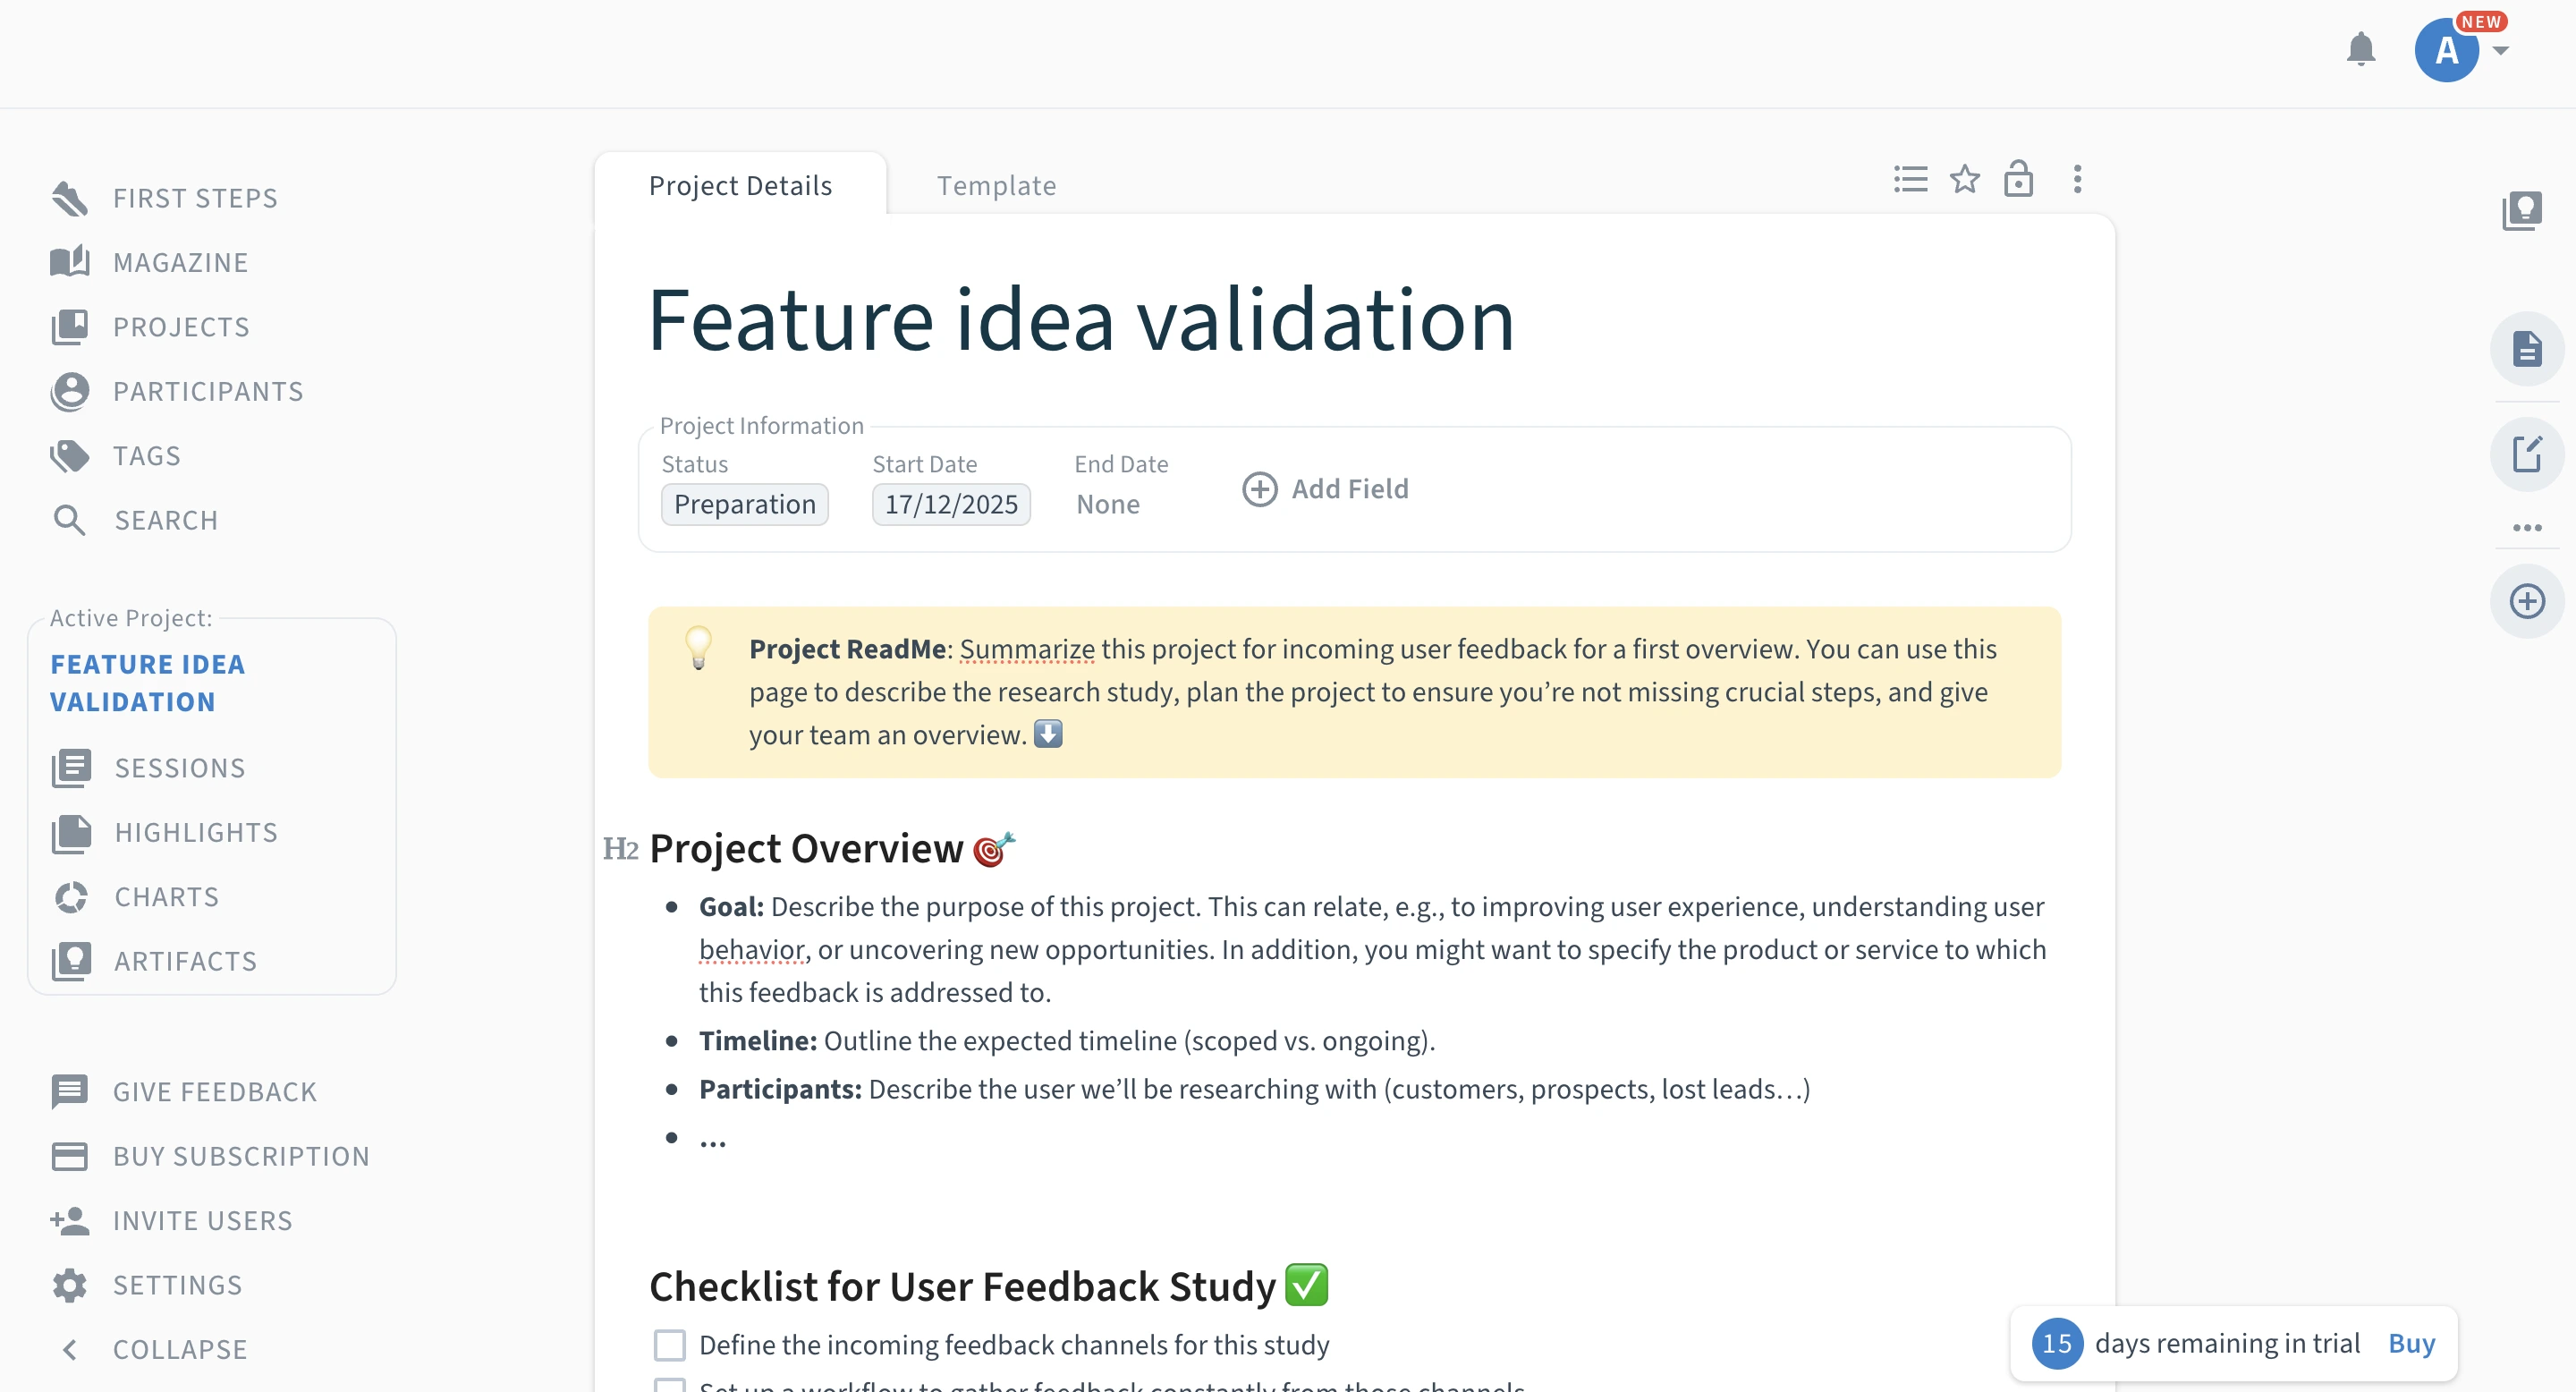
Unfortunately, at first glance Condens projects seem to be a less-modern replica of Notion pages with the possibility of manually adding data points into each Project. Adding new fields into the page, choosing from various field types, such as participant’s name, email address, to their answers in the study, from single select and multi select answers to NPS or simple open text fields.
As you’d imagine, adding all of your research data that way would take you straight to your retirement.
Contrary to what the tool presented, the platform’s website let us to believe there’s much more to Condens than it seemed at first sight. So we dug a little deeper, and found you can actually upload existing research data into the platform, it’s just not that obvious on how you do it.
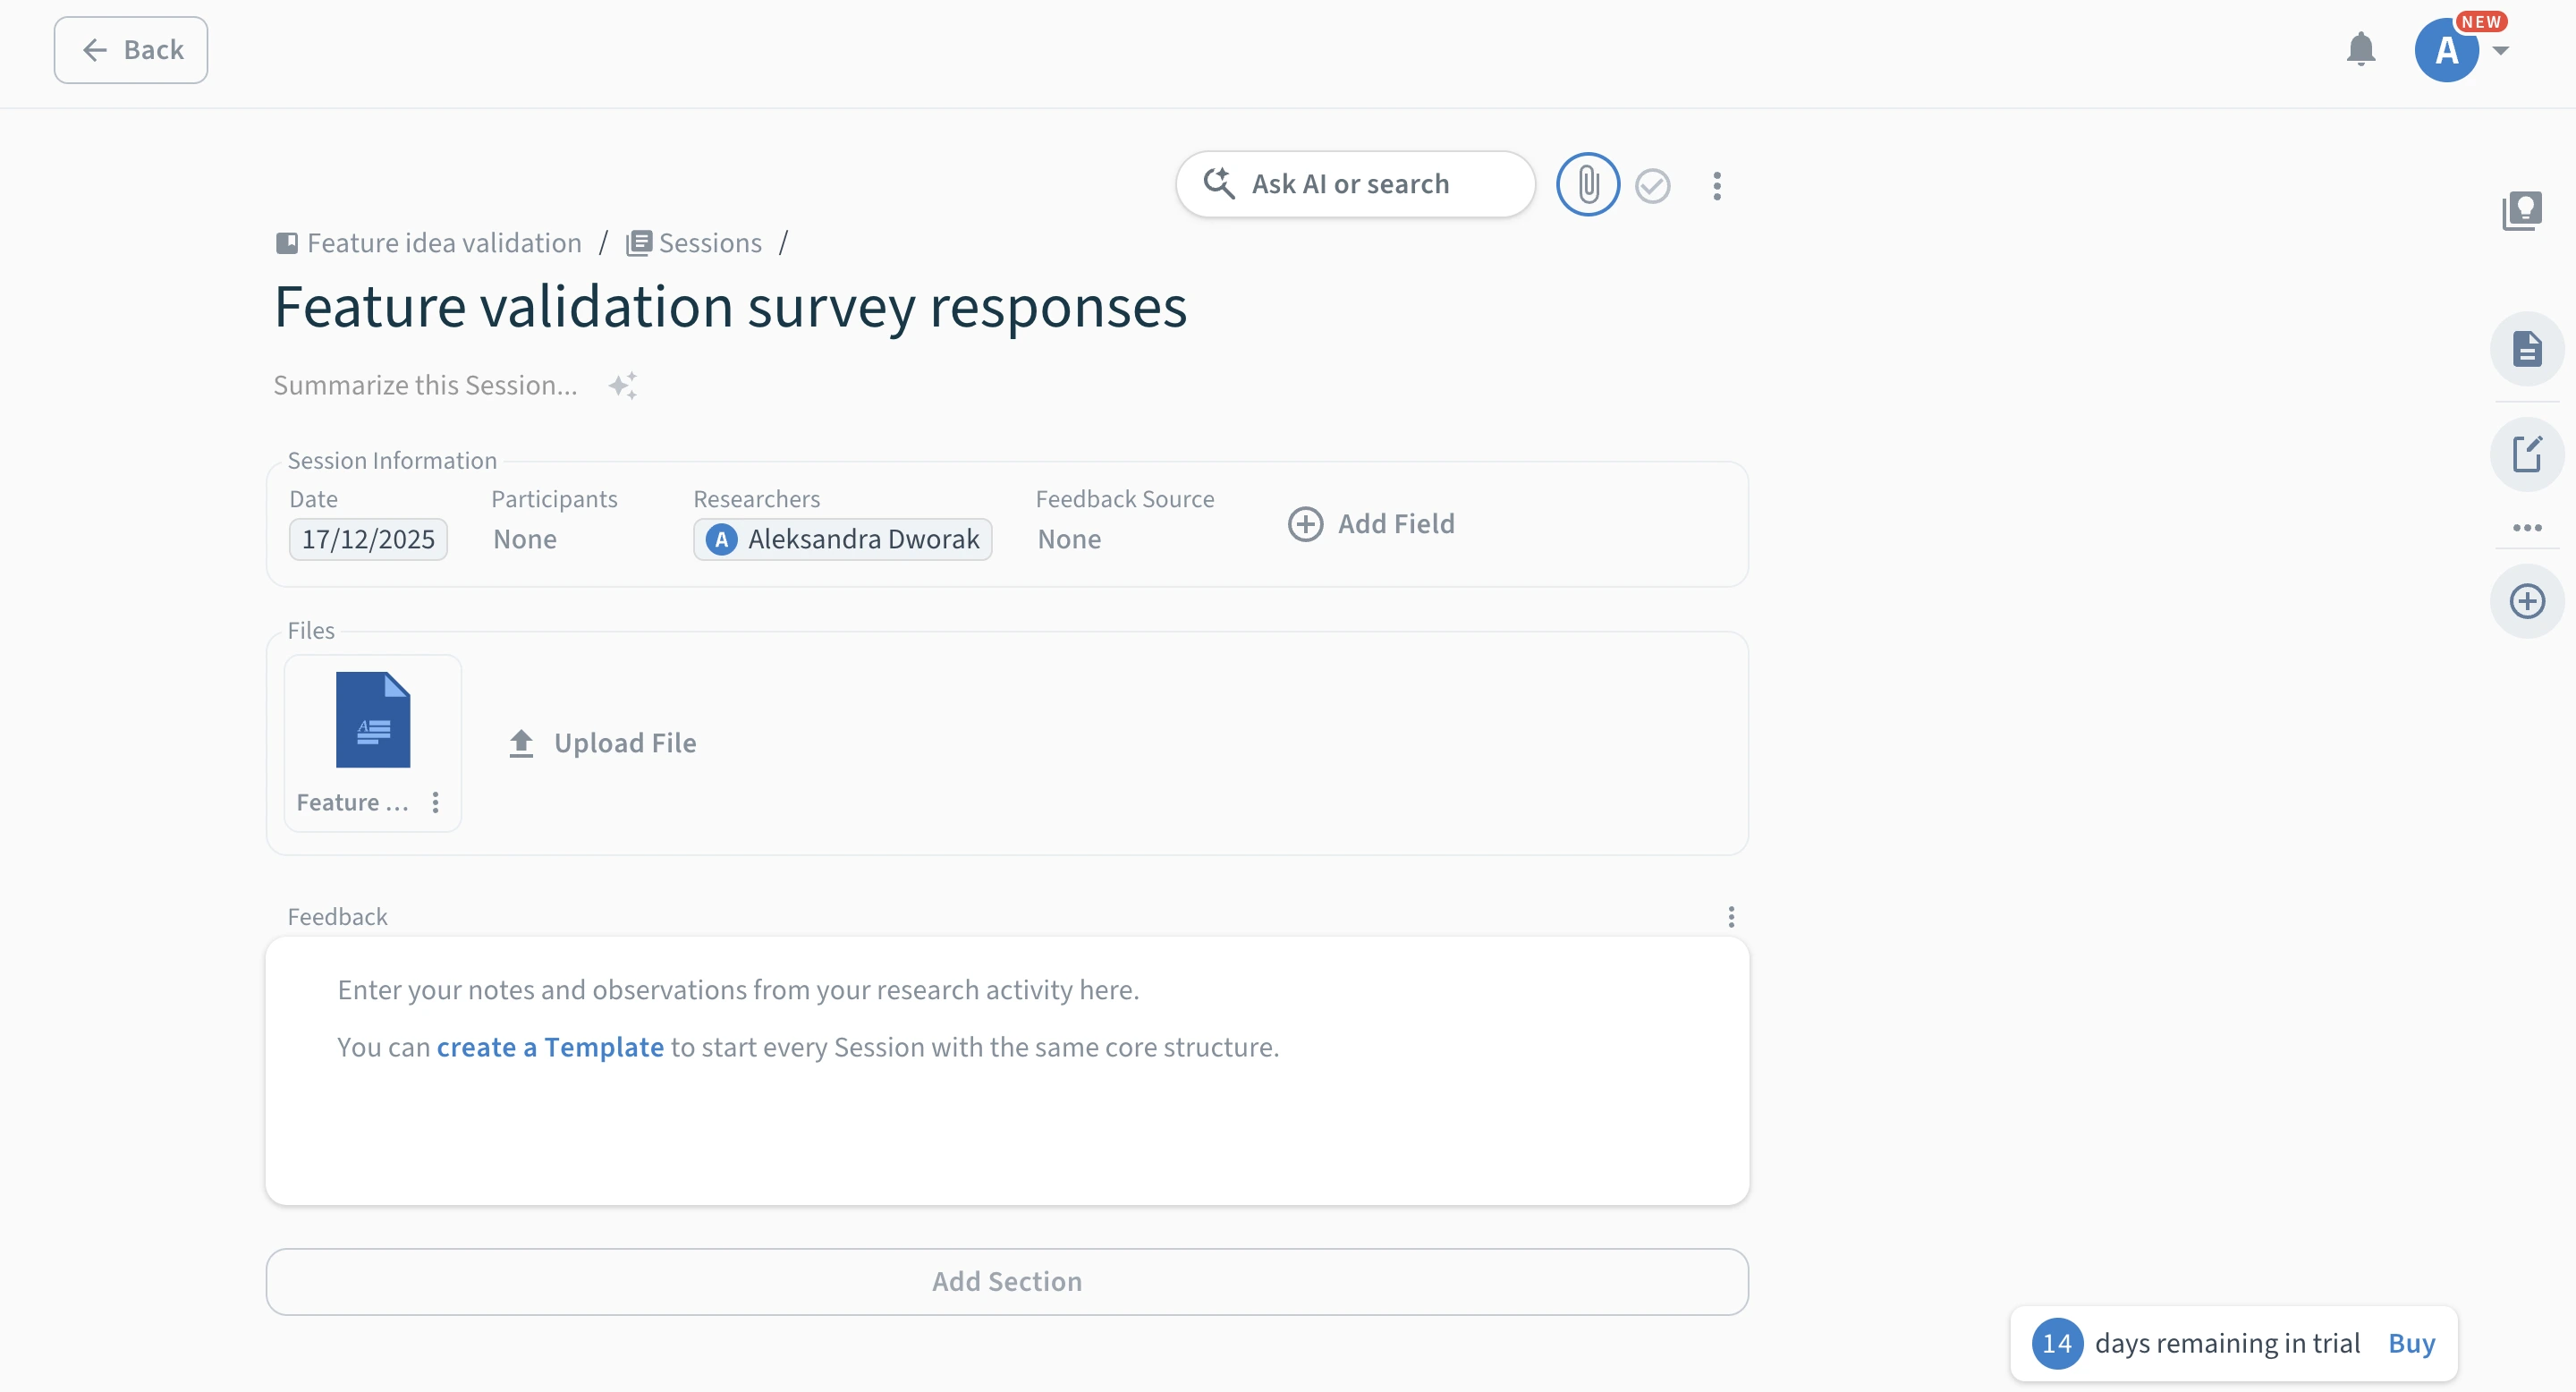
To do the import, you have to go into Sessions and from there, create a new session (again, either a blank one or start from a template), where you can name your session and (ding, ding, ding) actually upload your files.
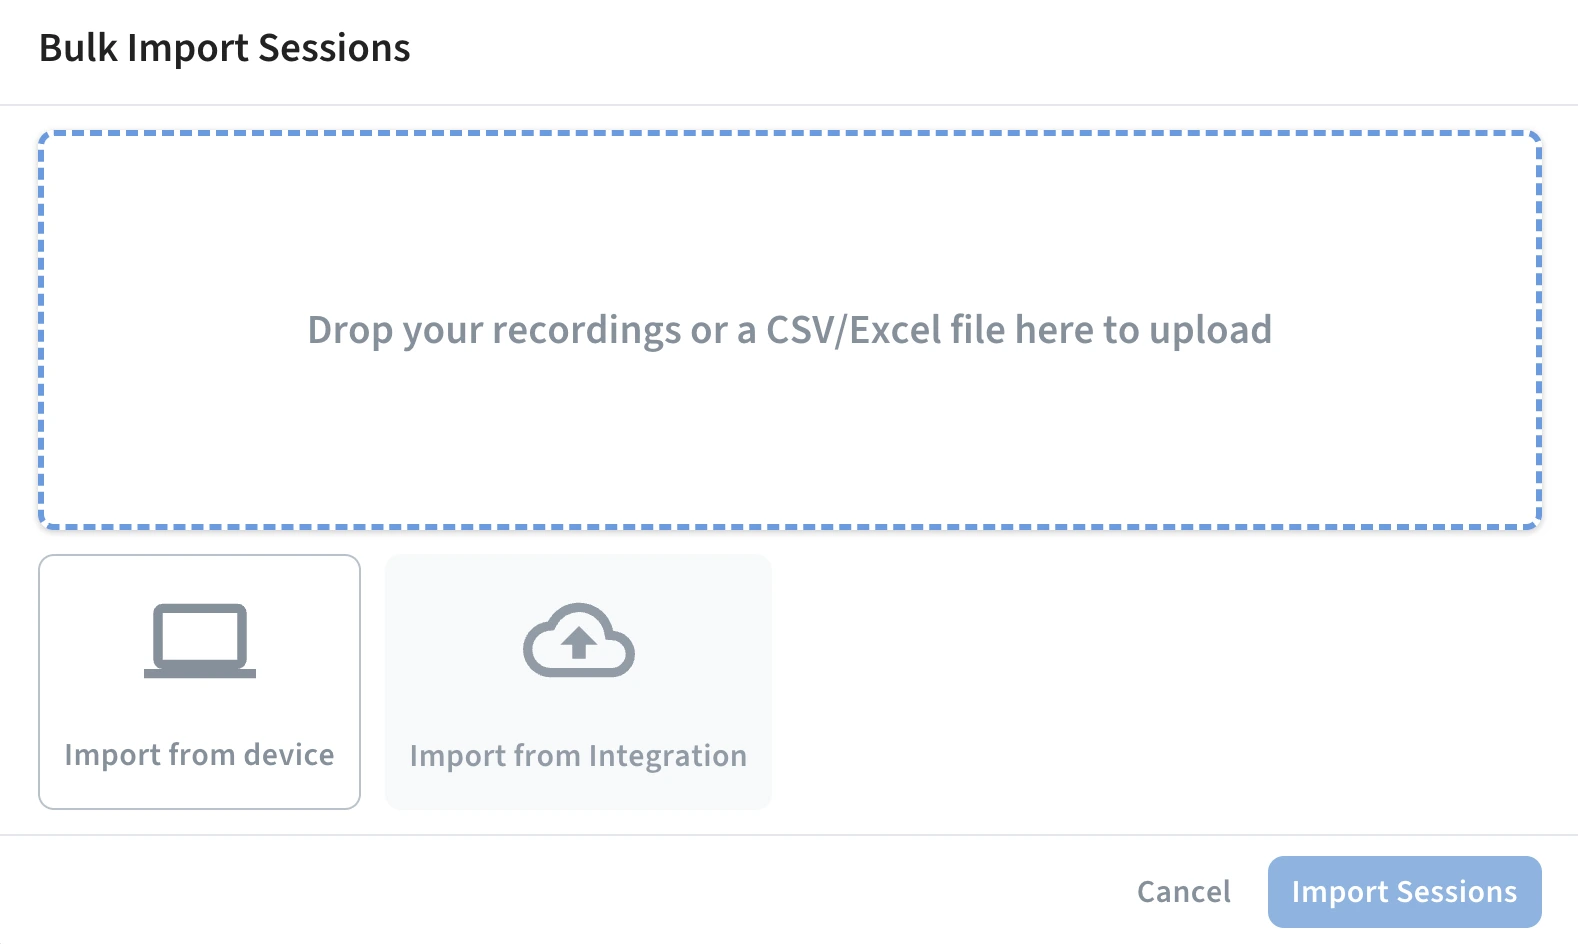
Figuring out how to integrate data with Condens was another story. Turned out, it’s available with bulk upload only where you get to choose to sync data from:
- Zoom,
- Google Drive,
- Microsoft Cloud Storage,
- UXtweak,
- Slack,
- Microsoft Teams,
- and Zapier.
Which is not as big of a selection as the previous two platforms offered.
Only when uploading from the main Sessions view within the Project do we get the option to actually select how we want the data to be imported. After this moment, the upload finally goes smoothly.
The uploaded csv file shows accurately reflected on the platform, with questions named and presented correctly. Besides just looking at the data, you get to re-attribute fields if they have been recognized incorrectly and not import rows you don’t need.
Unfortunately, each data row (when uploading from a csv file) is uploaded as an entirely separate session (similar issue to what happened in Dovetail), making the Sessions view a bit cluttered.
Data analysis
Unfortunately, data analysis is not presenting any better in Condens. In fact, that may be just where the platform really goes downhill (sorry!).
While both Survicate and Dovetail automatically analyzed uploaded files and connected external sources for insights, Condens plays much harder to get.
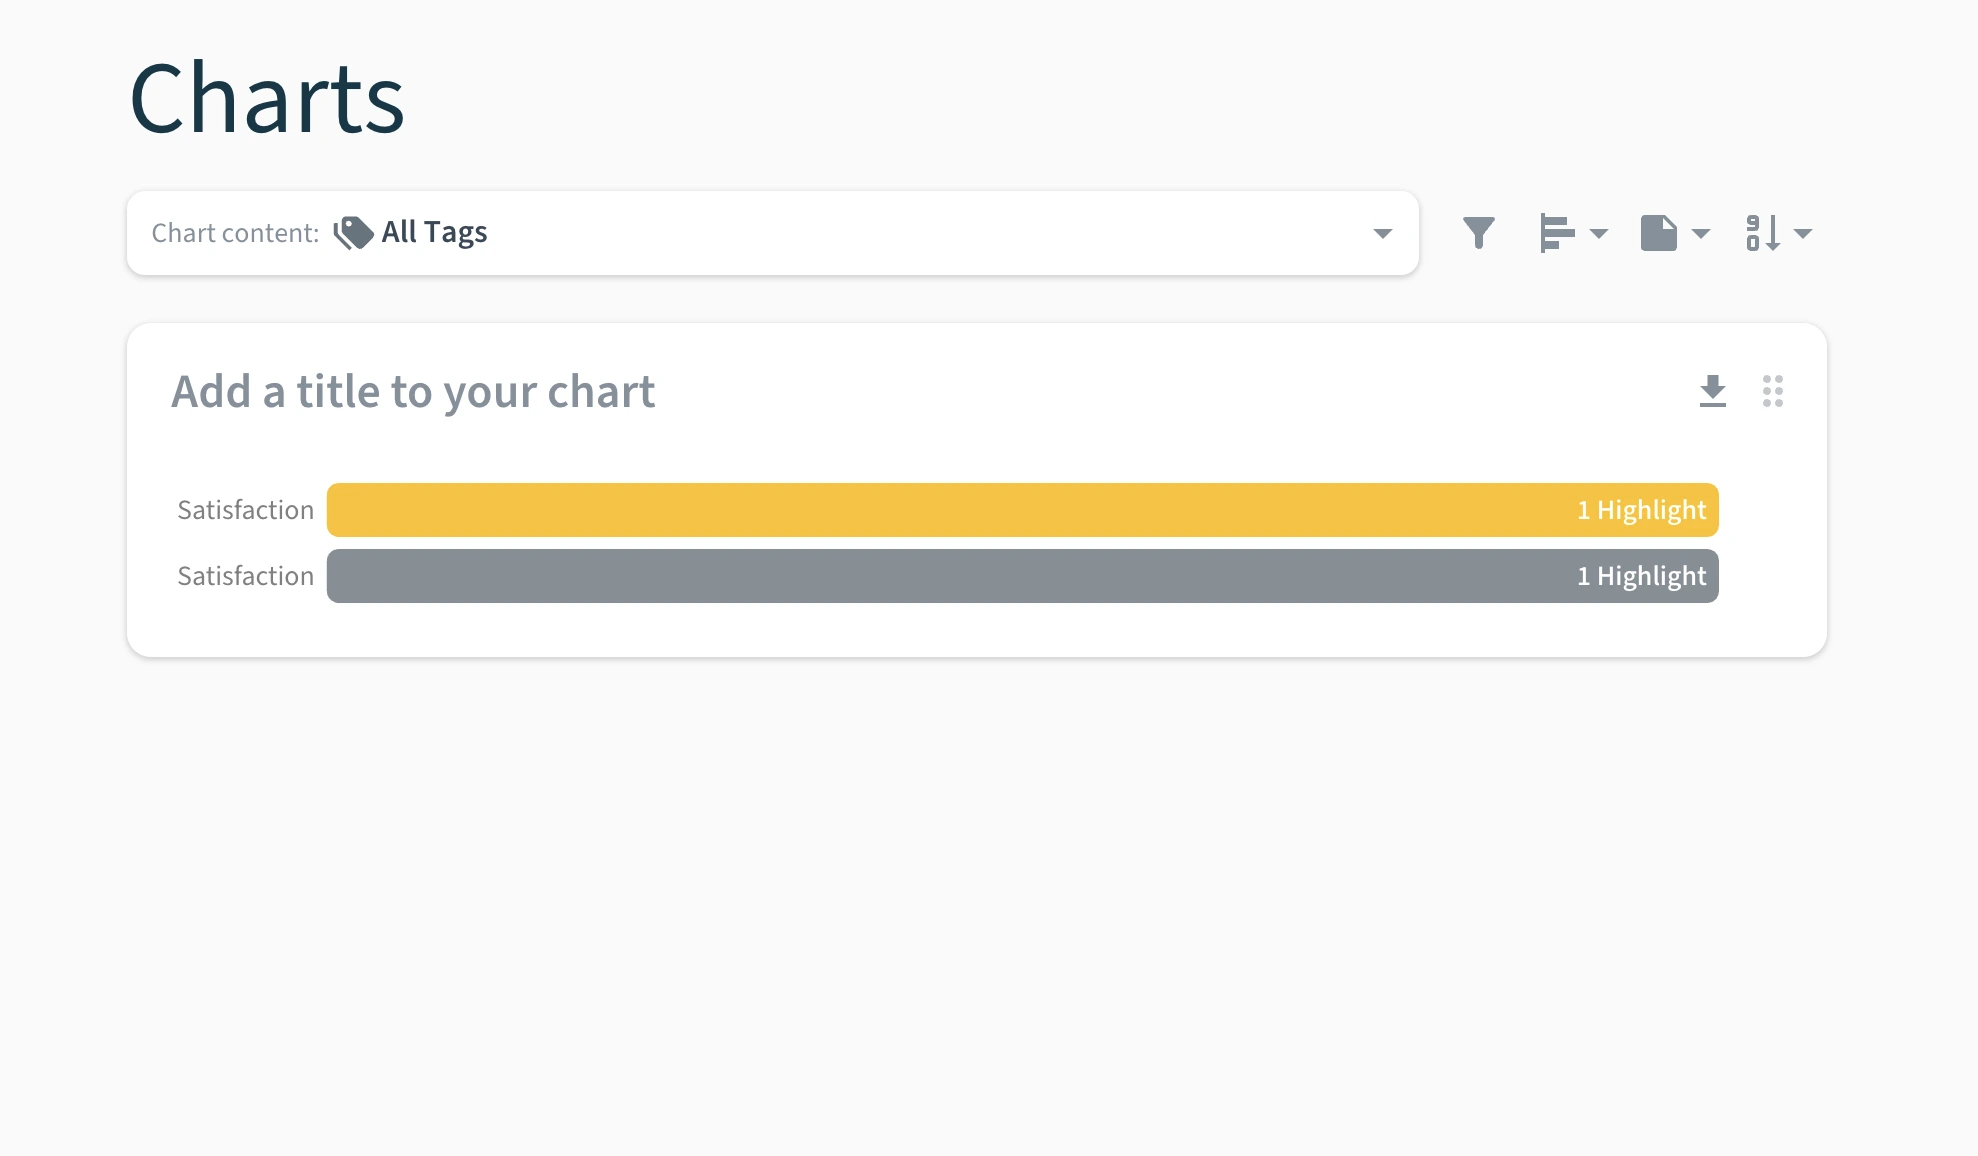
For analysis, besides the Notion-like Project page you have to write ourselves, there are two more tabs you get to ‘use’: Highlights and Charts.
You’d think these would automatically be there in a platform that claims you can “unlock insights from raw data in minutes” and “speed up your analysis with the power of AI”.
Well, the AI is nowhere to be found (when we finally did, it didn’t help much), and for the research highlights and charts to actually appear, you have to tag each data point yourself. Just to make it clear. In an AI-based platform, you have to…Tag. Each. Data. Point. Yourself. 🙂
Only then, you get Highlights and not-the-best-looking charts in their respective tabs.
Miro, Figma, and other artifacts
We’ve already mentioned how Condens Projects resemble Notion. Well, the platform does not only incorporate Notion-like pages, but also Miro or Figma-like pages too.
In each Project, you get to add different artifacts to complement a given research study. You can choose from:
- an empty note or an empty whiteboard,
- a report template,
- a finding template,
- a persona template,
- an affinity map,
- a user journey map,
- an empathy map.
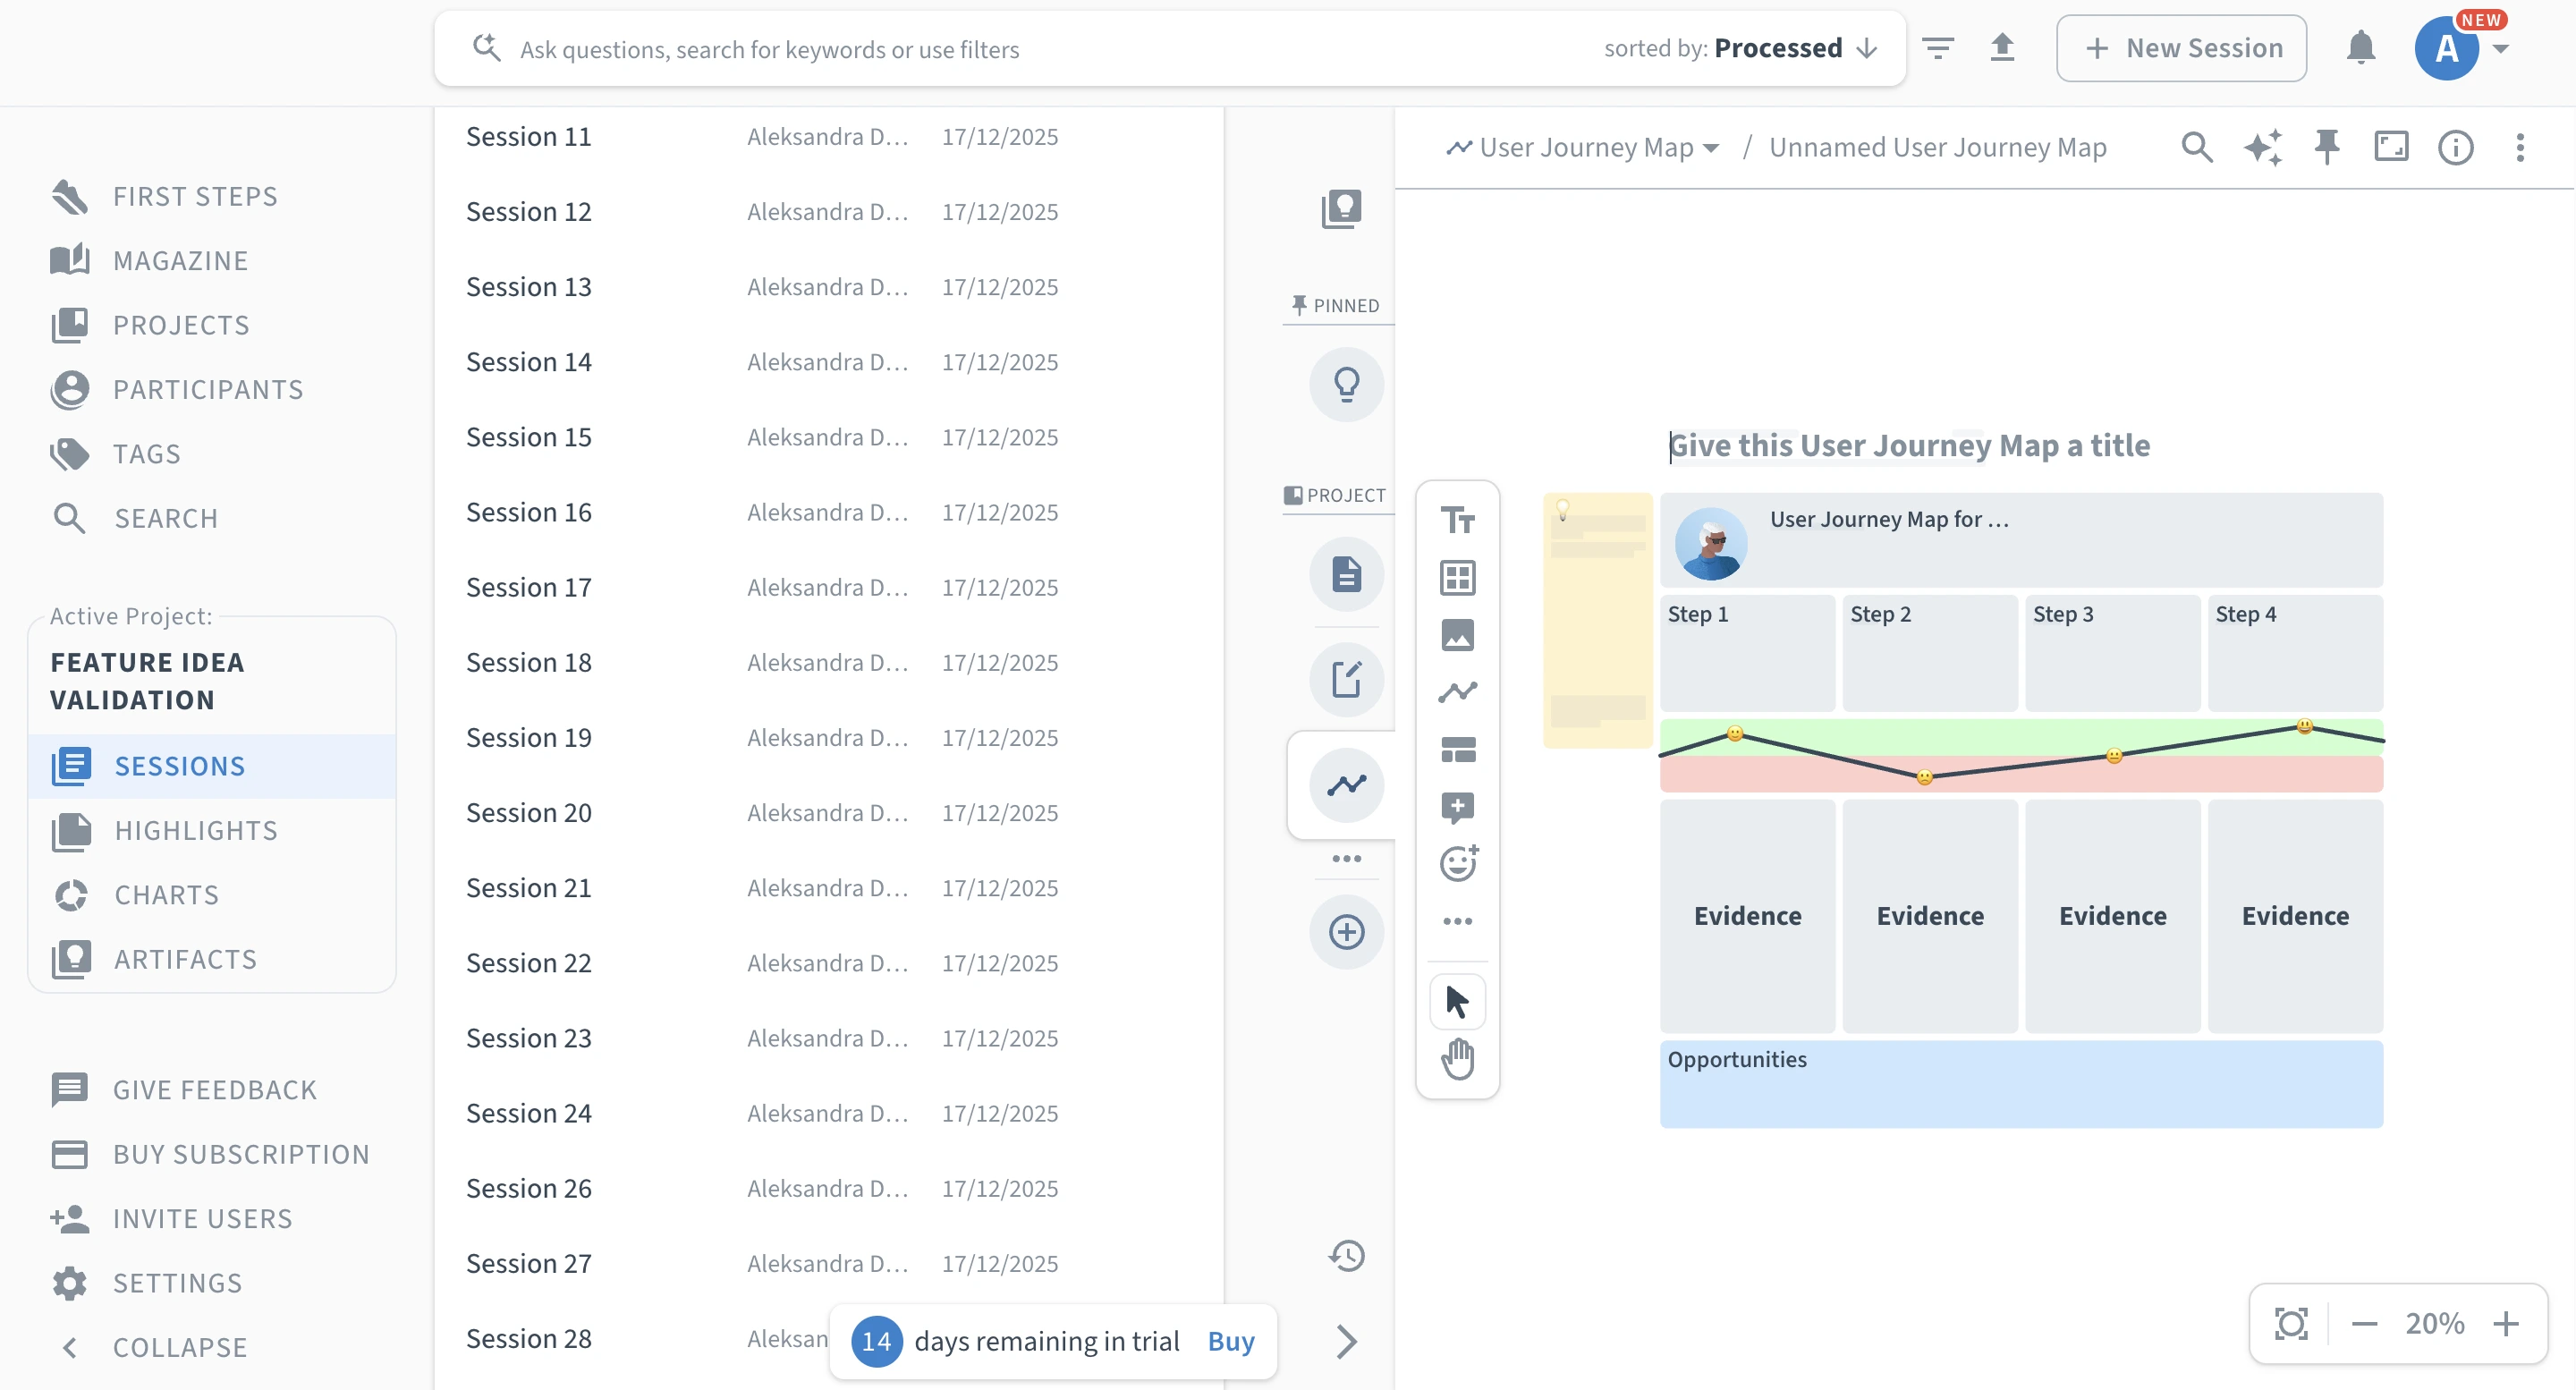
Fun fact, playing around with a user journey map, we finally got to see Condens’ auto-categorization and theme-spotting feature in action (worked well!).
Not sure why this functionality is not available elsewhere in the platform, and instead hidden so deep.
Overall, the templates seem to be pretty valuable (again, not the most modern), but pretty practical if you don’t mind the manual work attached with filling them out here on the tiny page in Condens.
The Magazine and role-based access
Finally, let’s get to sharing the insights and giving out access to your research through Condens.
You can share your findings in three main ways.
For one, you can download created charts as images or files, to then upload elsewhere or share over Slack, Teams, and other platforms.
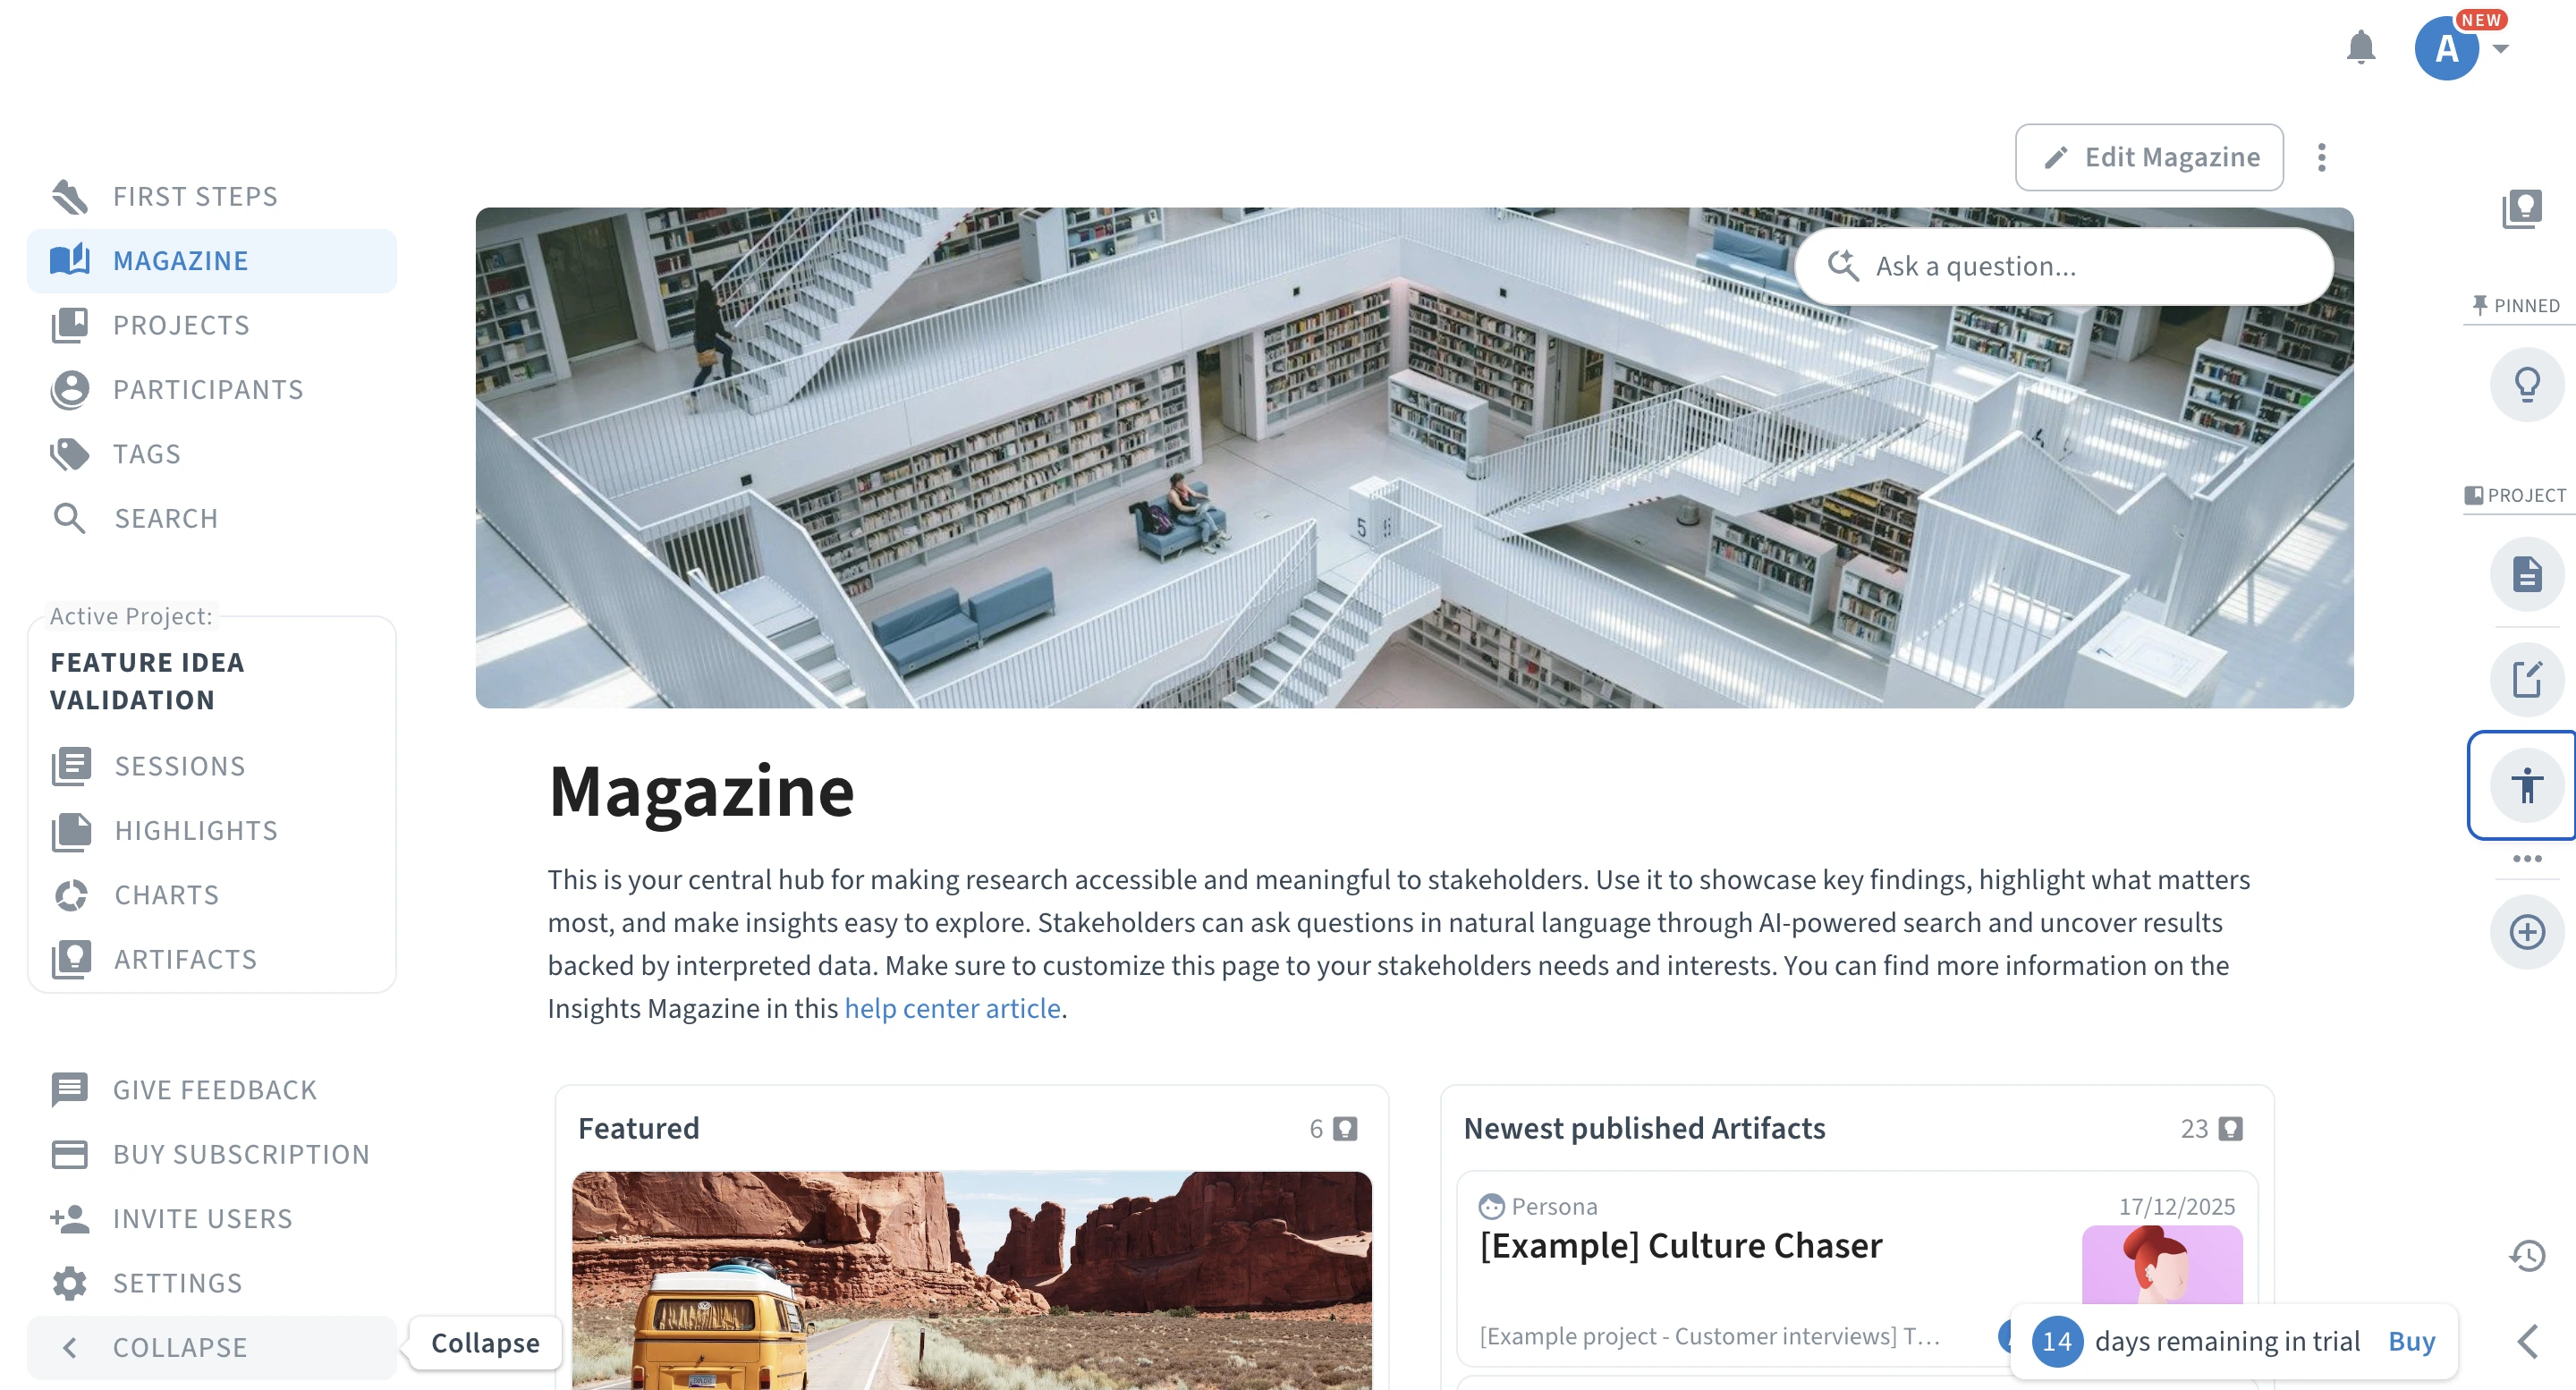
For two (a more practical option, given your team validates research and wants to actually be involved in the process), you can give your stakeholders direct access to the platform inviting them to Condens. From there, they get to access a dedicated page called the ‘Magazine’ where all research you decide to publish lives. From specific findings to full research reports.
For three, after giving access to Condens, you can also invite your stakeholders to view past projects or the ones you’re currently working on (if you decide to keep them public).
Ease of use
An excerpt from Condens website summarizes the platform pretty well in our opinion:
“Build an insights hub. Translate your analysis, themes, and findings into actionable, traceable insights. Develop a searchable insights library that empowers your organization to make impactful decisions.”
With Condens, you really have to put in the work to build your own, searchable repository.
Putting a lot of manual effort aside, we also run into many issues, confused moments, and wait, it’s supposed to be here pauses. Help center was extremely needed when trying out Condens’ possibilities given its outdated UI and somewhat clunky feeling with many clicks needed to get to core features or perform basic actions, as simple as uploading research data into the platform.
What Condens users themselves say about the platform’s ease of use varies. Some praise it saying: “What I love most is how user-friendly and intuitive it is—it truly makes the often messy work of research feel smooth and enjoyable.” G2 review.
Others, not so much. Saying things like:
- “I think the usability of the highlights feature can be a little smoother - for example creating folders or categorize highlights for each study / project. Not a fan of the home screen, can be more user friendly.” G2 review
- “Some clients tell us they're confused by the UI” G2 review
- “The Whiteboards (kinda like a miro board, but integrated with your tags and research directly) are a great concept, but the usability is kinda tough.” G2 review
“The learning curve can be a bit steep for newcomers.” G2 review
Customer support
Customer support is one of the areas where Condens seems to shine most at, offering a user centered approach.
Customers on G2 praise the platform’s Customer Support team a lot, describing it as simply ‘stellar’.
“Customer support have been helpful in identifying possible sessions with the company, to board in the new tool, but recent changes in the plans made things we needed more expensive.” G2 review
Pros and cons
Pros:
- Classic, structured repository that researchers who like control genuinely enjoy
- Strong, practical templates (personas, journey maps, affinity maps) and solid transcription
- Highly rated support (4.8/5 on G2 overall)
Cons:
- Heavy manual tagging to get highlights and charts
- Newer AI features are underwhelming and don't remove that manual work
- Limited, bulk-only integrations and a dated, click-heavy UI
My hot take: where Condens fits
Condens is for researchers who want control and structure and don't mind doing the analysis themselves. If manual tagging is a feature to you, not a chore, you'll like it, and the support is excellent.
The reason to look elsewhere is automation: if you want a repository that connects live sources and auto-surfaces themes with traceable quotes, Condens makes you do too much of that by hand, and its AI doesn't yet close the gap.
UserBit
UserBit is an all-in-one UX research platform and repository aimed at freelancers, small teams, startups, and agencies. It's built to organize, analyze, and share qualitative research in one place, with notes and tagging, transcripts for audio and video, survey analysis, and templates for personas, card sorts, site maps, user flows, and journey maps.
On G2 it holds a 4.7/5 across 18 reviews, and reviewers like the intuitive interface and the value for money. Think of it as a close cousin of Condens, except more manual, more dated, and cheaper. That last part is the appeal: it's one of the least expensive tools in this guide.
But you pay for it with effort.
Pricing
UserBit is the budget pick, and refreshingly, it's one of the few tools in this guide that publishes real numbers.
The whole range runs from $0 to $199 a month, with unlimited team members on every plan, which is rare. Most tools here charge per seat.
There are three tiers:
- Free ($0): your first project, free, with unlimited team members so you can evaluate it properly. You get the participant CRM, interview management, notes and media, survey data analysis, tagging, insights and reporting, and 5 AI automations. No client portal and no transcription.
- Usage based ($20/month): two active repository projects plus unlimited read-only projects, with additional active projects at $10/month each. This tier adds workspace participants, global tags, cross-project search and analytics, the client portal, 10 AI automations a month, and 5 transcription hours a month.
- Unlimited ($199/month, billed annually, or $249 month-to-month): unlimited projects and team members for one fixed price, plus custom branding, real-time comments, and 120 transcription hours a year.
For a solo researcher or a small agency, this is genuinely cheap, and the flat $199 for unlimited everything is easy to predict, which UserBit leans into (they describe themselves as a small business that values predictable costs).
The catch isn't the price, it's what you're working with once you're in: the manual effort, the dated interface, and the thin AI we'll get to next. The low cost is the whole pitch, and it's a fair trade only if simple, hands-on research is what you need.
Features overview
Connecting sources
Unfortunately, there's nothing to connect.
UserBit has no integrations, so every piece of data comes in by manual upload.
You bring your transcripts, your survey exports, and your documents to the platform yourself, one file at a time.
If you came from the Marvin or Survicate sections expecting to plug in Zendesk, Gong, or even Google Drive, there's none of that here.
You can add participants and stakeholders in a CRM-style view, which is a nice touch for keeping track of who said what and who needs the findings. It's the one organizational feature that feels useful.
Analysis
For UserBit, the analysis is manual, and that's the headline.
You tag and highlight your data by hand, then build charts and pull out patterns from what you've tagged. It's the Condens model without the polish. UserBit does market AI features, but they're thin, and in my testing they were the weakest part of the tool.
There's AI auto-tagging, which didn't work for me at all. I'll give it the benefit of the doubt, since the 4.7 rating suggests it works fine for plenty of users, so this may have been my session rather than the feature being broken.
The Free plan also includes five "AI automations," which is the beta insights generation.
I uploaded a good amount of dummy data and ran it twice, and both times it returned no insights at all.
Not thin insights, none.
For a feature meant to be the AI shortcut, that's a rough first impression.
So the realistic read: treat UserBit as a manual repository with AI bolted on the side, not an AI-native one. If the auto-tagging works for you, it'll save some time, but the analysis is fundamentally something you do yourself.
Reporting and charts
You can analyze highlights and charts together to spot patterns, and share findings through a client portal so stakeholders get access without learning the tool.
Now, the charts do the job, but they look dated, in keeping with the rest of the interface.
This isn't a tool you pick for polished, stakeholder-ready visuals.
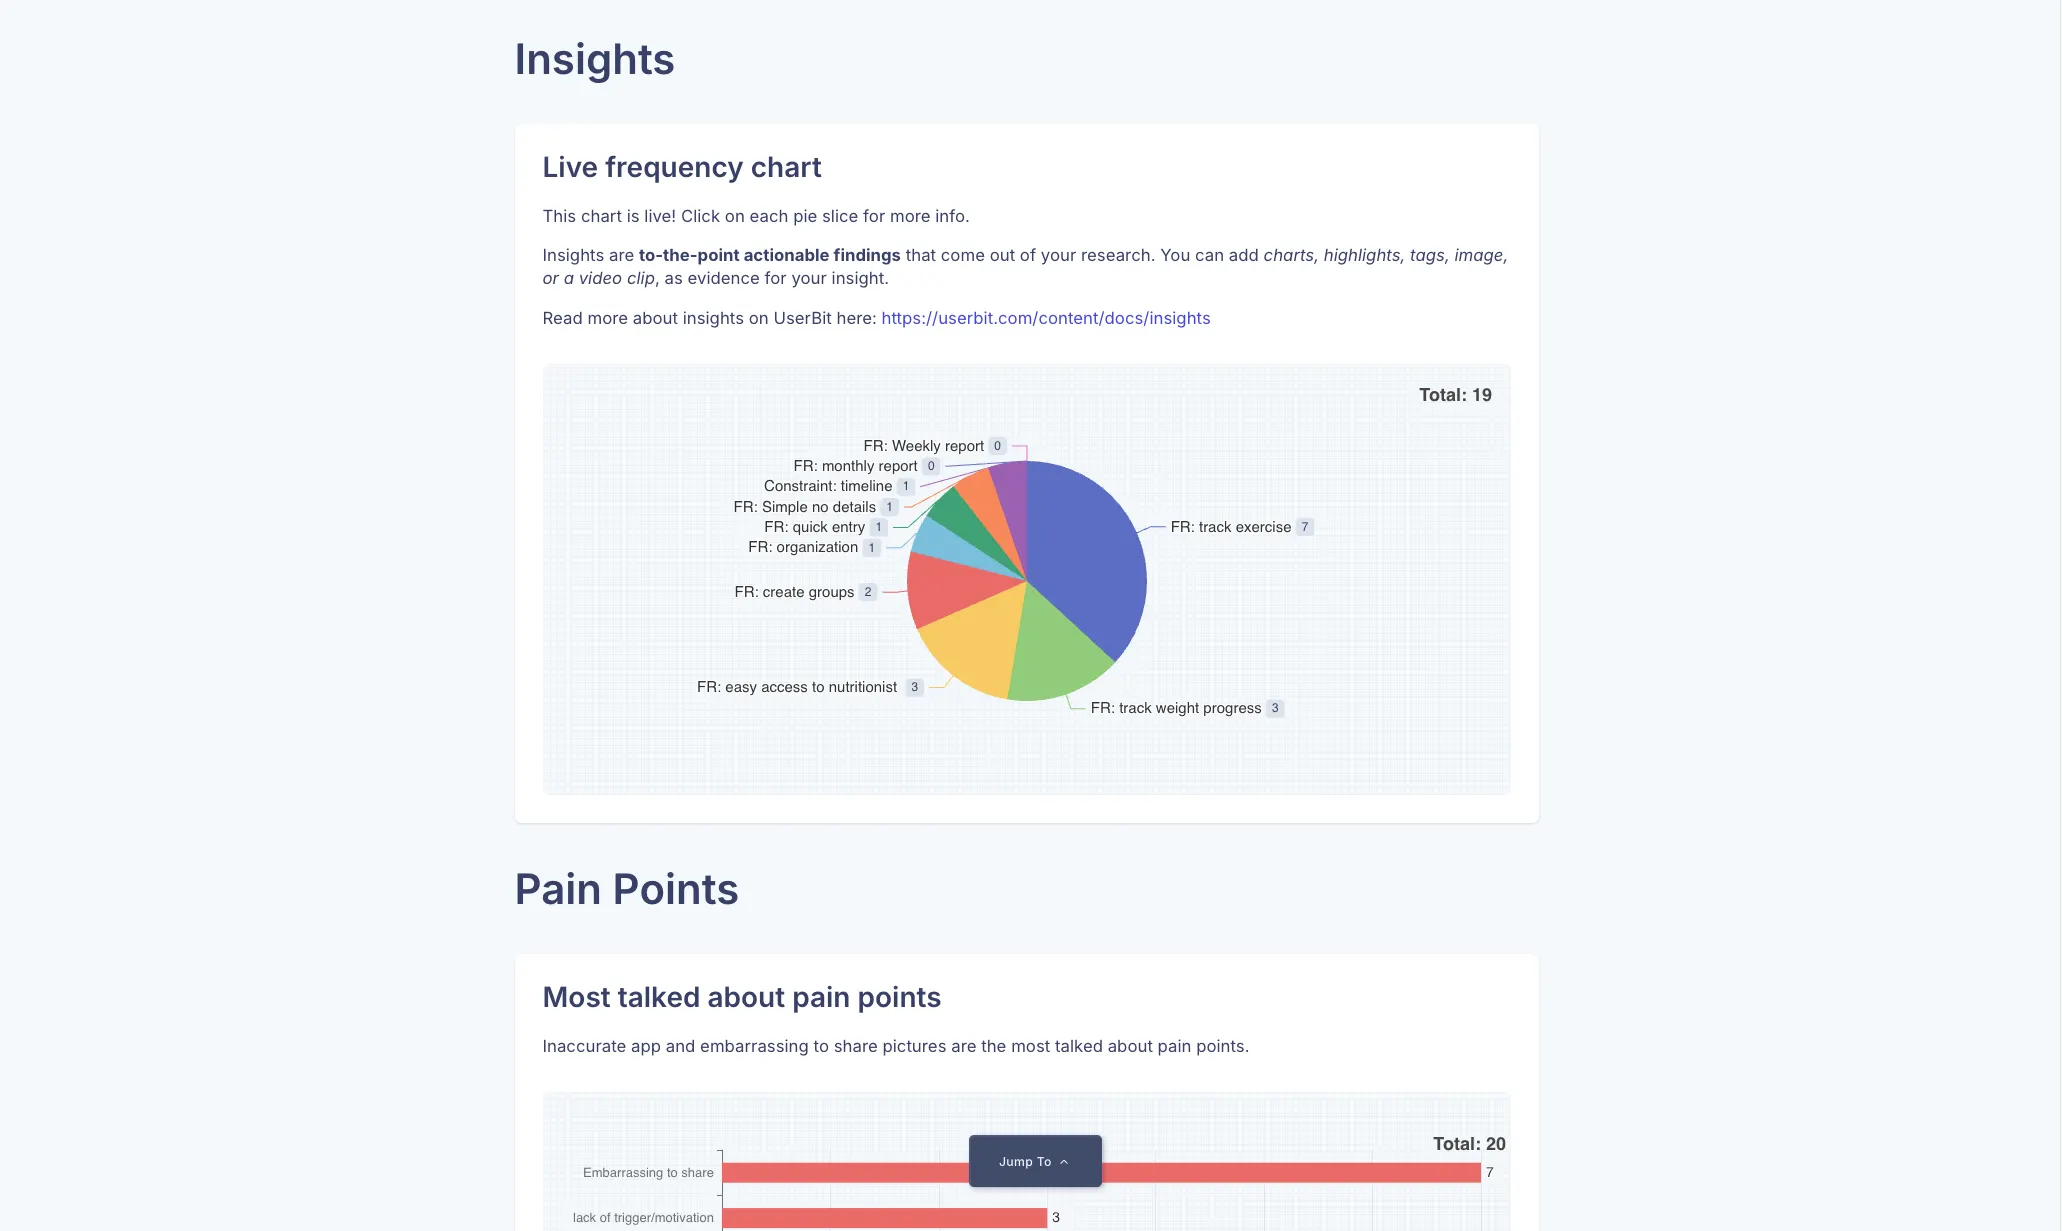
But, the reports themselves and how you can put them together may actually be the best part about UserBit.
A UserBit report is a structured, presentation-style document you build from blocks: a header, blank pages for your narrative, and Insight, Interview, and Research Note blocks you drop in.
So you're effectively assembling a deck, section by section, that walks a stakeholder through the story rather than handing them a raw export.
The reports are also built around evidence, which is the part that genuinely works.
Each insight is a to-the-point actionable finding, and you attach the proof to it directly: a chart, highlights, tags, an image, or a video clip.
A stakeholder doesn't just read your conclusion, they see what backs it.
And the charts, dated as they look, are live rather than static screenshots.
In a sample report by UserBit, a frequency chart broke down 19 feature requests, led by "track exercise" at 7, and you can click a slice to drill into what's behind it. A Pain Points section ranked the most-discussed issues on its own bar chart, with "embarrassing to share" topping the list at 7.
So the visuals aren't pretty, but they work and they're tied to real underlying data.
That's the honest takeaway on UserBit: the analysis is manual and the AI is thin, but the reporting holds up. If your job is to package qualitative findings into something stakeholders will actually engage with, this is the part of the tool that delivers, looks aside.
Ease of use
This is where I part ways with the G2 consensus.
Reviewers consistently call UserBit "easy to use," and on paper the features are simple, there isn't much to learn because there isn't much automation.
But simple features and an easy interface aren't the same thing.
The interface is dated enough that even basic tasks took me longer than they should have, not because the feature was complex, but because the UI gives you so little to go on
One reviewer hints at this too, noting that getting back to previous work, like interview notes from an earlier round, "is not always straightforward." So I'd reframe the usual praise: UserBit is simple, but it isn't smooth.
If you value a modern, guided experience, this will feel like a step back, and that dated feel is part of what you're trading away for the low price.
Customer support
G2 reviewers describe the team as responsive and helpful, which certainly matters for the small teams and freelancers UserBit targets.
One reviewer even said:
“Hmm.. I don't have anything I dislike. And frankly, if I really needed some sort of functionality, I think the team at Userbit would find a way to add it.”
Pros and cons
Pros:
- Cheapest dedicated repository here, with a free plan and transparent, predictable pricing ($0 to $199, unlimited team members on every tier)
- Reports are the standout: structured, presentation-style documents where every insight is backed by evidence (charts, highlights, tags, images, or video clips)
- Live, clickable charts tied to real underlying data, not static exports - Useful organizational extras: a participant and stakeholder CRM, plus templates for personas, journey maps, and card sorts
- Responsive, helpful support, which reviewers single out repeatedly
Cons:
- No integrations at all, so every source comes in by manual upload
- Analysis is manual, and the AI is thin (auto-tagging didn't work for me, and the beta insights generation returned nothing on two tries)
- Dated interface that makes even simple tasks slower than they should be - Individual charts look dated, even though they function
- Not built for large datasets
My hot take: where UserBit fits
UserBit is the cheapest real repository in this guide, and it's honest about being a small, no-frills tool, transparent pricing, unlimited seats, cancel anytime.
For a freelancer, a small agency, or a solo researcher who's happy to upload data and tag it by hand, it does the job for a fraction of what the other tools cost. Its genuine bright spot is reporting.
Where the analysis is manual and the AI fell flat in my testing, the reports hold up: structured, evidence-linked, and presentation-ready, which is exactly what you want when you're handing findings to a stakeholder.
If packaging qualitative research clearly is your main need, that alone might justify it. But by the working definition of a repository in this guide, a tool that connects feedback from many sources, UserBit barely qualifies, since everything arrives by manual upload and there's nothing to integrate.
The dated interface and unreliable AI are the rest of the trade.
So pick UserBit if budget is the deciding factor and your research is small and hands-on.
The moment you need live integrations, dependable AI, or room to scale, you'll outgrow it, and something like Survicate's Research Hub, which connects and analyzes across all your sources at once, is the better long-term home.
NotebookLM
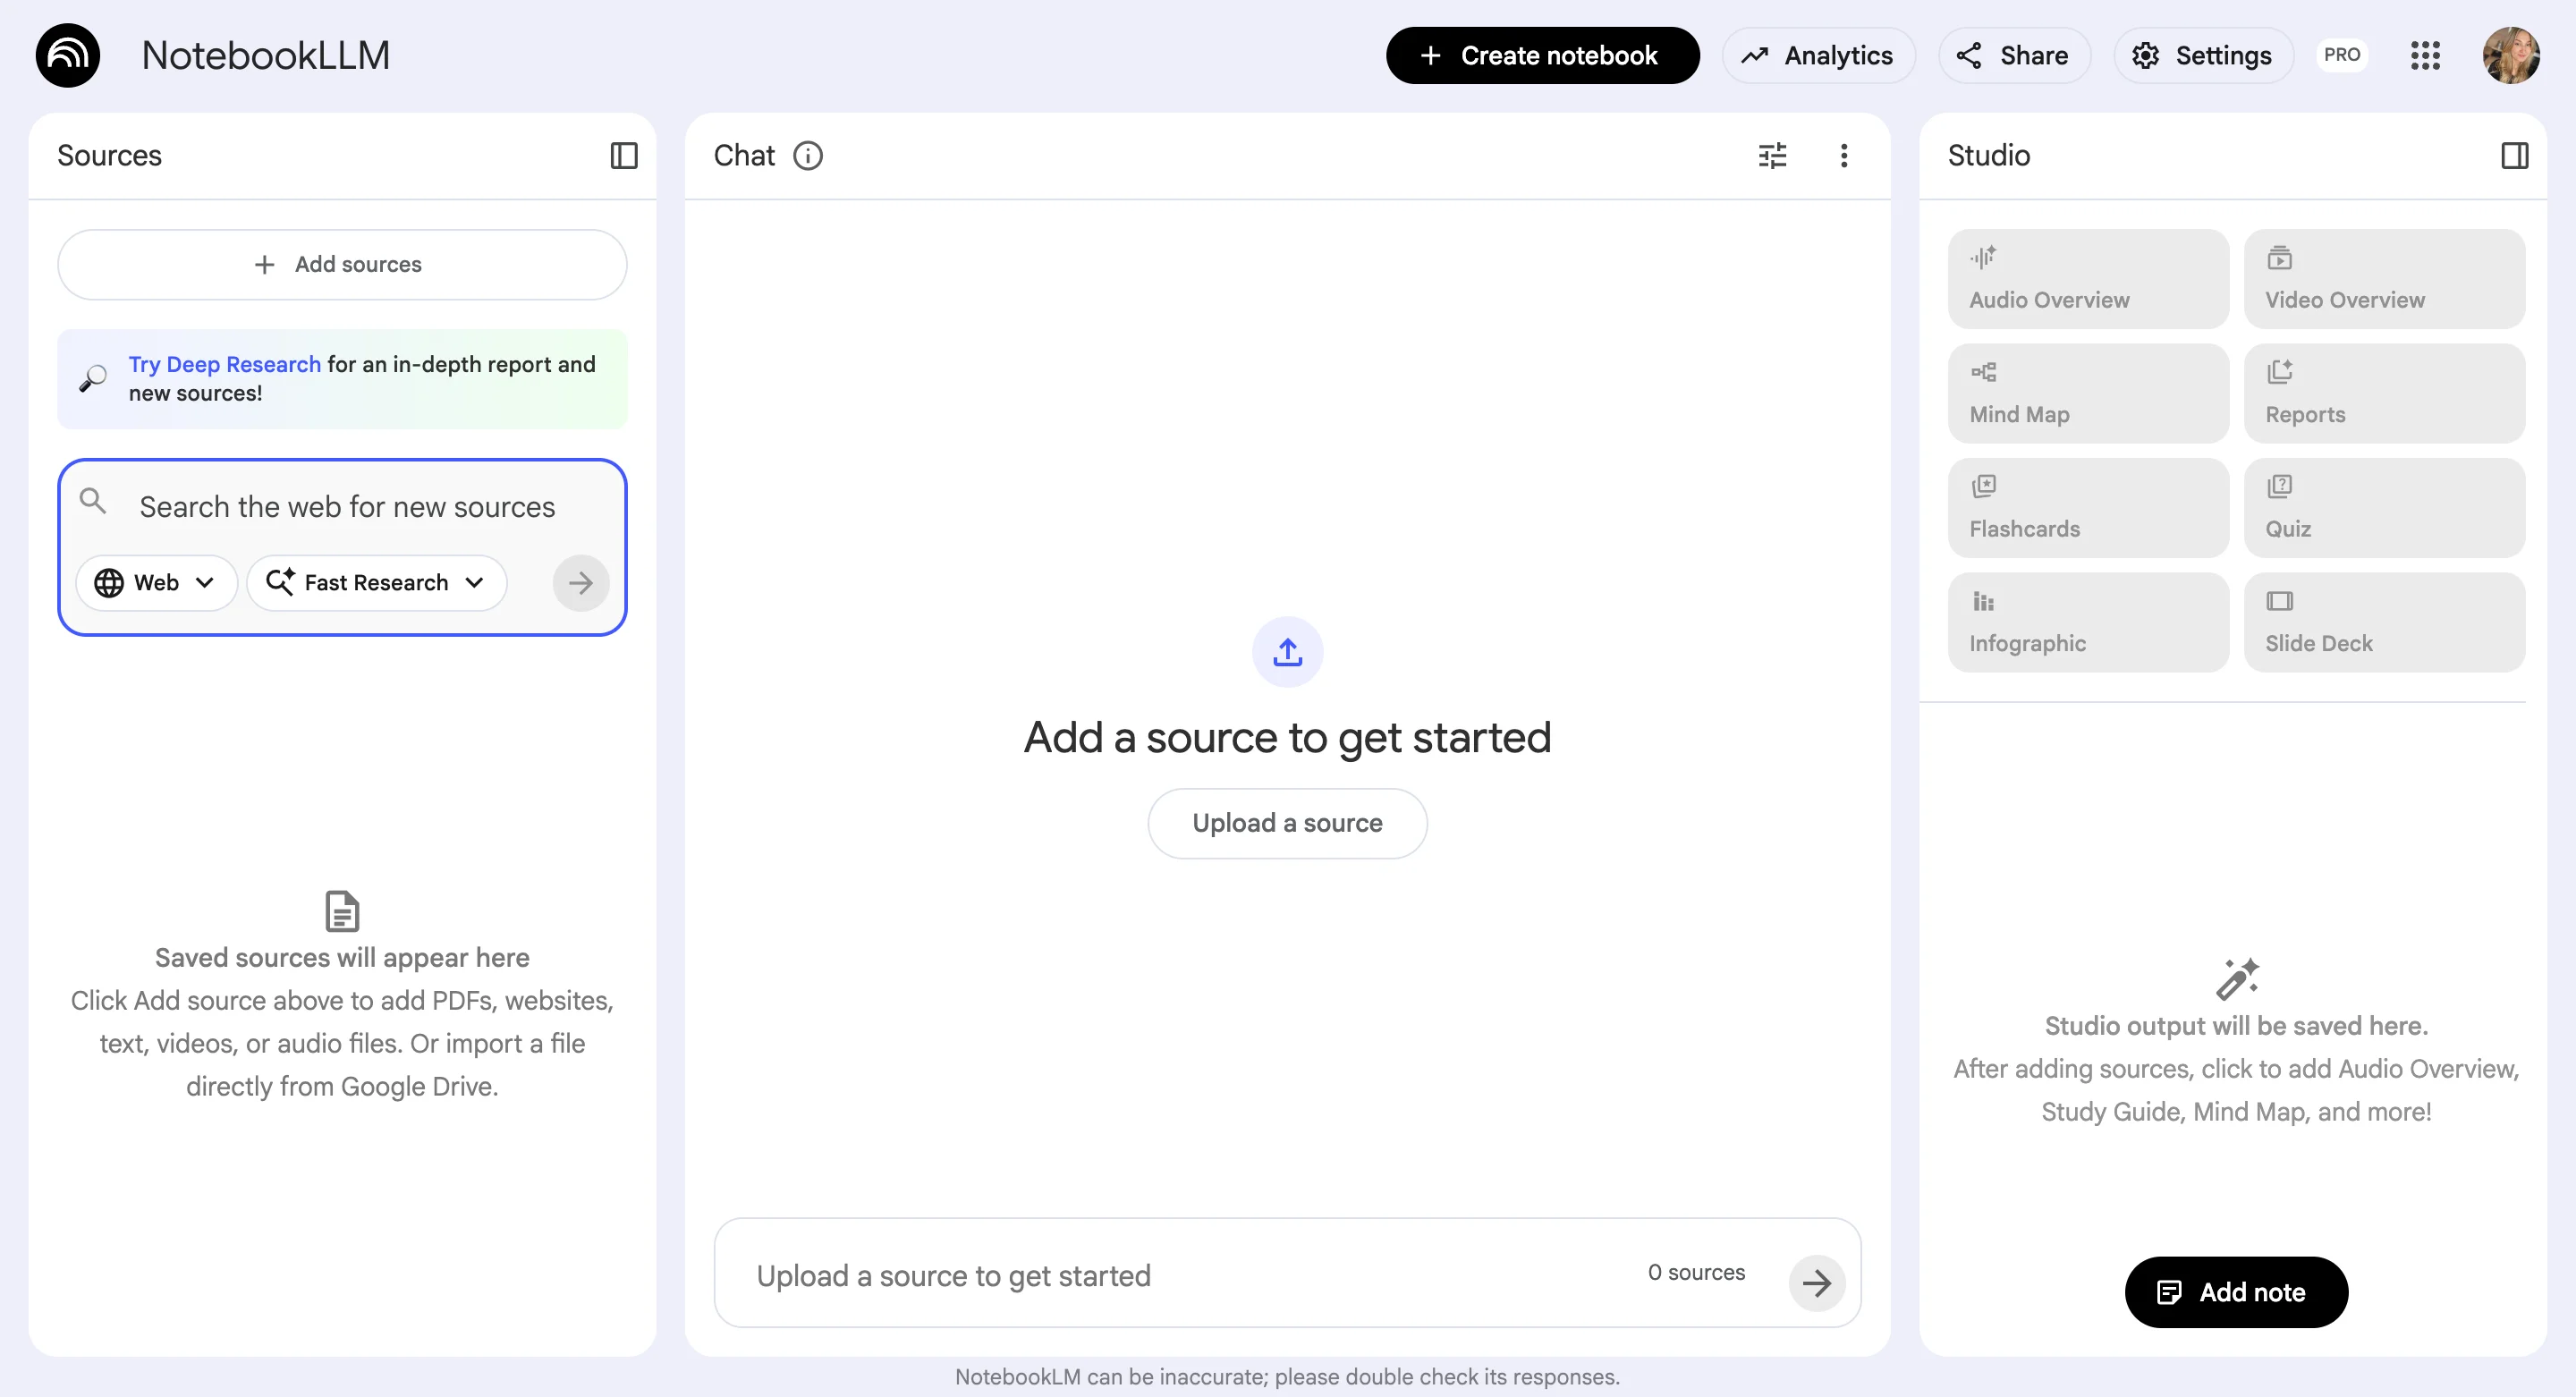
NotebookLM is not a research repository platform specifically, but it can serve as one.
This Google's AI-powered research dedicated tool helps you interact with your documents through conversation. Built on Google's Gemini language model, it transforms your uploaded research materials, whether research papers, reports, notes, or other documents, into an AI assistant that can answer questions, surface insights, and help you understand complex information.
It starts to collect reviews from users on G2, with the current rating being 4.9/5 stars, but only under 10 reviews submitted so far.
Pricing
Google’s NotebookLM originally launched as Project Tailwind in May 2023, but the tool shed its experimental status in October 2024 and now offers both a free version and NotebookLM Plus, a paid tier available to enterprise customers and Gemini Advanced subscribers through Google Workspace and Google Cloud.
NotebookLM (Free) is designed for individual users and includes core features like uploading PDFs, Google Docs, Google Slides, websites, YouTube URLs, and other sources. You can generate summaries, FAQs, timelines, and briefing documents with one click, create and listen to audio summaries from anywhere, and ask questions to get detailed insights with citations.
NotebookLM Plus (Paid) includes everything in the free version plus significantly expanded capacity with 5 times more audio summaries, notebooks, queries, and other features. Here, you get to create shared notebooks for team collaboration with usage analytics, enhanced privacy and security controls, and additional enterprise-focused capabilities.
To use NotebookLM on the upgraded version, a Google AI Pro or Google Pro Ultra subscription is required, which cost around $30 and $350 monthly, respectively. So either $360/year or $4200/year, making it the cheapest research-repository-like tool on this list.
Features overview
But with the lower costs come limited capabilities, so let’s get into the exact features overview.
Notebooks and supported sources
NotebookLM is the easiest tool to test out. After all, everyone should be able to access it from within their Google workspaces.
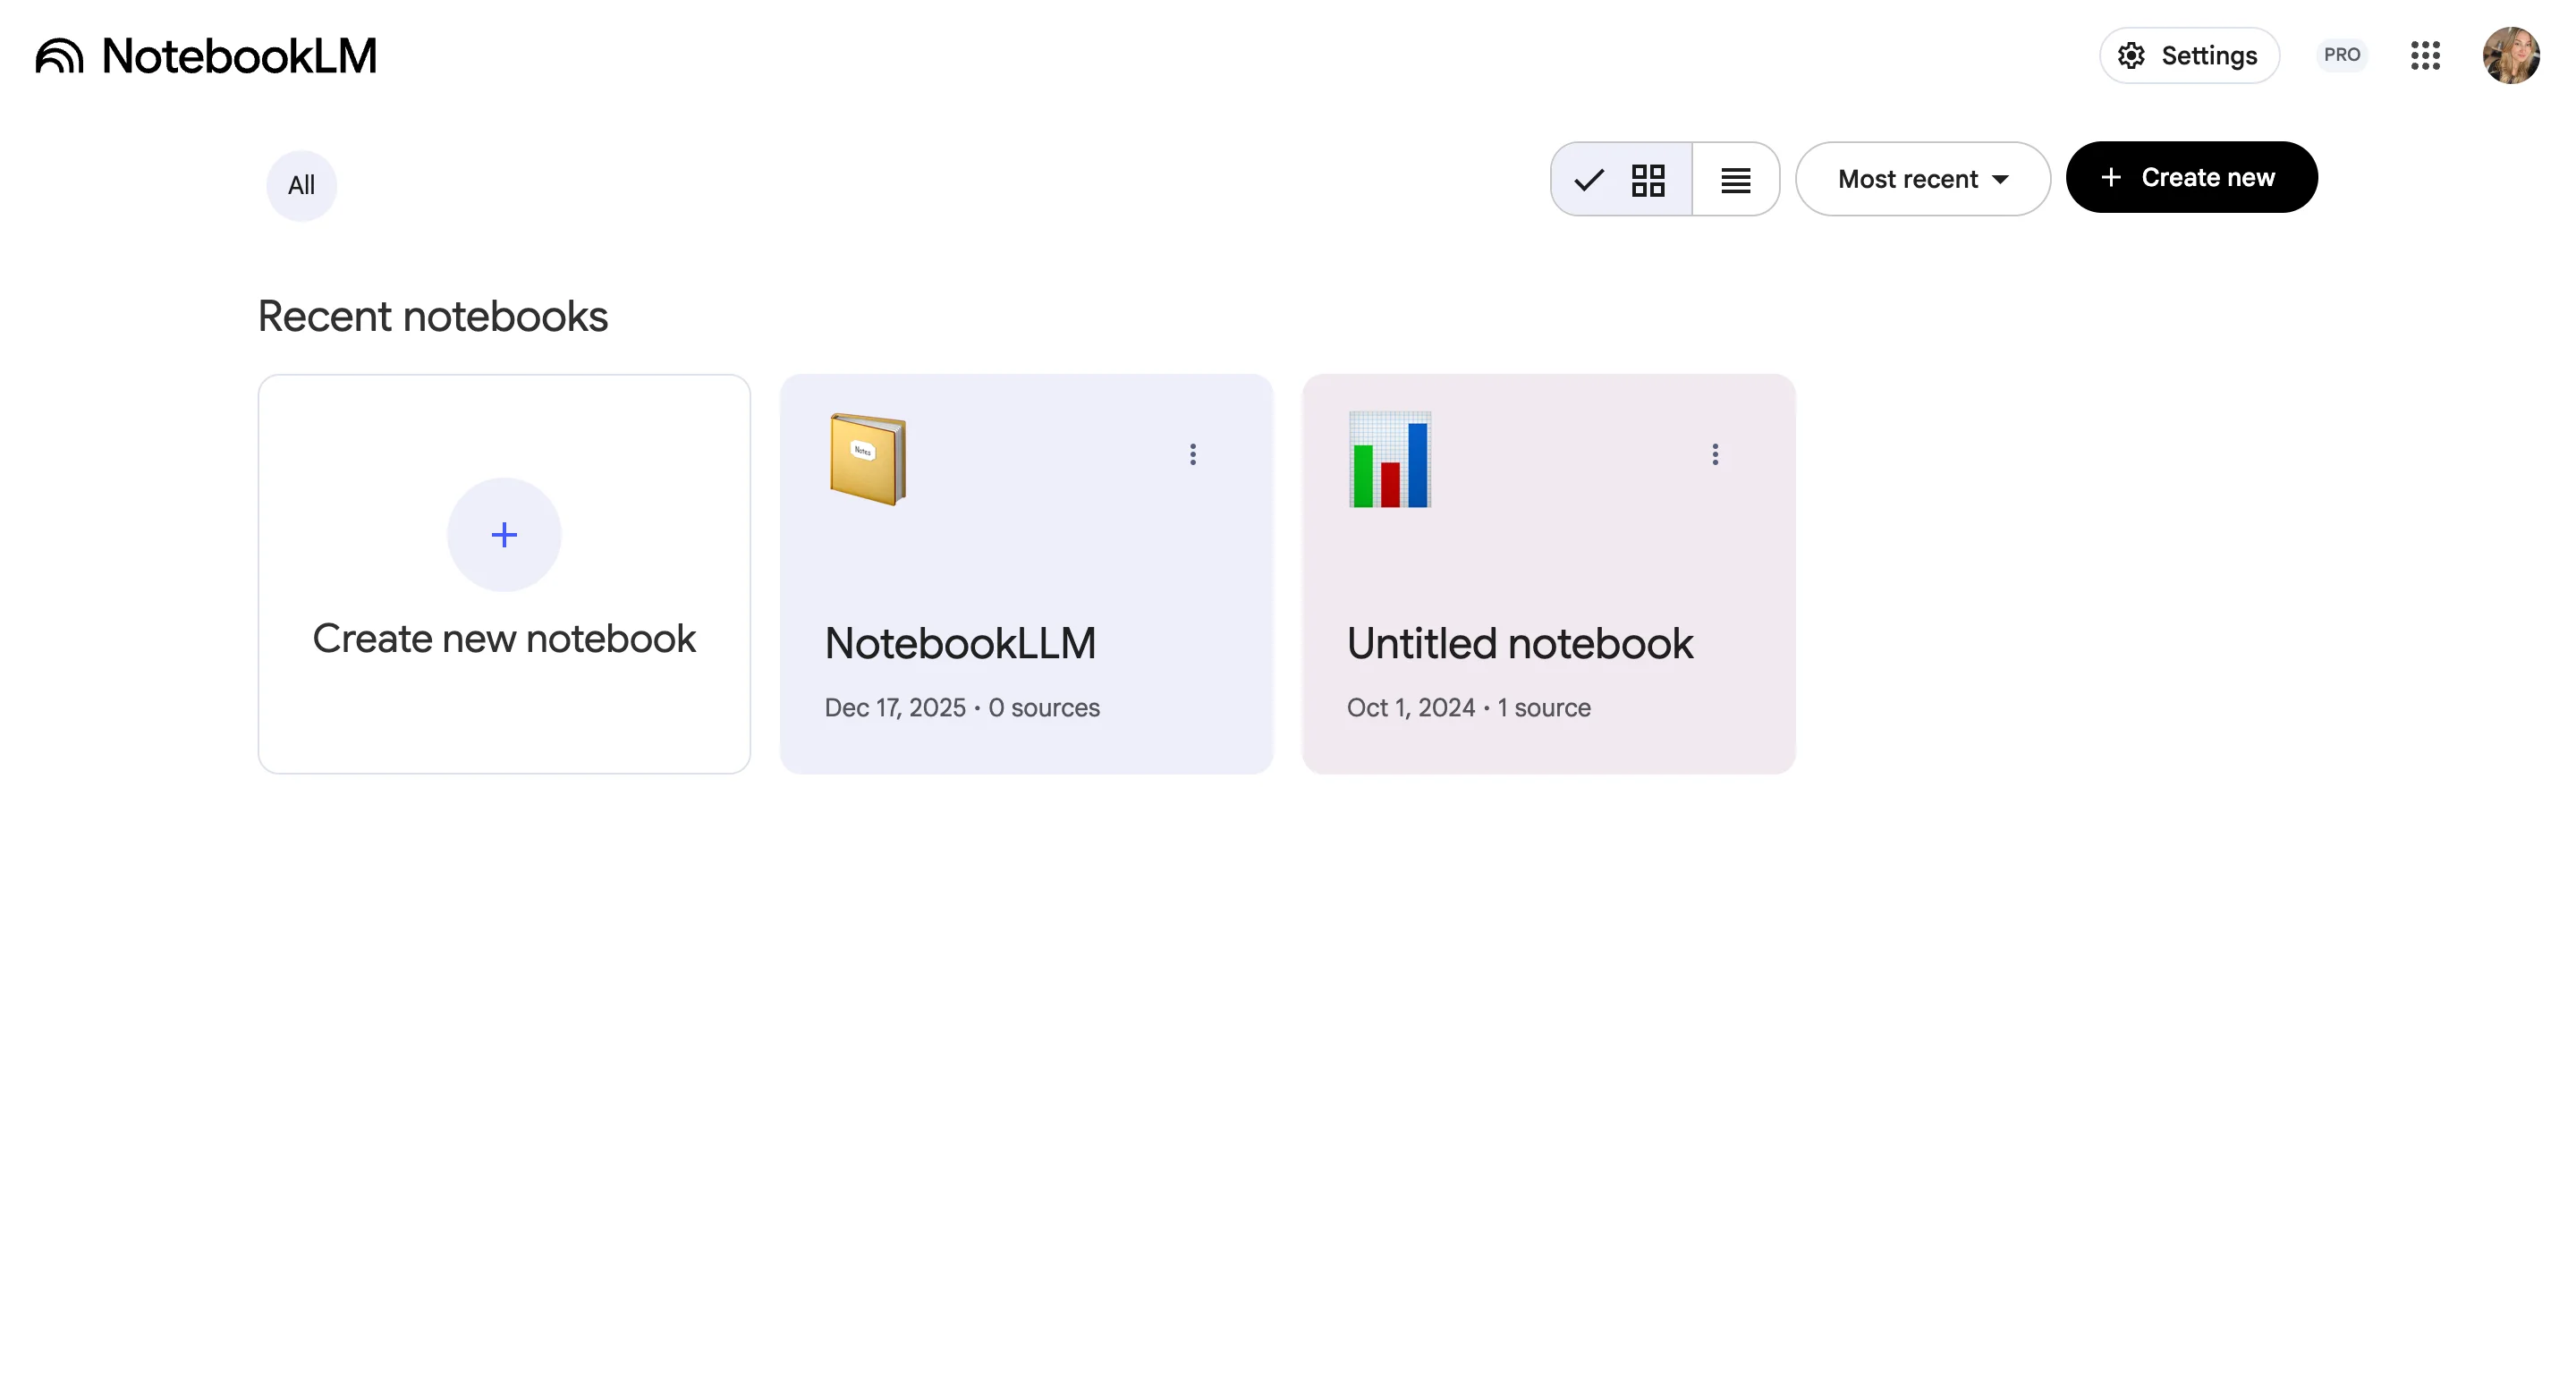
Once you get in, you’ll be met with the overview of all the “notebooks” you’ve created, which may translate to specific studies or research projects you’re running.
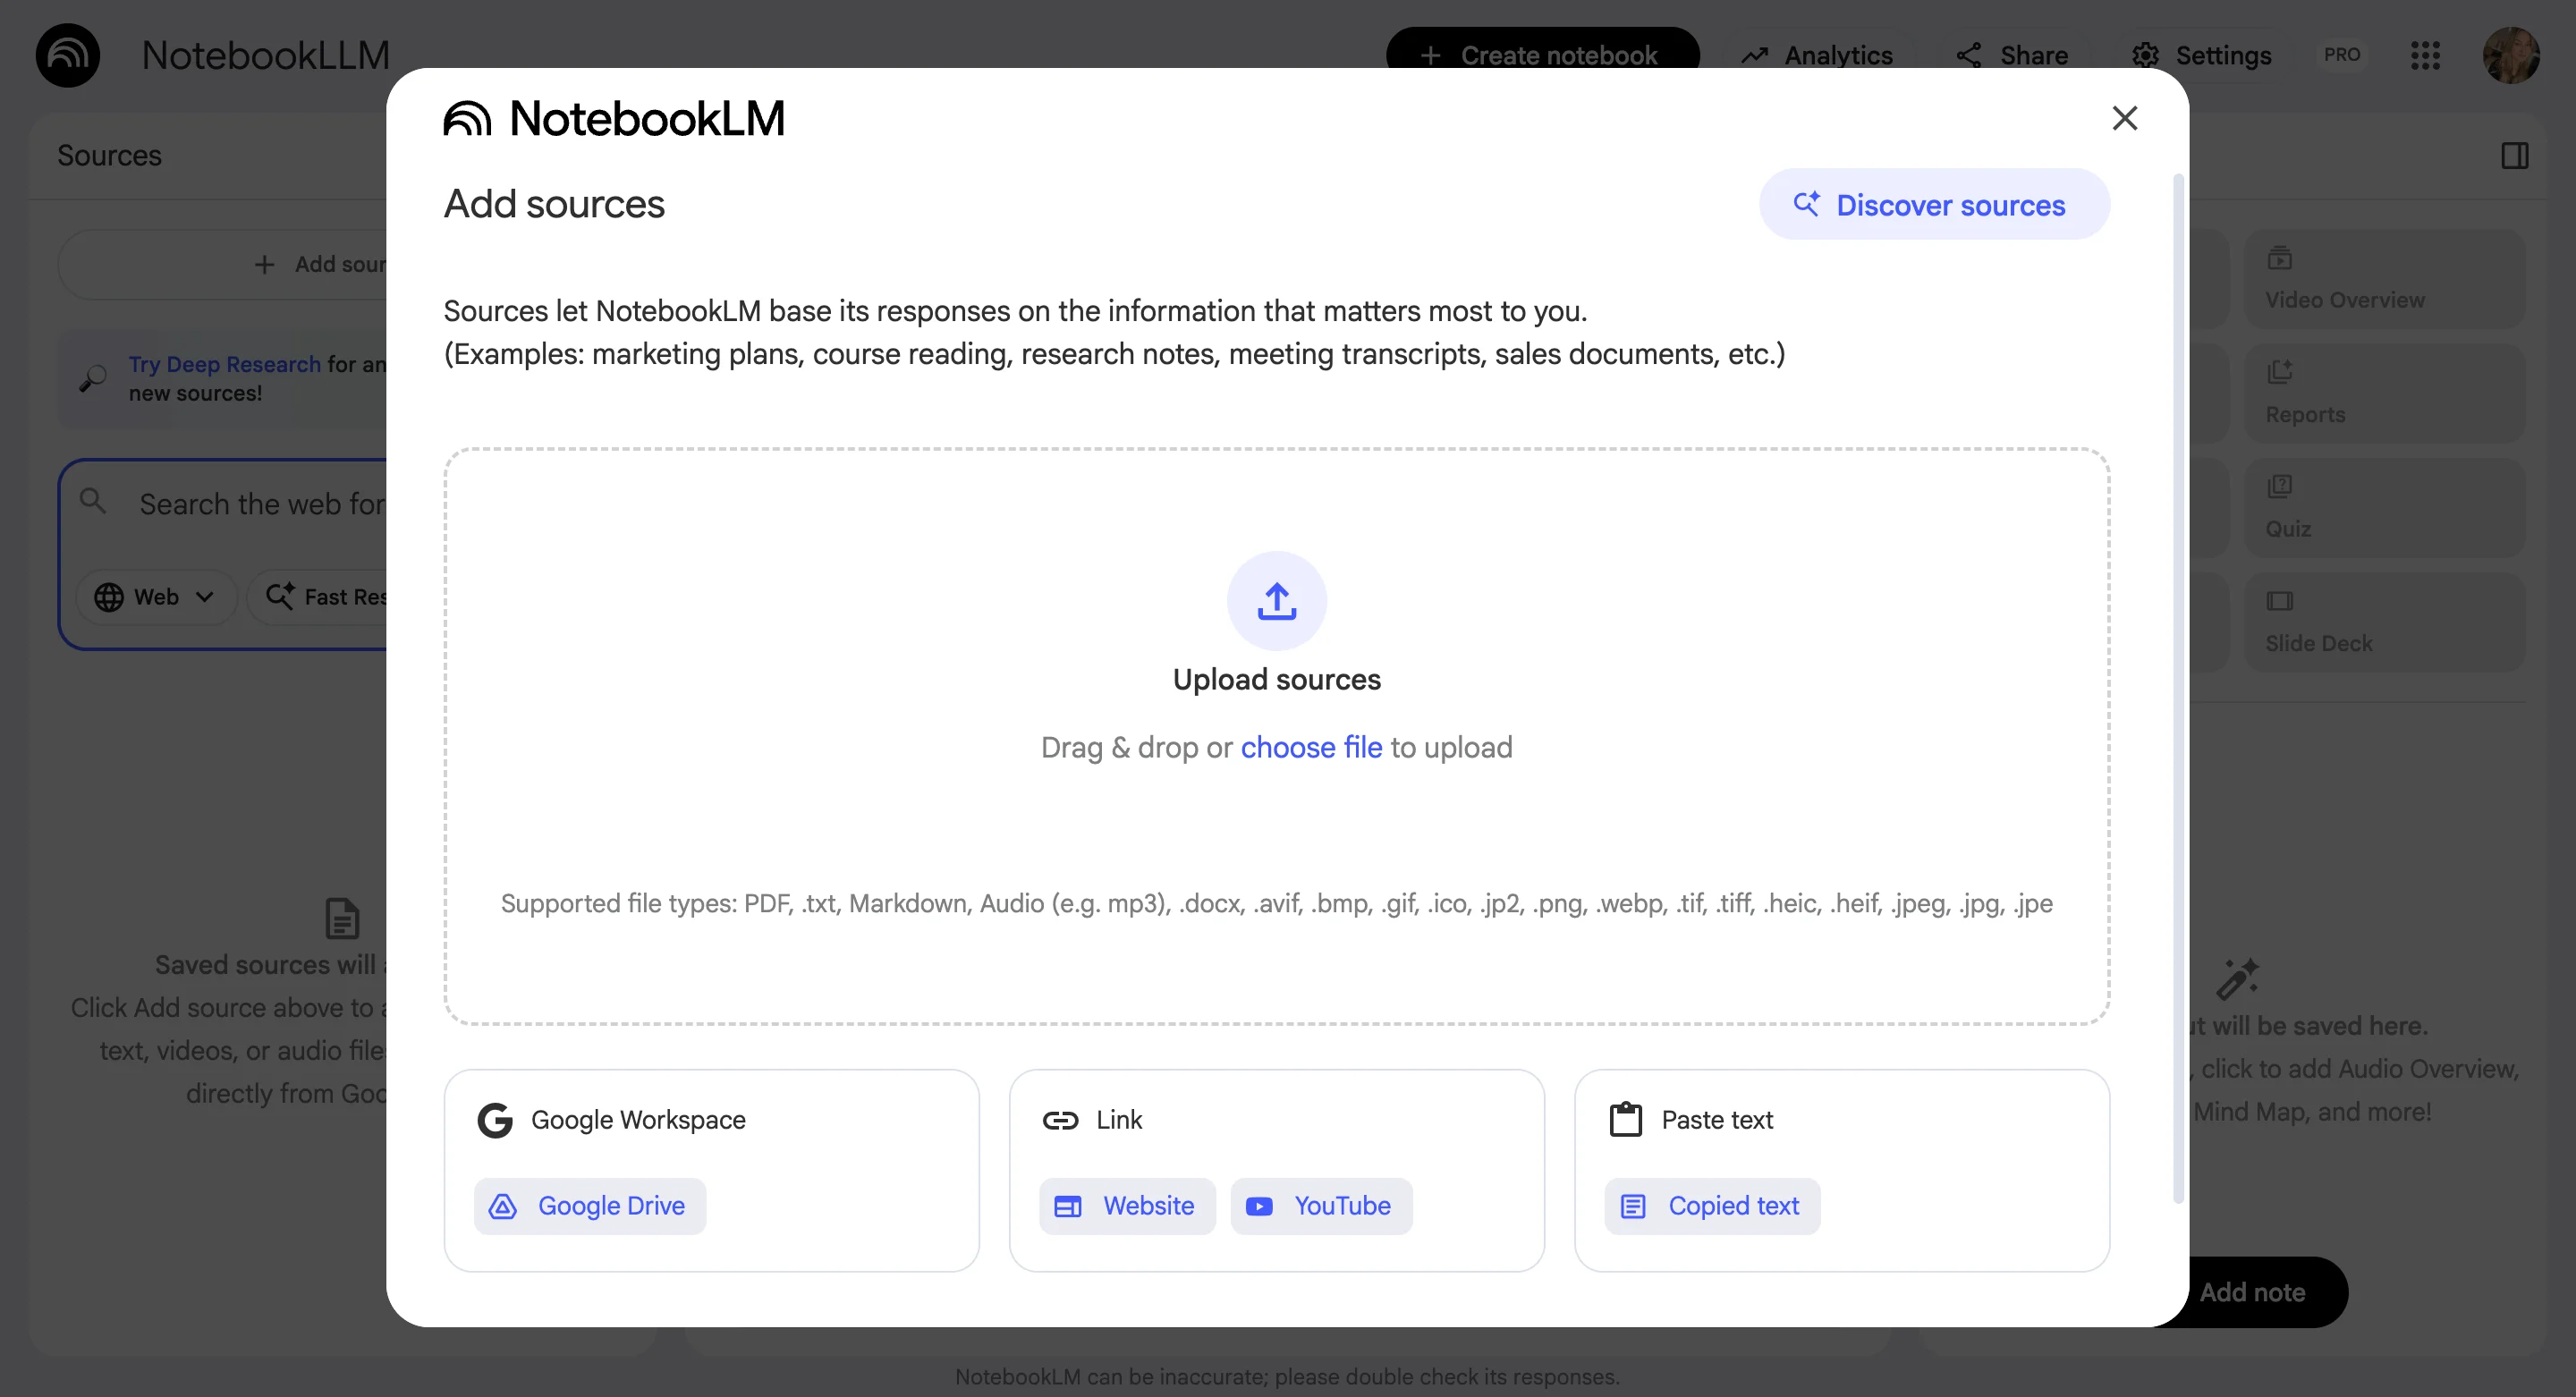
When creating a new Notebook, you can add in your sources, which are limited to all sorts of files basically. We’re talking PDF, .txt, Markdown, Audio (e.g. mp3), .docx, .avif, .bmp, .gif, .ico, .jp2, .png, .webp, .tif, .tiff, .heic, .heif, .jpeg, .jpg, .jpe, as well as files from within your Google Workspace, direct URLs to websites or YouTube videos, and pasted text.
There’s no possibility to connect NotebookLM with an external user research platform to connect your data with, as of now.
Data analysis
Not judging the book by the type of files you can upload into it, let’s take a closer look at the data analysis possibilities of NotebookLM to see how it really compares with professional research repositories.
And unfortunately it’s not as comprehensive.
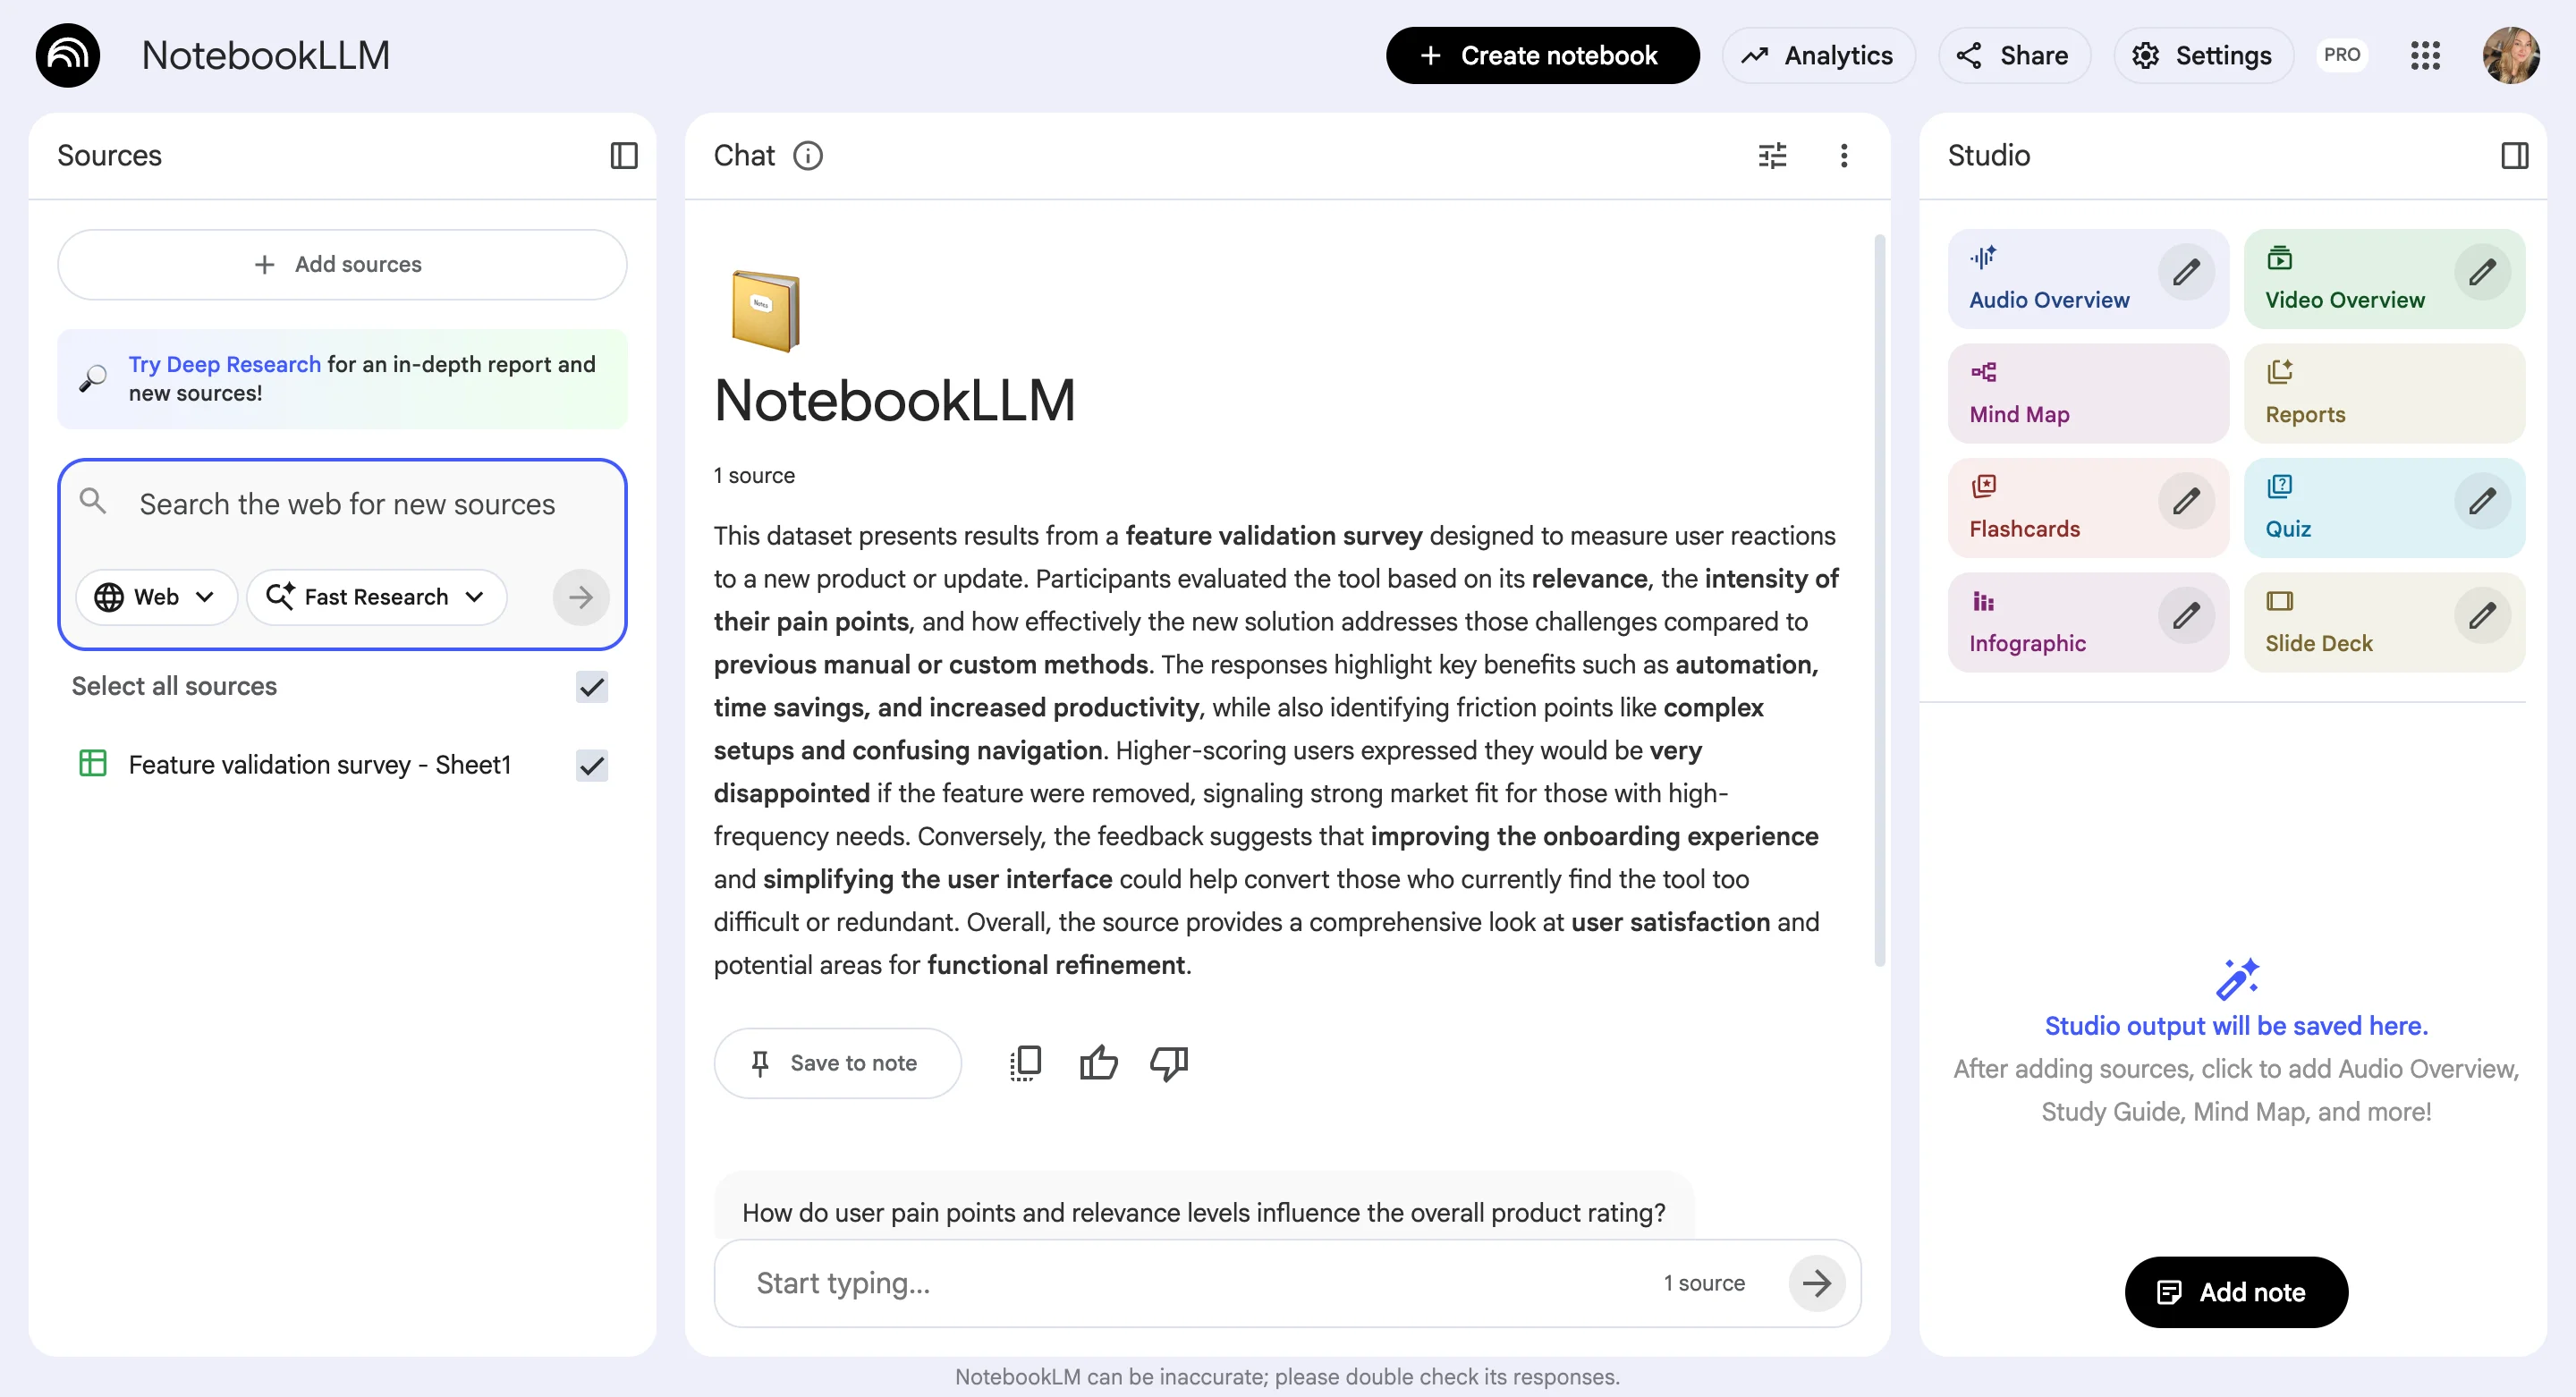
For example, after adding in a csv file with around 30 responses to a feature validation survey, NotebookLM gave us a very short summary, explaining the goal of the survey and a rundown of the responses, but not linking back to exact quotes or the number of supporting insights for a given finding.
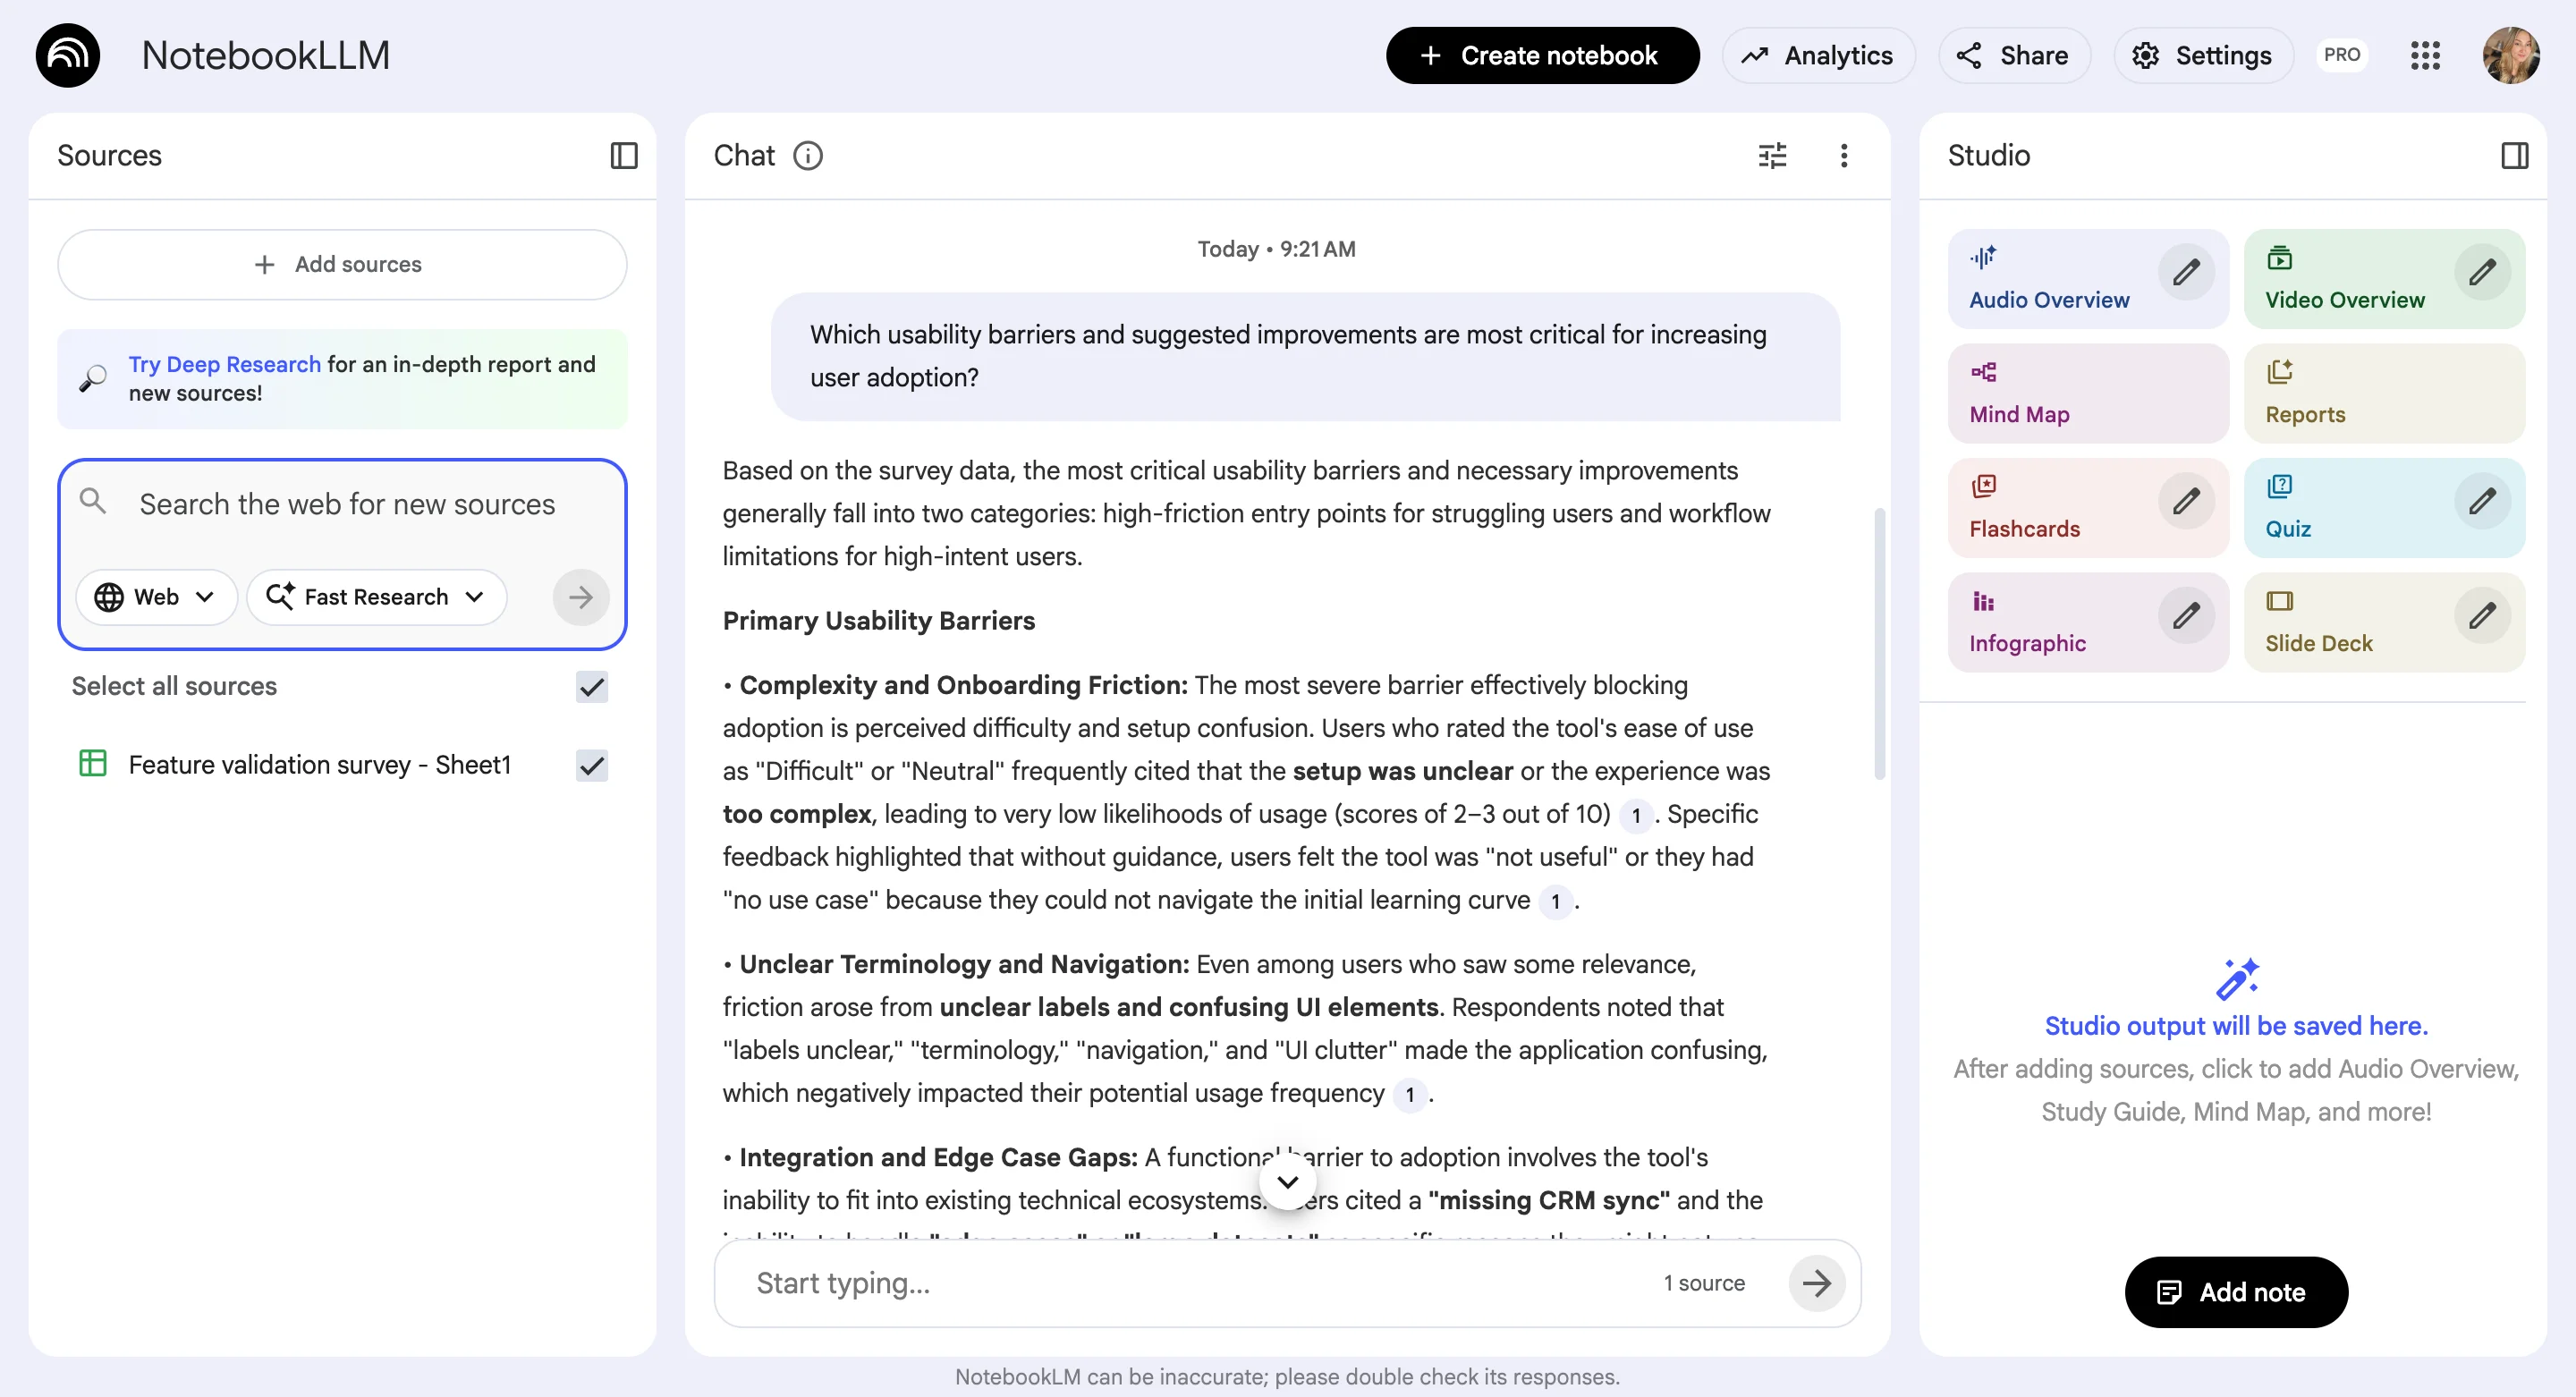
Only after you ask more detailed questions, does NotebookLM dig into the data deeper, providing sources (but linking back to the whole file (?), still not being too transparent about the way it makes sense of uploaded data.
Sharing the insights
From the additional options, besides just chatting with all the data, you also get to create insights, reports, overviews, blog posts, quizzes and mindmaps based on the information you’ve uploaded.
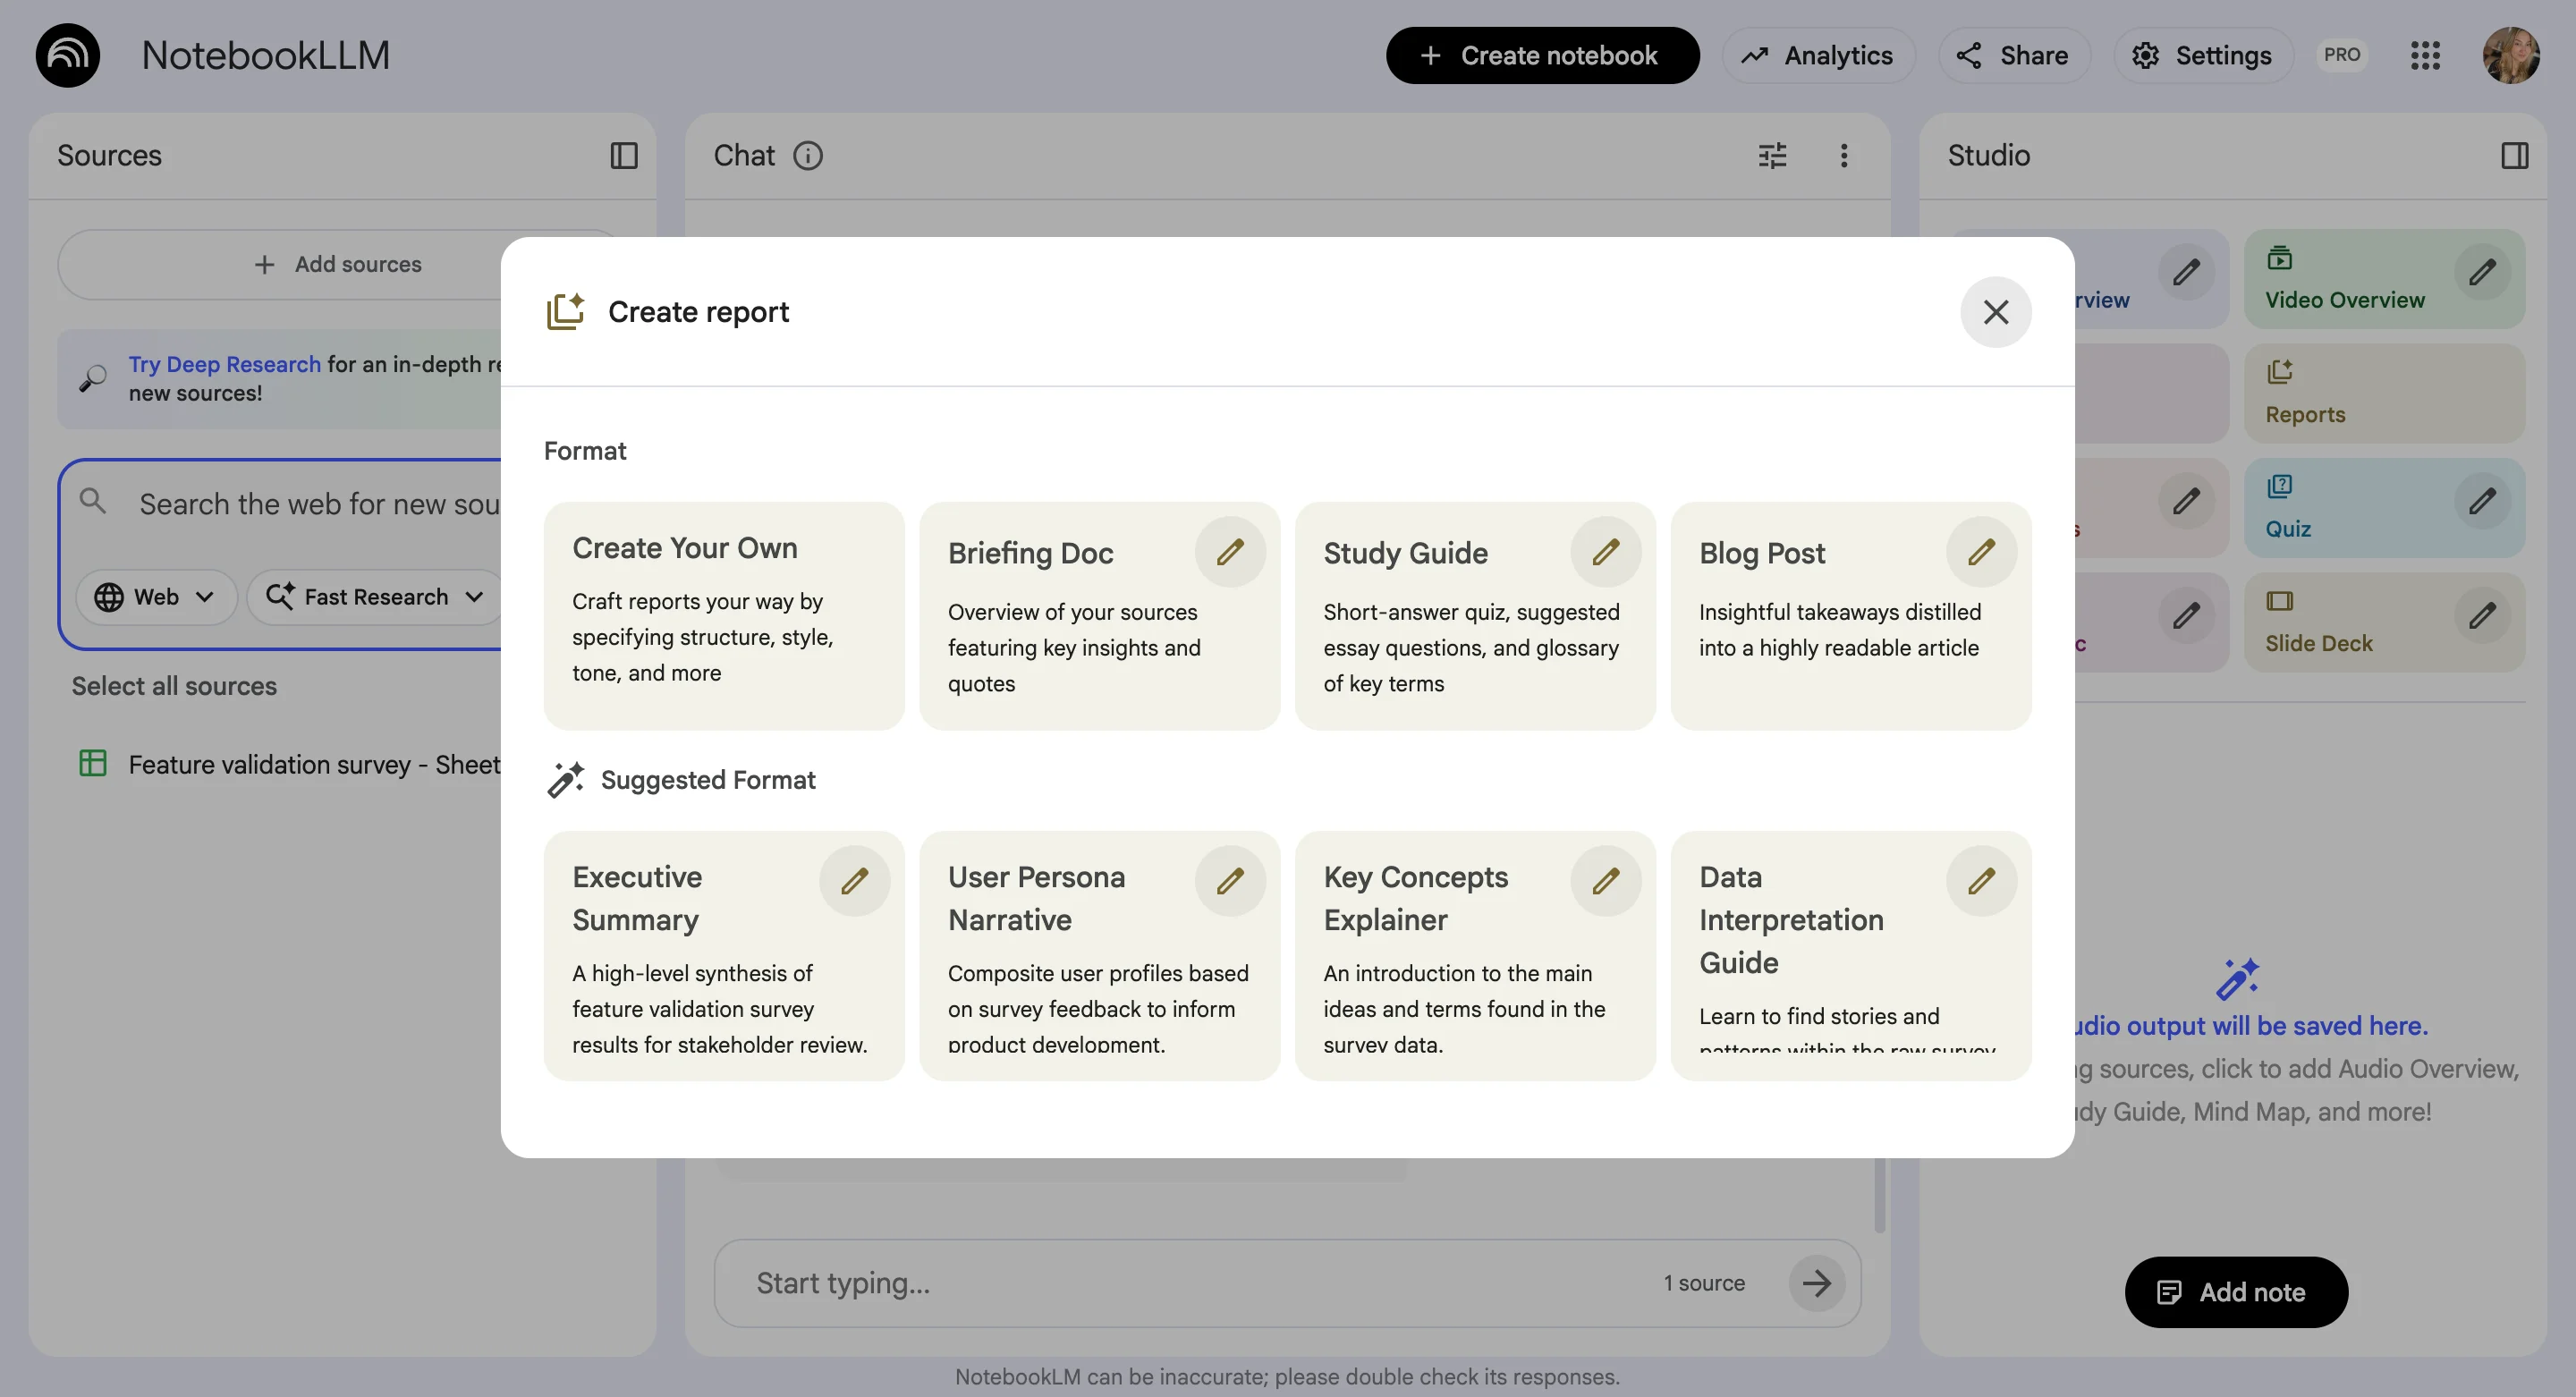
The reports, the summaries, and answers take quite a bit of loading time, unfortunately.
Now, putting the loading time aside, all the generated assets, as well as full notebooks (or just the chat) can be shared with your stakeholders.
If you share research insights from NotebookLM with at least four team members, you can then check the Analytics tab for more information on how the Notebook is actually used by your teammates.
Ease of use
NotebookLM is a pretty straightforward tool with a modern user interface, making it easy to get around and use.
This is also supported by the G2 reviews, with users saying things like:
- “The UI is super easy to use.” G2 review
- “As it provides summaries and insights, you can check details of the specific source it was extracted from very intuitively.” G2 review
Customer support
Based on Google product reviews (since NotebookLM-specific support reviews aren't available on G2), NotebookLM's customer support can vary.
Support quality appears to vary significantly depending on your licensing level, with enterprise customers potentially receiving better service, especially if they work through reseller channels that can provide additional management support.
“Customer support can vary depending on the level of licensing, although there are various reseller channels that can provide support in management if you choose to contract the service in that way.” G2 review
Response times are a common pain point, while some users praise 24/7 availability and helpful support teams.
“It takes only a short time to implement, and customer support is available 24x7 to address our requirements. 100% recommend to every small, medium or large enterprise too” G2 review
Others report slower-than-expected responses, particularly for non-urgent issues, with one user specifically noting they expected faster replies from Google's support team.
- “Cusomer support is okay, but i expected faster response from the google support team.” G2 review
- “Also customer support on non-urgent issues can be slower than expected.” G2 review
Pros and cons
Pros:
- Cheapest option, with a genuinely useful free tier
- Easy to access and use, with strict source-grounding
- Good for fast, lightweight synthesis of curated documents
Cons:
- No live integrations (upload-only), so not a true multi-source repository
- Weaker traceability (often cites the whole file, not the exact quote)
- Generation can be slow, and analysis depth is limited
My hot take: where NotebookLM fits
NotebookLM is great for quick, source-grounded synthesis when you have a set of documents and a question, and the price is hard to beat.
The reason it isn't a repository replacement is exactly that: it can't connect your live feedback sources, its traceability is looser, and it doesn't hold a consistent, growing knowledge base across studies the way a dedicated tool does.
Use it for fast, lightweight work, not as the system of record for a research team.
Do other tools make good research repositories?
Many tools can be used as research repositories, but most of them fall short once research scales.
General-purpose tools like Notion, Miro, Confluence, Airtable, or Trello rely heavily on manual structure, tagging, and upkeep, which often turns “organized” spaces into static archives no one searches or trusts.
Research execution platforms (Maze, UserTesting, Dscout, Optimal Workshop, Userlytics) are excellent at generating insights, but rarely at preserving and connecting them across studies and time. Call tools (tl;dv, Grain) capture valuable conversations but lack synthesis and cross-source analysis.
Analytics and behavior tools (Mixpanel, Hotjar, Crazy Egg) explain what users do, not why, and weren’t built for qualitative insight management. Even feedback and roadmapping tools (Productboard, Cycle, Chisel) focus on prioritization and delivery rather than rigorous research synthesis.
In most cases, these tools either require heavy manual work, silo insights by study or team, or lack traceability back to raw data—which is exactly why many “repositories” end up looking tidy but rarely get used.
Summary
User research might feel shaky right now, but the way researchers work is changing fast. As AI adoption climbs, the real opportunity isn't using AI to "do the research for you." It's using it to make research usable: less manual tagging, less fragmented data, and far less time spent digging through old notes to prove a point.
That's where modern research repositories come in. The best ones don't just store transcripts, survey exports, and stray spreadsheets. They connect data across sources, auto-surface themes with traceable quotes, organize insights into clear research projects, and make findings easy for stakeholders to engage with.
In this guide I tested and compared seven tools with a specific lens on AI features that support researchers, not replace them.
- Survicate stands out for end-to-end workflows and a researcher-friendly UI that makes analysis and sharing fast, with surveys built in.
- Dovetail is strong for qualitative depth, but it's pricey and several AI features are still beta.
- Marvin is a well-rated, researcher-first repository with the strongest sharing here, though analysis runs file by file and reports are built by hand.
- Condens offers classic repository structure, but it leans hard on manual work and its AI is underwhelming.
- UserBit is affordable for small teams and freelancers, with surprisingly strong reports, but upload-only and not built to scale.
- Enterpret is powerful for large orgs with many sources, though complex and the most expensive here.
- NotebookLM is cheap and easy for lightweight synthesis, but lacks the integrations and traceability of a true repository.
If you're choosing a specialized tool to make research smoother, optimize for one thing: getting to credible, source-backed insights faster, and making those insights easy for the rest of the org to find, trust, and act on.
FAQ
What is a research repository, and how is it different from a folder in Notion or Drive?
A research repository is a centralized system built for research knowledge, not just storage. Beyond housing files, it connects insights across studies, lets you search by theme or question, and traces insights back to raw sources (quotes, recordings, surveys). Notion or Drive can store data, but without structured organization and synthesis, they become static archives teams stop using.
What are the must-have features in a research repository tool?
The strongest repositories do four things well: aggregate data from across sources (surveys, interviews, recordings, tickets, reviews), analyze and synthesize with traceability (AI or automated themes that link back to exact quotes), organize work into projects so insights don't get lost, and share insights easily (dashboards, exports, Slack and Teams, stakeholder access). Survicate checks all four with traceable AI themes, research projects, dashboards, and flexible sharing. Dovetail, Marvin, and Enterpret handle deep qualitative analysis but can be more complex or costly. Condens and UserBit lean on manual tagging. NotebookLM helps with lighter synthesis but isn't a full repository.
Is AI in a research repository actually safe, or does it hallucinate?
AI can be both helpful and risky. The tools that handle it best ground every conclusion in your data and link it to source content, rather than producing generative summaries that feel right but invent context. Survicate, Dovetail, and Enterpret tie AI outputs back to source. Tools where reviewers flag thin-data accuracy issues, like Marvin, are worth extra scrutiny if findings drive decisions. The safe pattern is simple: if a claim can't be traced to a real quote, don't trust it.
Why not just use ChatGPT or Claude as a research repository?
Generic LLMs are powerful, but they aren't repositories. They don't hold your data across sessions, they don't reliably trace findings back to exact quotes, they have no project structure, and they make you re-import context every time. Past a certain volume they also under-attend to data in the middle of a long context, so they can miss or misrepresent a chunk of your feedback. They're fine for one-off questions. For research that has to hold up months later, a tool built for the synthesis workflow wins.
Which tools integrate with Figma or Jira?
Several do, though not the same ones. For Jira, Dovetail, Survicate, and Enterpret all connect: Survicate can auto-create Jira tickets from feedback patterns, and Enterpret lets you assign work from its dashboards. Marvin also turns findings into Jira and Asana tasks. For Figma, Dovetail and Marvin have the stronger story, letting design teams pull research context into design work. If Jira is the priority, Survicate or Dovetail balance functionality and cost well.
Which tools are best for storing and analyzing interview recordings?
Dovetail and Marvin are the strongest for recording-heavy work. Dovetail builds projects around interviews and runs AI Chat on Claude; Marvin goes deep on qualitative interview analysis, including AI-moderated interviews and shareable video clips. Survicate supports call and video transcription and connects tools like tl;dv and Gong, but if video is your single primary input, the interview-first tools have an edge. If video is one source among many, Survicate handles the full mix better.
What's the best research repository for a small UX team or freelancer?
For small teams and freelancers, the priority is value without heavy setup. Survicate is the strongest all-rounder, intuitive and affordable (Vendr median under $8k/year) and covering the full workflow. UserBit is the cheapest dedicated repository if you're happy uploading your own data, and NotebookLM is nearly free for lightweight synthesis. Condens fits small teams that like manual control, while Dovetail's costs and Enterpret's enterprise pricing make them a stretch at this size.
Which research repository platforms are built for large teams and high feedback volume?
For large orgs, Enterpret and Survicate are the main options, with a big cost spread. Enterpret is built for scale, handling high volume across 50+ sources with deep taxonomy (Vendr median ~$40k/year). Survicate scales with multi-seat plans, granular permissions, custom dashboards, and stakeholder access, plus Slack sharing for people who never log in, at a fraction of the cost. The right pick depends on whether you need enterprise depth or want most of that capability without the price.
Author's note
Author's note (last verified: 11 June 2026): Statements such as "best" reflect our opinion and typical use cases, not a universal guarantee. This comparison is based on publicly available information and our best understanding at the time of writing. Vendors may change features, pricing, and packaging without notice. For the latest details, please check the official sources or reach out to the vendor directly.


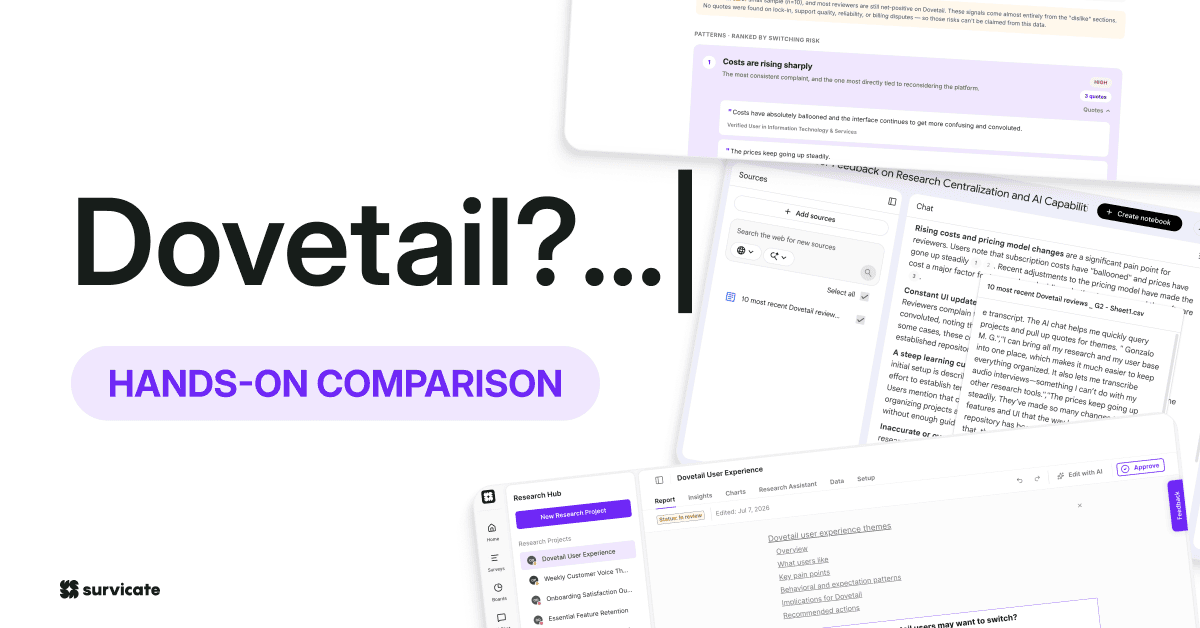
.webp)

.svg)

.svg)