


Most resources online bundle all mobile feedback together, from web forms to email links. This report focuses strictly on mobile app surveys, based on data from over 1,700 surveys.
Product managers often find it hard to tell if a low response rate stems from a mobile survey design issue or just normal user habits. Without clear benchmarks, teams risk making big roadmap decisions and feature updates using tiny or shaky feedback samples.
The data below gives clear baselines to what constitutes a mobile-friendly survey design for apps. The findings will help you build product roadmaps with confidence.
Methodology
This report includes data from 1,776 mobile app surveys, collected throughout 2024 and 2025 from 175 companies using Survicate's paid plans. Here's how we built the dataset and calculated the benchmarks:
- We included mobile app surveys only. Surveys opened on a smartphone through email or a browser are classified as page/link surveys and excluded, regardless of the device used to complete them.
- Each survey needed at least 50 responses to qualify for the dataset. We report category-level results only when a category contains at least 25 unique surveys. Meanwhile, industry comparisons include only industries represented by at least 8 unique companies.
Notice that the medians move by less than one percentage point across thresholds, so the 50-response bar doesn't drive the result.
- We calculated response rate by dividing the total number of responses by the total number of survey views.
- Completion rate represents the average percentage of survey questions answered across all respondents. For example, if a survey contains 10 questions and respondents answer an average of 7, its completion rate is 70%.
- Our findings identify patterns and differences across survey groups but do not establish that a particular survey design choice or customer characteristic caused a higher or lower response or completion rate.
- We report medians and the 25th and 75th percentiles rather than averages. The median represents the typical result, while the 25th and 75th percentiles show the range containing the middle 50% of observations.
- Industry, company size, and B2B/B2C classification come from external data enrichment. Employee counts were sourced from LinkedIn, while industry and business model classifications were based on analyses of company websites. Because some companies target both business and consumer markets, we assigned the business model that best represented their primary target market.
- We could not confirm company size for 15 companies, representing 107 surveys. These surveys are excluded from company-size comparisons but may remain in other analyses where they meet the relevant inclusion criteria.
- B2C companies account for 72.8% of all surveys but only 56.6% of the companies in the dataset. B2C companies contributed an average of 13 surveys each, compared with 6 per B2B company. This difference reflects, in part, the larger customer bases typical of consumer-facing apps. As a result, the overall benchmarks lean towards B2C survey activity and may not reflect typical B2B performance.
- Some breakdowns are disproportionately influenced by a small number of companies. We examined the share of surveys contributed by the four largest companies in each breakdown and found that, in 10 categories, these companies accounted for 30-70% of the surveys. The most affected categories were e-learning, surveys containing 11-20 questions, full-screen surveys, and companies with 201-500 or 501-1,000 employees. This concentration partly reflects the nature of mobile app surveys at high-volume B2C companies. Even if the four largest contributors were excluded, other large companies could account for a substantial share of the remaining data. For this reason, results for these categories should be interpreted with caution.
- Differences between question types may be confounded by survey length, since surveys that contain different question types may also differ in the number of questions. The observed differences cannot be attributed to question type alone.
Key findings
- Mobile app surveys have a median response rate of 19.2% and a completion rate of 74.5%. The middle 50% of surveys record response rates between 11.3% and 35.4% and completion rates between 65.2% and 85.0%.
- B2C mobile app surveys outperform B2B surveys on response and completion rates. Median response rates are 20.9% for B2C and 14.2% for B2B, while median completion rates are 75.3% and 71.0%, respectively.
- Full-screen surveys have over twice the median response rate of dialogues. Their median response rates are 38.9% and 18.1%, respectively, while completion rates are more similar at 77.6% and 74.4%. That said, full-screen results should be interpreted cautiously because they cover only 21 companies.
- Event-triggered surveys have the highest median response and completion rates. They record a median response rate of 24.1% and a completion rate of 77.4%, compared with 14.9%-16.6% and 71.9%-72.5%, respectively, for instant and delayed triggers.
- Median completion rates generally decline as survey length increases. The median is 80.8% for surveys with 1-3 questions, 70.9% for those with 4-10 questions and 59.6% for those with 11-20 questions. Results for surveys with 21 or more questions are excluded from this summary because that group contains only 35 surveys from 11 companies.
Mobile app surveys average a 19.2% response rate and 74.5% completion rate
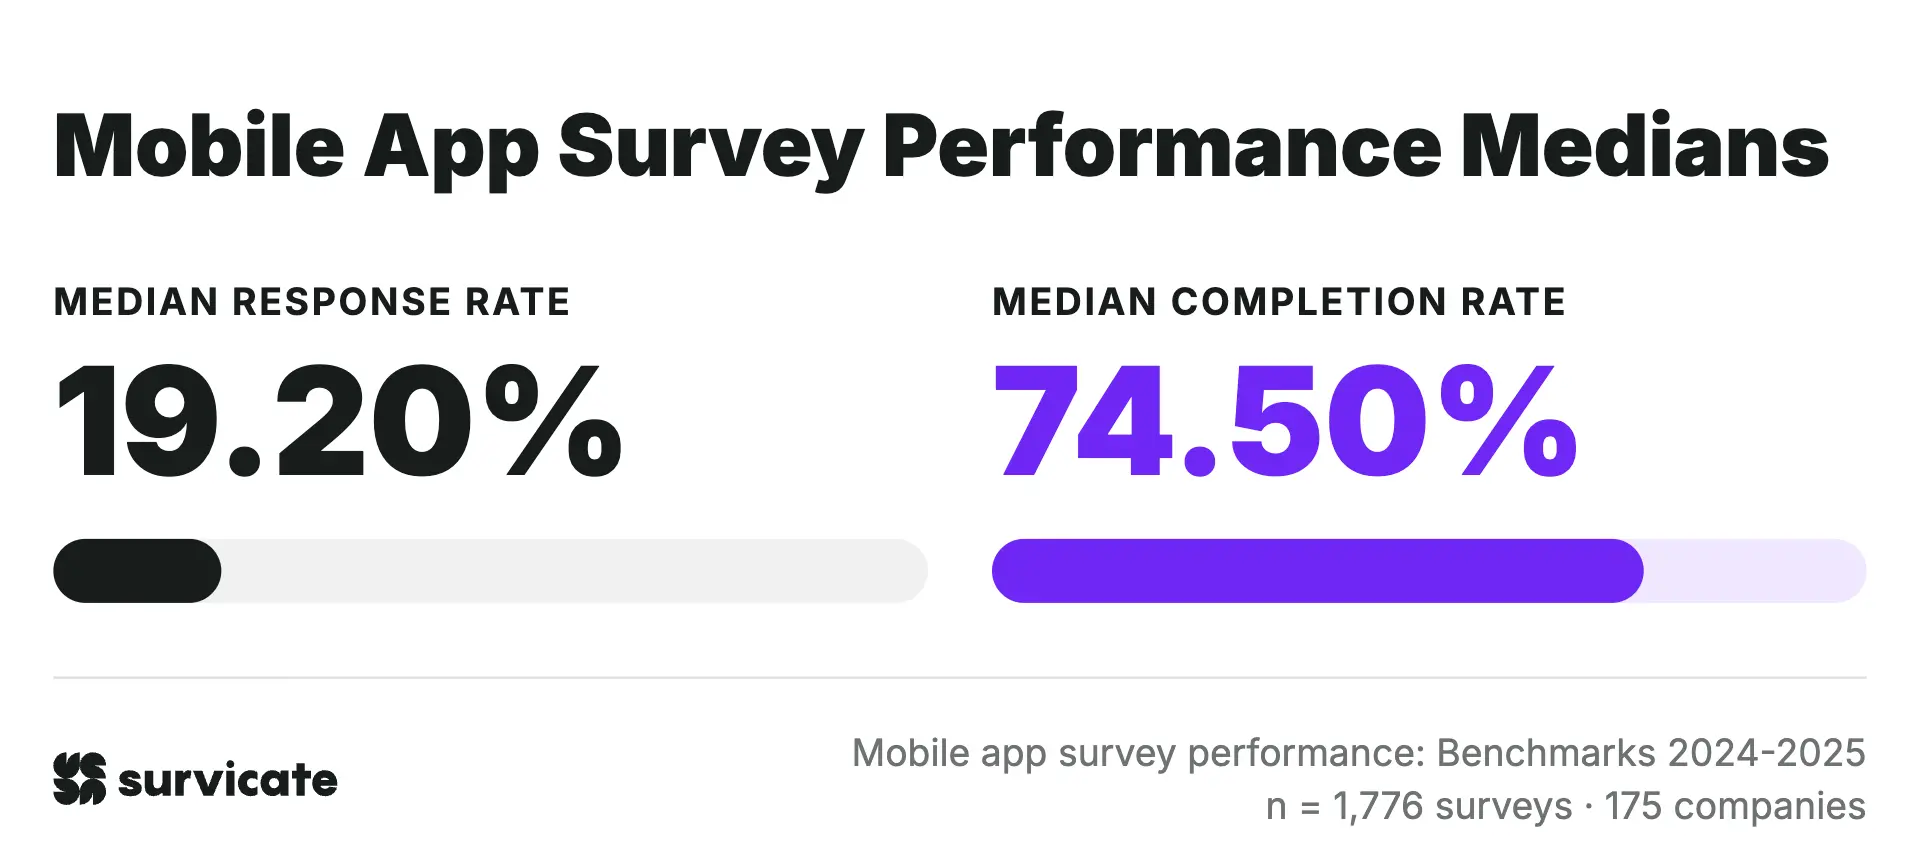
This dataset covers 175 companies across nine industries and two business models. The median response rate across the full dataset is 19.2%. This represents the typical share of survey views that resulted in a response across 1,776 mobile app surveys from 175 companies.
The median completion rate is 74.5%. This represents the typical share of survey questions answered by respondents, showing how much of a survey people complete on average. We report completion separately from response rate because the two metrics measure different stages of the survey experience.
Across all mobile app survey data, the typical survey achieves a 19.20% response rate and a 74.50% completion rate.
The middle 50% of mobile app surveys record response rates between 11.3% and 35.4%, while completion rates span from 65.2% to 85.0%. B2C companies account for 72.8% of the total survey sample, so these baseline medians primarily reflect B2C performance dynamics.
Fintech high-performing both for response and completion rates
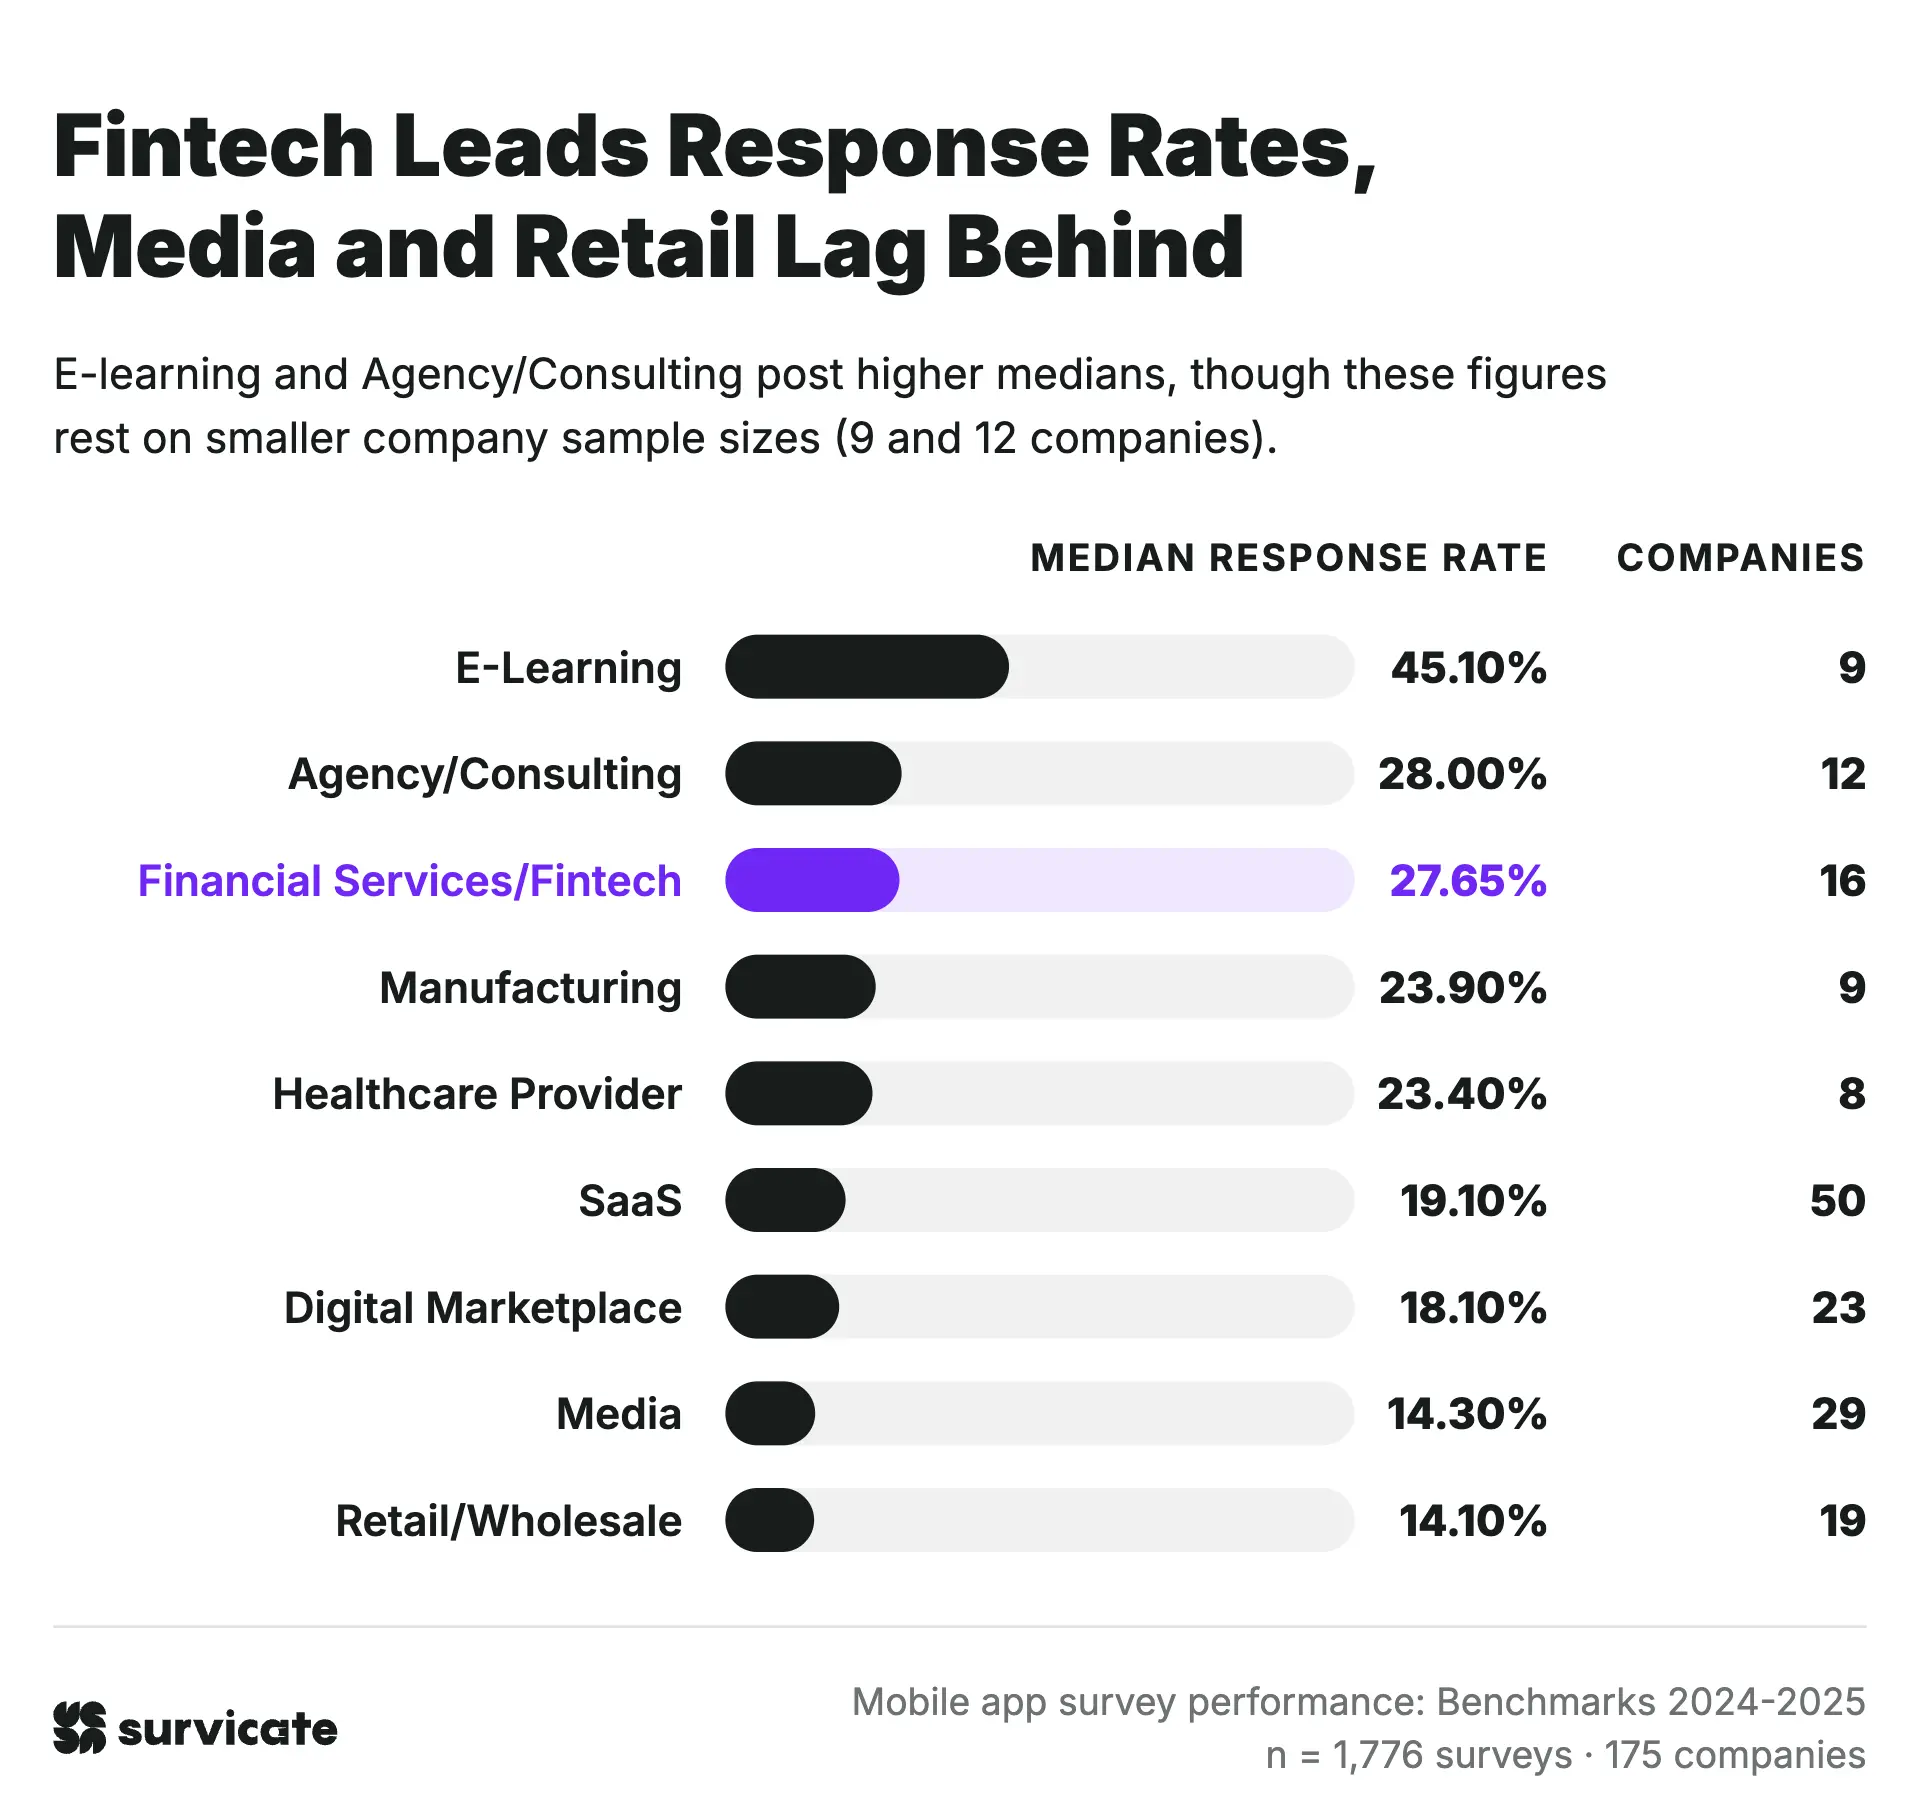
Industry performance varies a lot, with response rates ranging from 14.1% to 45.1% at the median level.
Fintech beats the overall 19.2% benchmark with a 27.7% median response rate. E-learning (45.1%) and Agency/Consulting (28.0%) post higher medians, though these figures rest on smaller company sample sizes (9 and 12 companies, respectively).
Media (14.30%) and Retail/Wholesale (14.1%) post the lowest medians, even though together they make up 39.92% of all analyzed surveys.
SaaS and Digital Marketplaces sit right around the overall baseline. SaaS shows a broad spread from 10.6% at the 25th percentile to 37.0% at the 75th percentile across 50 companies, pointing to mobile app survey design and implementation as major influence factors alongside industry context.
Fintech and consulting top completion rates while media stays at the bottom
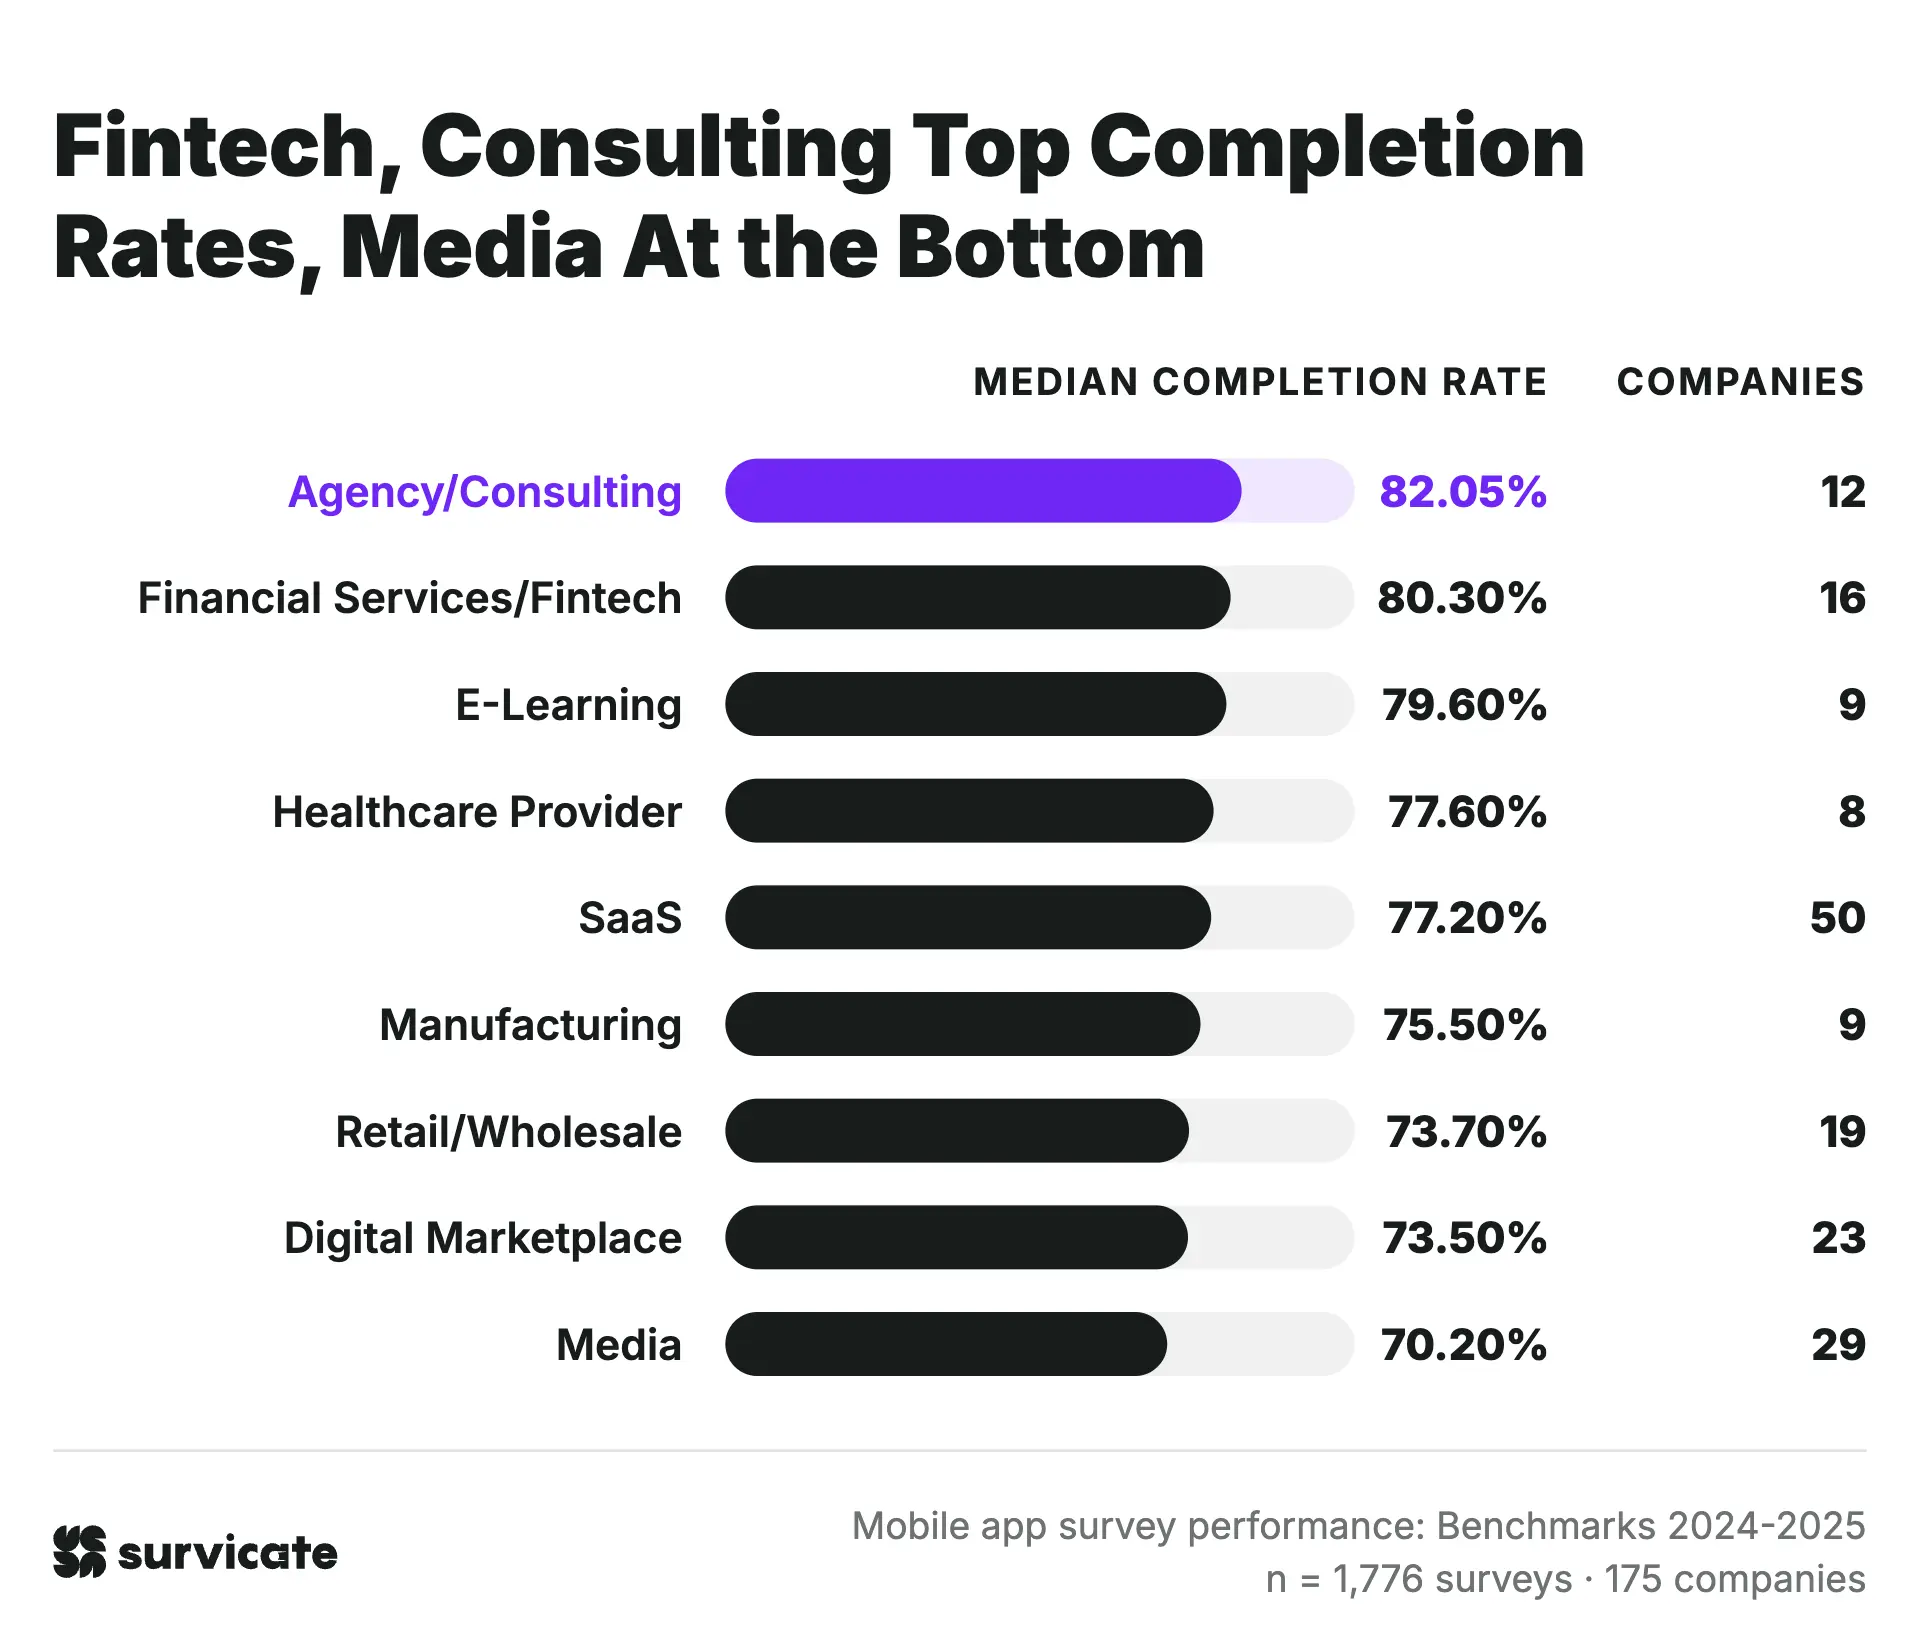
Completion rates vary across industries, spanning from a 70.2% median in media to 82.1% in agency and consulting.
Fintech tops the main industry groups with an 80.3% median completion rate, outpacing the 74.5% overall average. Agency/consulting (82.1%) and e-learning (79.6%) also turn in strong results, though small company sample sizes keep these comparisons preliminary.
Media lands at the bottom with a 70.2% median completion rate, while retail/wholesale comes in slightly higher at 73.7%.
SaaS and digital marketplaces stay close to the global average. SaaS records a 77.2% median, while digital marketplaces hit 73.5%.
Media and Digital Marketplaces launch the highest volume of surveys, making up almost half of the dataset (46.6%). SaaS brings in the largest number of individual companies (28.6%), followed by Media (16.6%) and Digital Marketplaces (13.1%).
Because E-learning, Agency/Consulting, Manufacturing, and Healthcare Provider each include only 8 to 12 companies, their response and completion rates serve as early signals rather than strict benchmarks.
B2C mobile app surveys outpace B2B on response rates
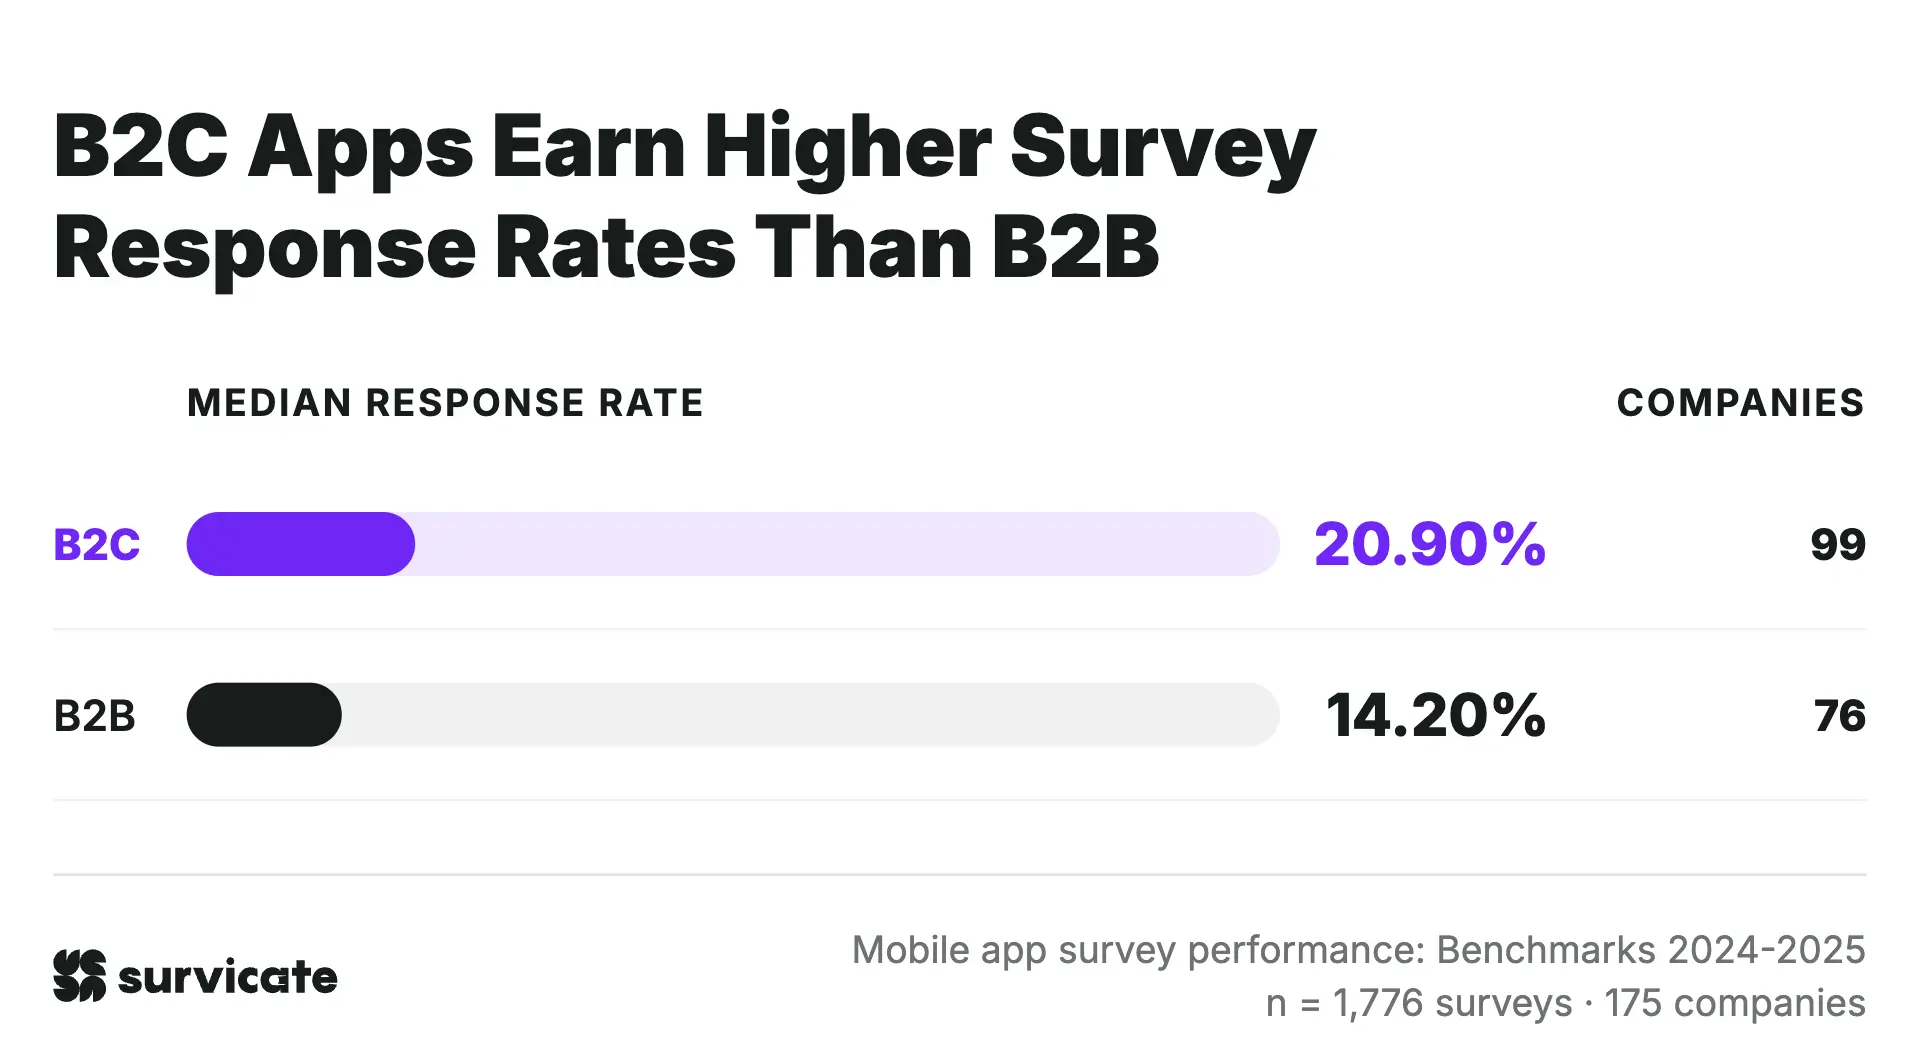
Response performance differs clearly by business model, with B2C mobile app surveys generating higher engagement across all percentiles.
B2C surveys collect more responses overall. At 20.9%, the median B2C response rate runs roughly 1.5 times higher than the B2B median of 14.2%. A similar gap holds at the 75th percentile, where B2C reaches 37.50% compared to 27.9% for B2B.
Strong execution still allows top B2B surveys to pull ahead of average B2C performance. B2B surveys in the 75th percentile hit a 27.9% response rate, easily passing the 20.9% B2C median.
Sample balance shapes these findings. B2C brands make up 56.6% of companies but produce 72.8% of total surveys, shifting the combined dataset toward consumer app behavior. B2B teams get a far clearer picture by comparing results against B2B-specific baselines rather than overall averages.
Full-screen surveys have twice the median response rate of dialogues
Full-screen surveys roughly twice the median response rate of dialogues: 38.9%, compared with 18.1%. Even lower-performing full-screen surveys come close to the median for dialogues, with a 25th-percentile response rate of 17.7%.
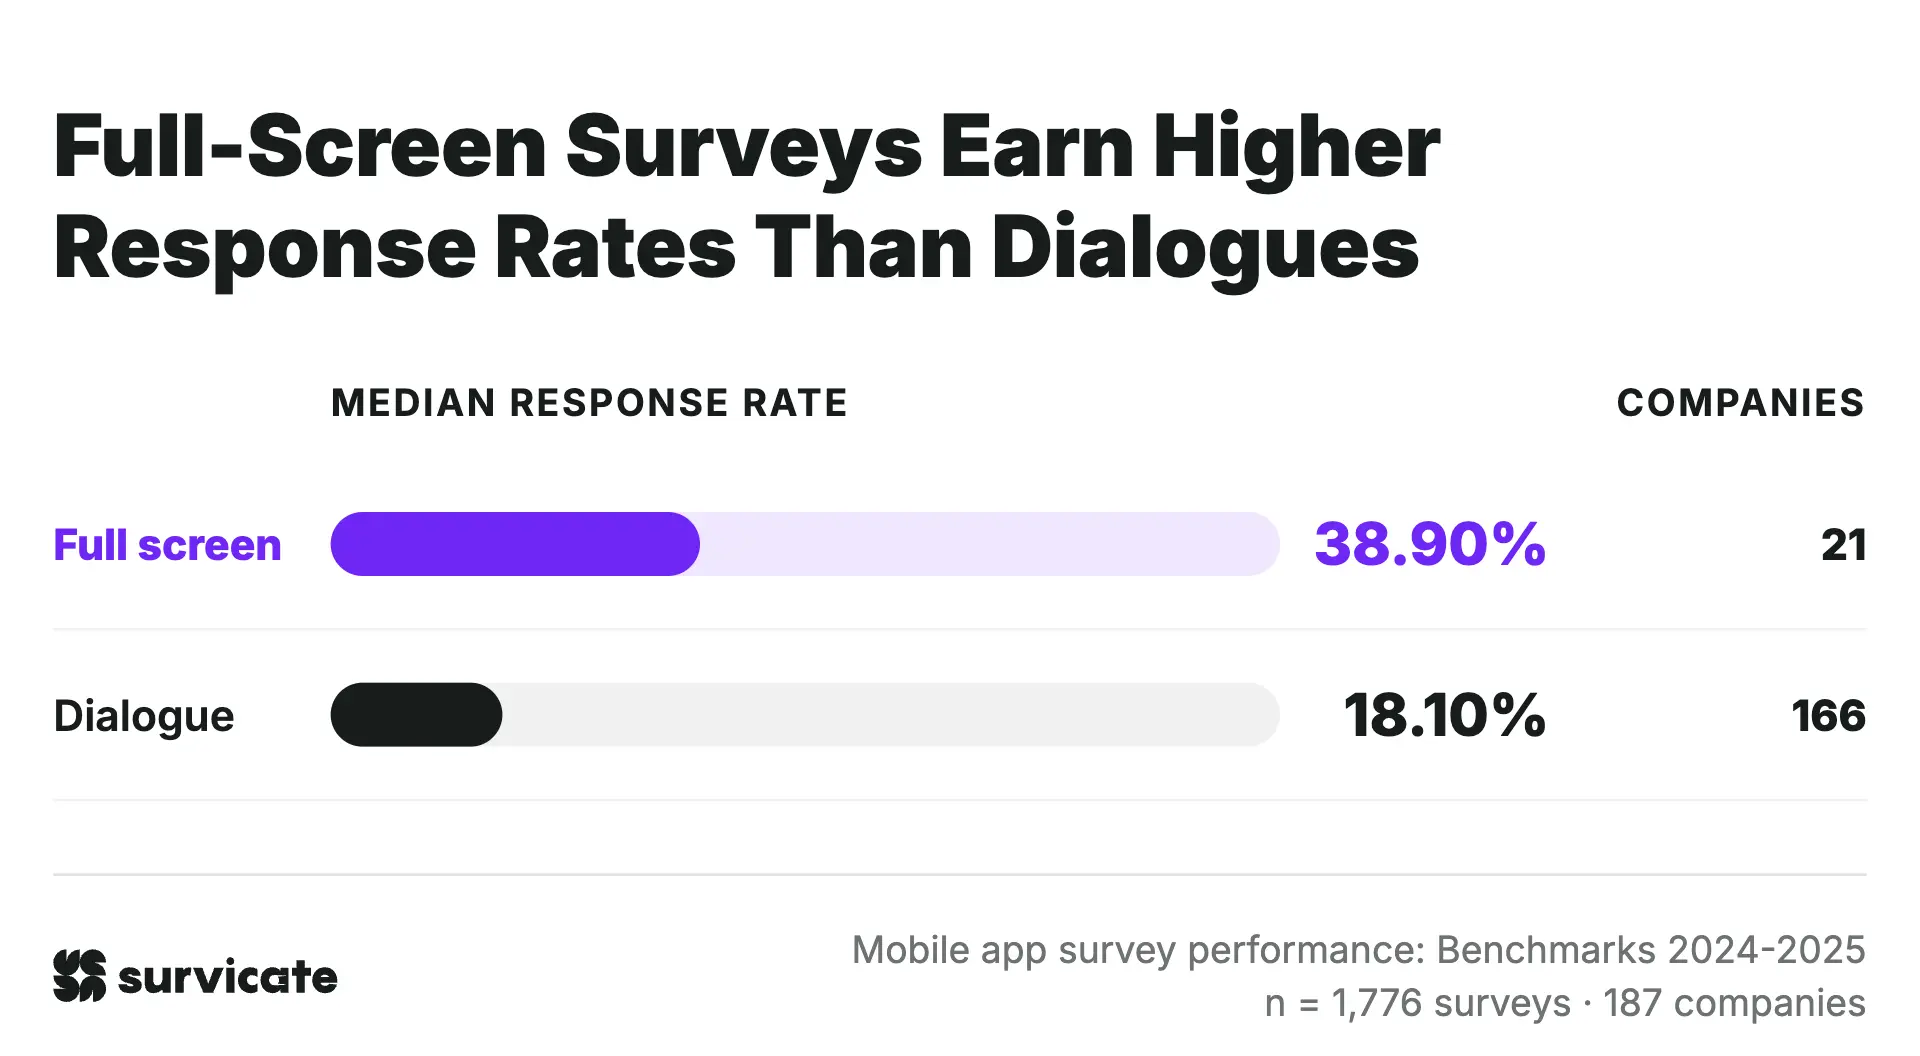
Teams might reserve full-screen surveys for higher-priority feedback moments, as they interrupt users more than dialogues. However, our data does not establish a definite, causal relationship between placement and response rates.
Completion rates are similar across survey placements
Full-screen surveys and dialogues see much closer results when it comes to median completion rates. The difference is just 3.2 percentage points, with 77.6%, for full screen view and 74.4% for dialogues.
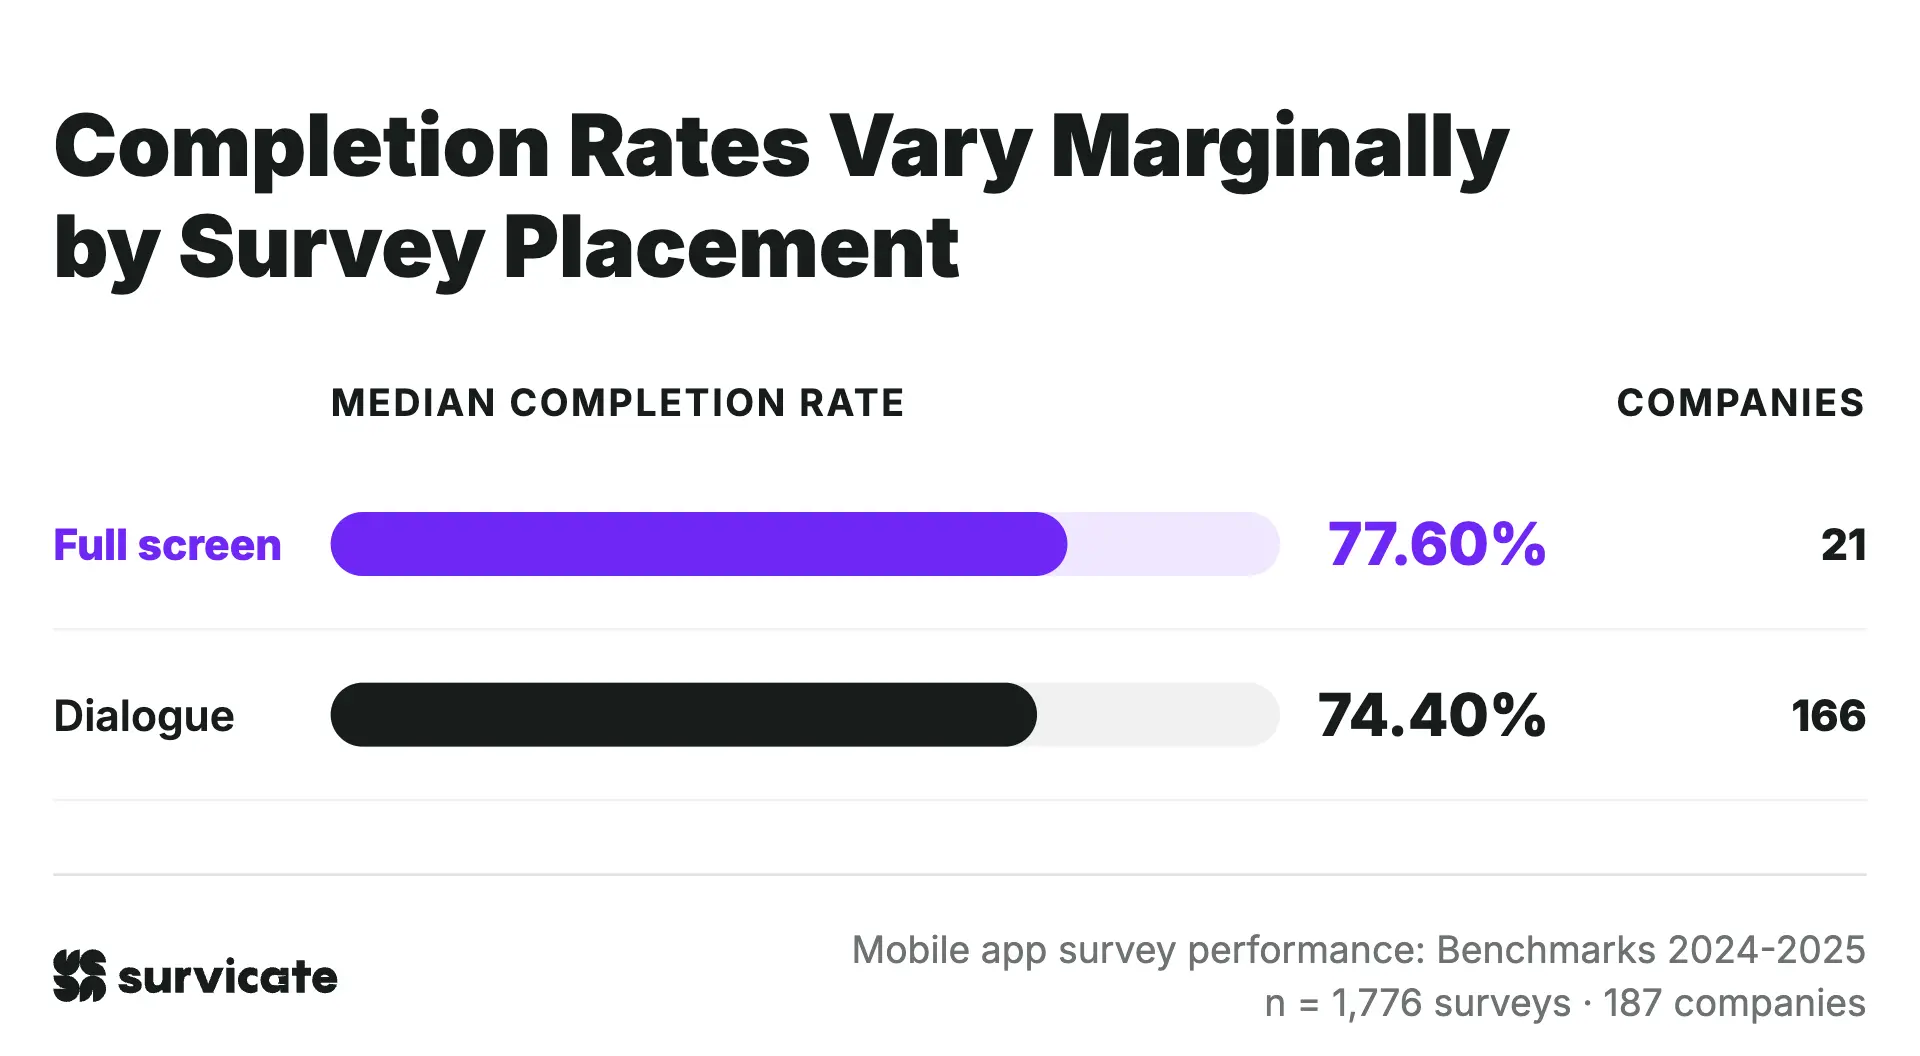
The gap is larger at the 75th percentile, where full-screen surveys reach 91.6% completion, compared with 84.1% for dialogues. Users are more likely to respond to full-screen surveys. Still, once they begin a survey, regardless of its placement, they see similar completion rates.
Dialogues are the dominant choice for survey placement
Dialogues account for 88.0% of surveys, while full-screen surveys for 12.0%. That said, full-screen results are based on 213 surveys from 21 companies only, so a small number of organizations may influence the benchmarks.
Event-triggered surveys outperform instant and delayed surveys
Event-triggered surveys have a median response rate of 24.1%, compared with 16.6% for delayed surveys and 14.9% for instant triggers. They are also the most common trigger type, accounting for 49.4% of surveys in the dataset (as shown in the table above). This matches what we have seen in the past, as event-based triggers also outperformed other trigger types in our popup survey benchmarks report.
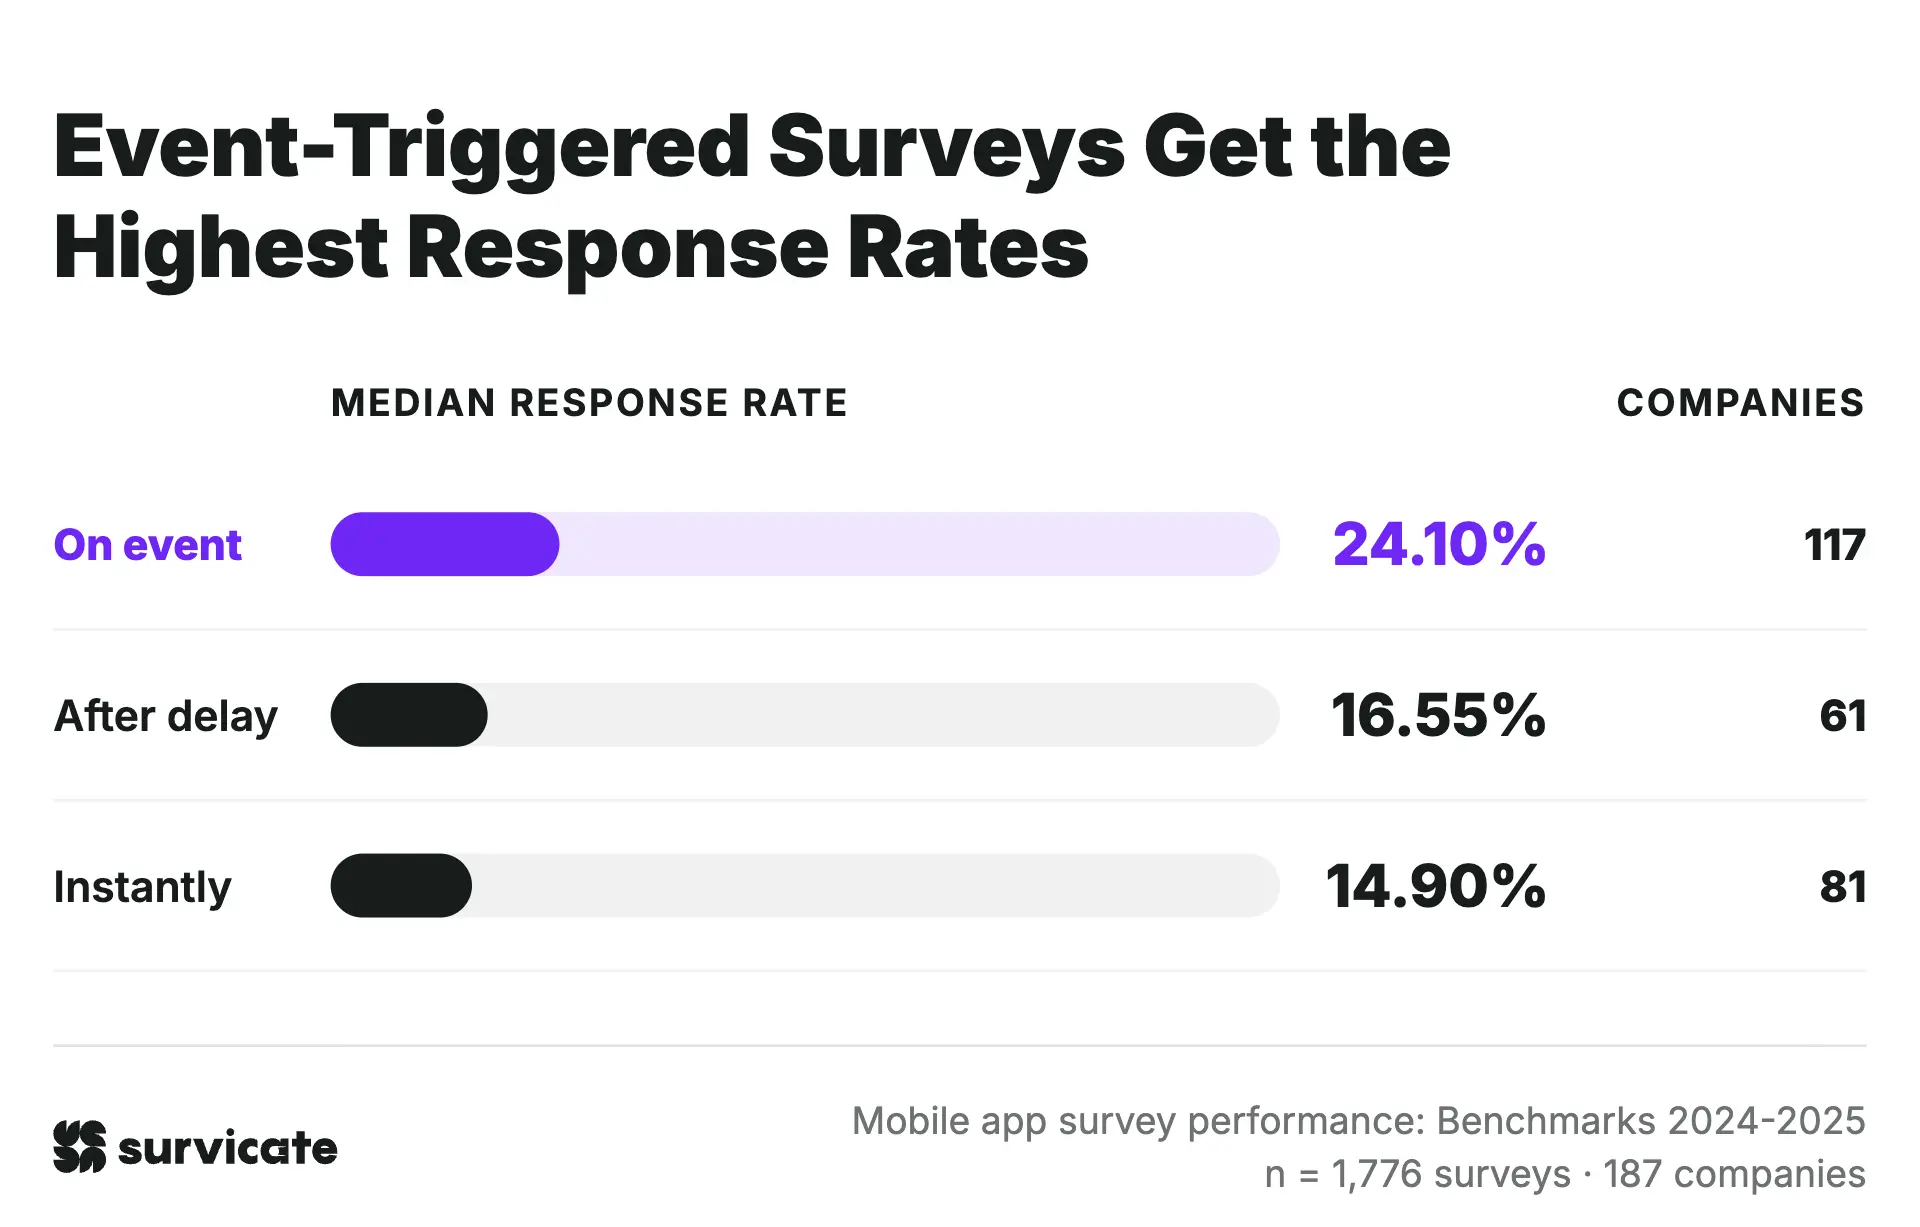
Instantly triggered surveys have the lowest 25th percentile response rate, at 7.7%, compared with 11.5% for delayed surveys and 14.0% for event-triggered surveys.
However, at the 75th percentile, instant triggers reach 27.5% and they exceed the 25.6% recorded by delayed surveys.
Event-triggered surveys also lead in median completion rates
Median completion rates vary less across trigger types than median response rates do. Completion rates range from 71.9% for delayed surveys to 77.4% for event-triggered surveys, a spread of 5.5 percentage points. By comparison, median response rates span 9.2 percentage points, from 14.9% for instant triggers to 24.1% for event-triggered surveys.
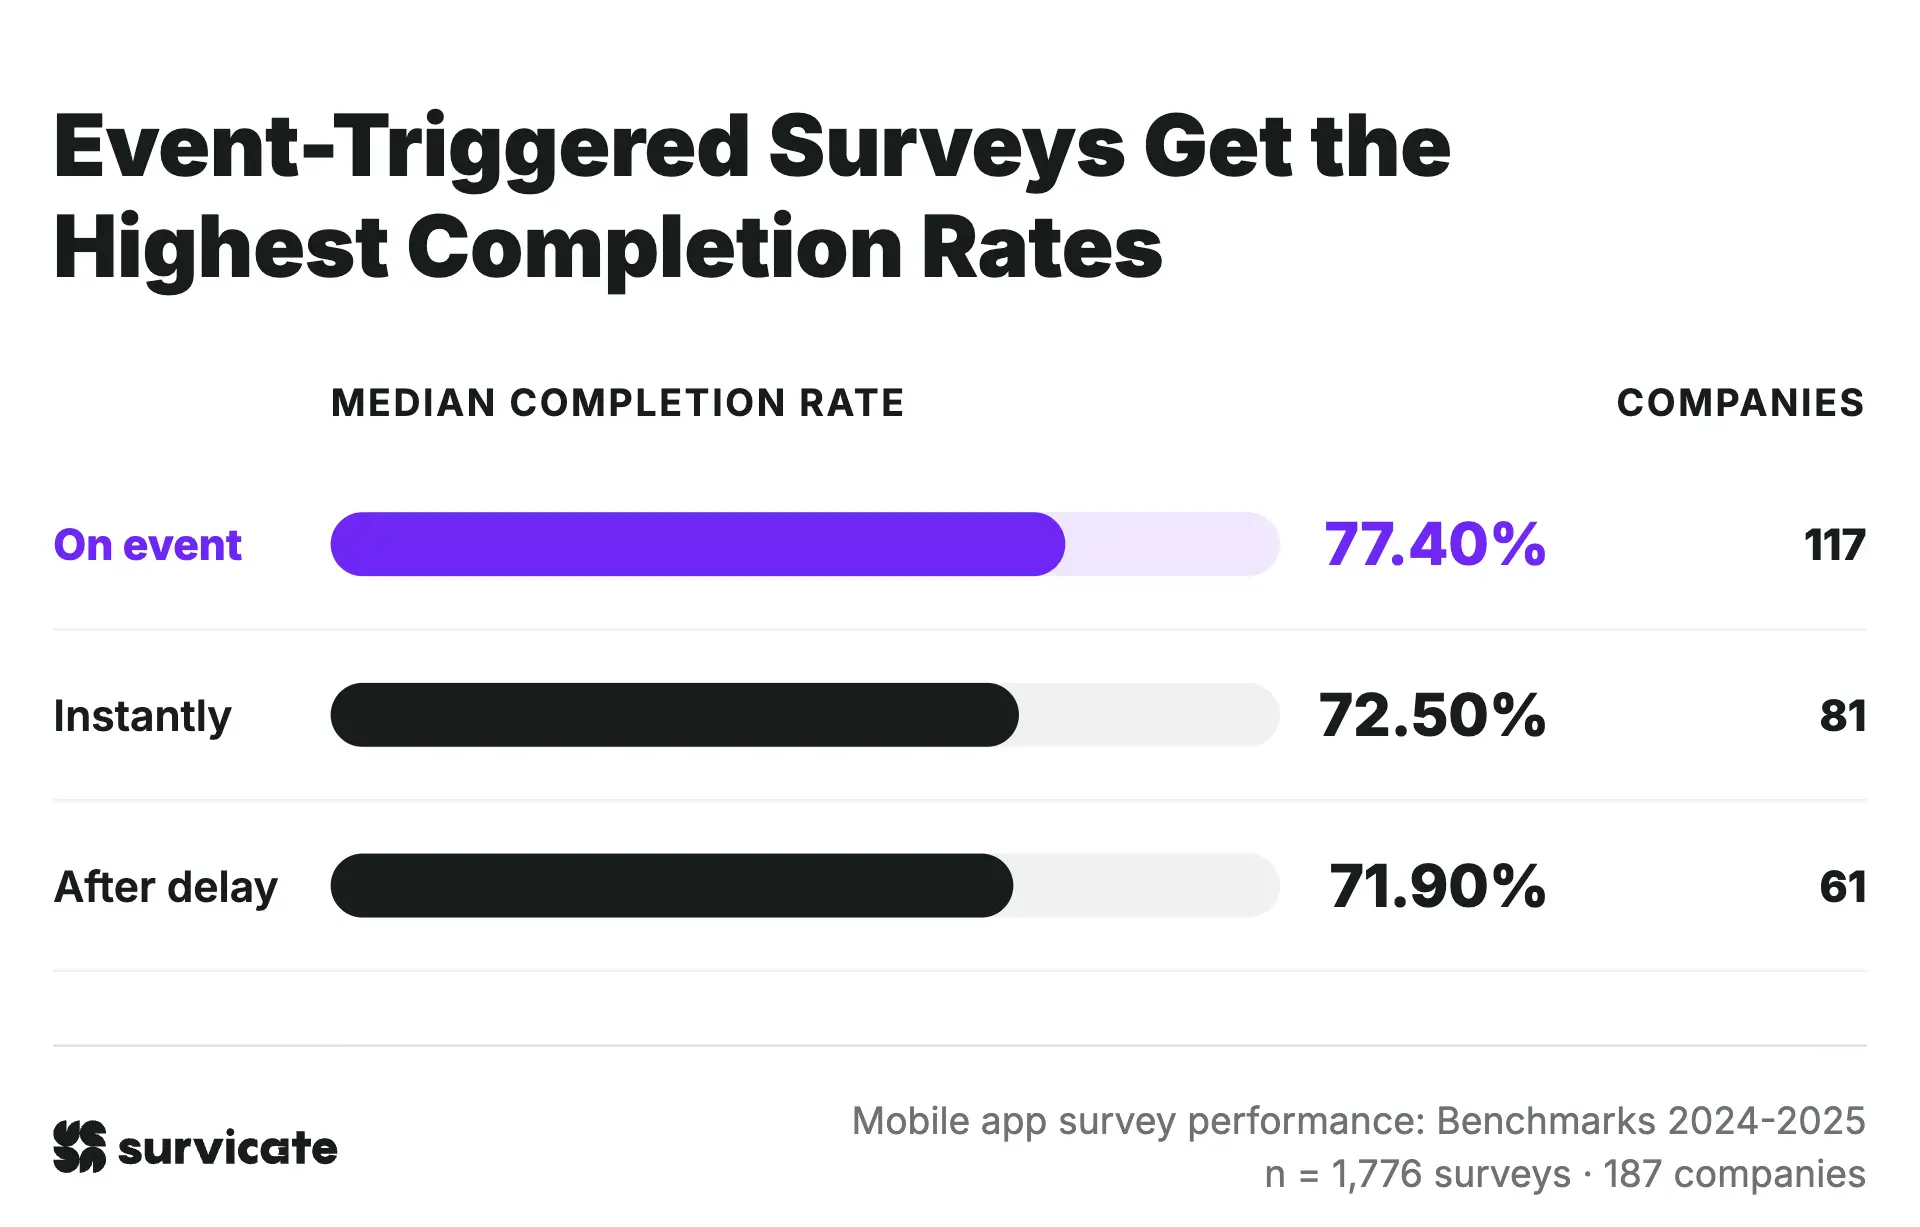
Instantly triggered surveys have the lowest 25th-percentile completion rate, at 59.3%, compared with 64.0% for delayed surveys and 67.6% for event-triggered surveys.
Event-triggered surveys also have the highest 75th-percentile completion rate, at 87.9%, followed by instant triggers at 82.3% and delayed triggers at 79.6%.
Our trigger timing analysis covers the entire dataset (1,776 surveys from 175 companies). Still, since some companies use multiple trigger types, the company counts across the categories below do not add up to 175.
Survey completion rates decline as surveys get longer
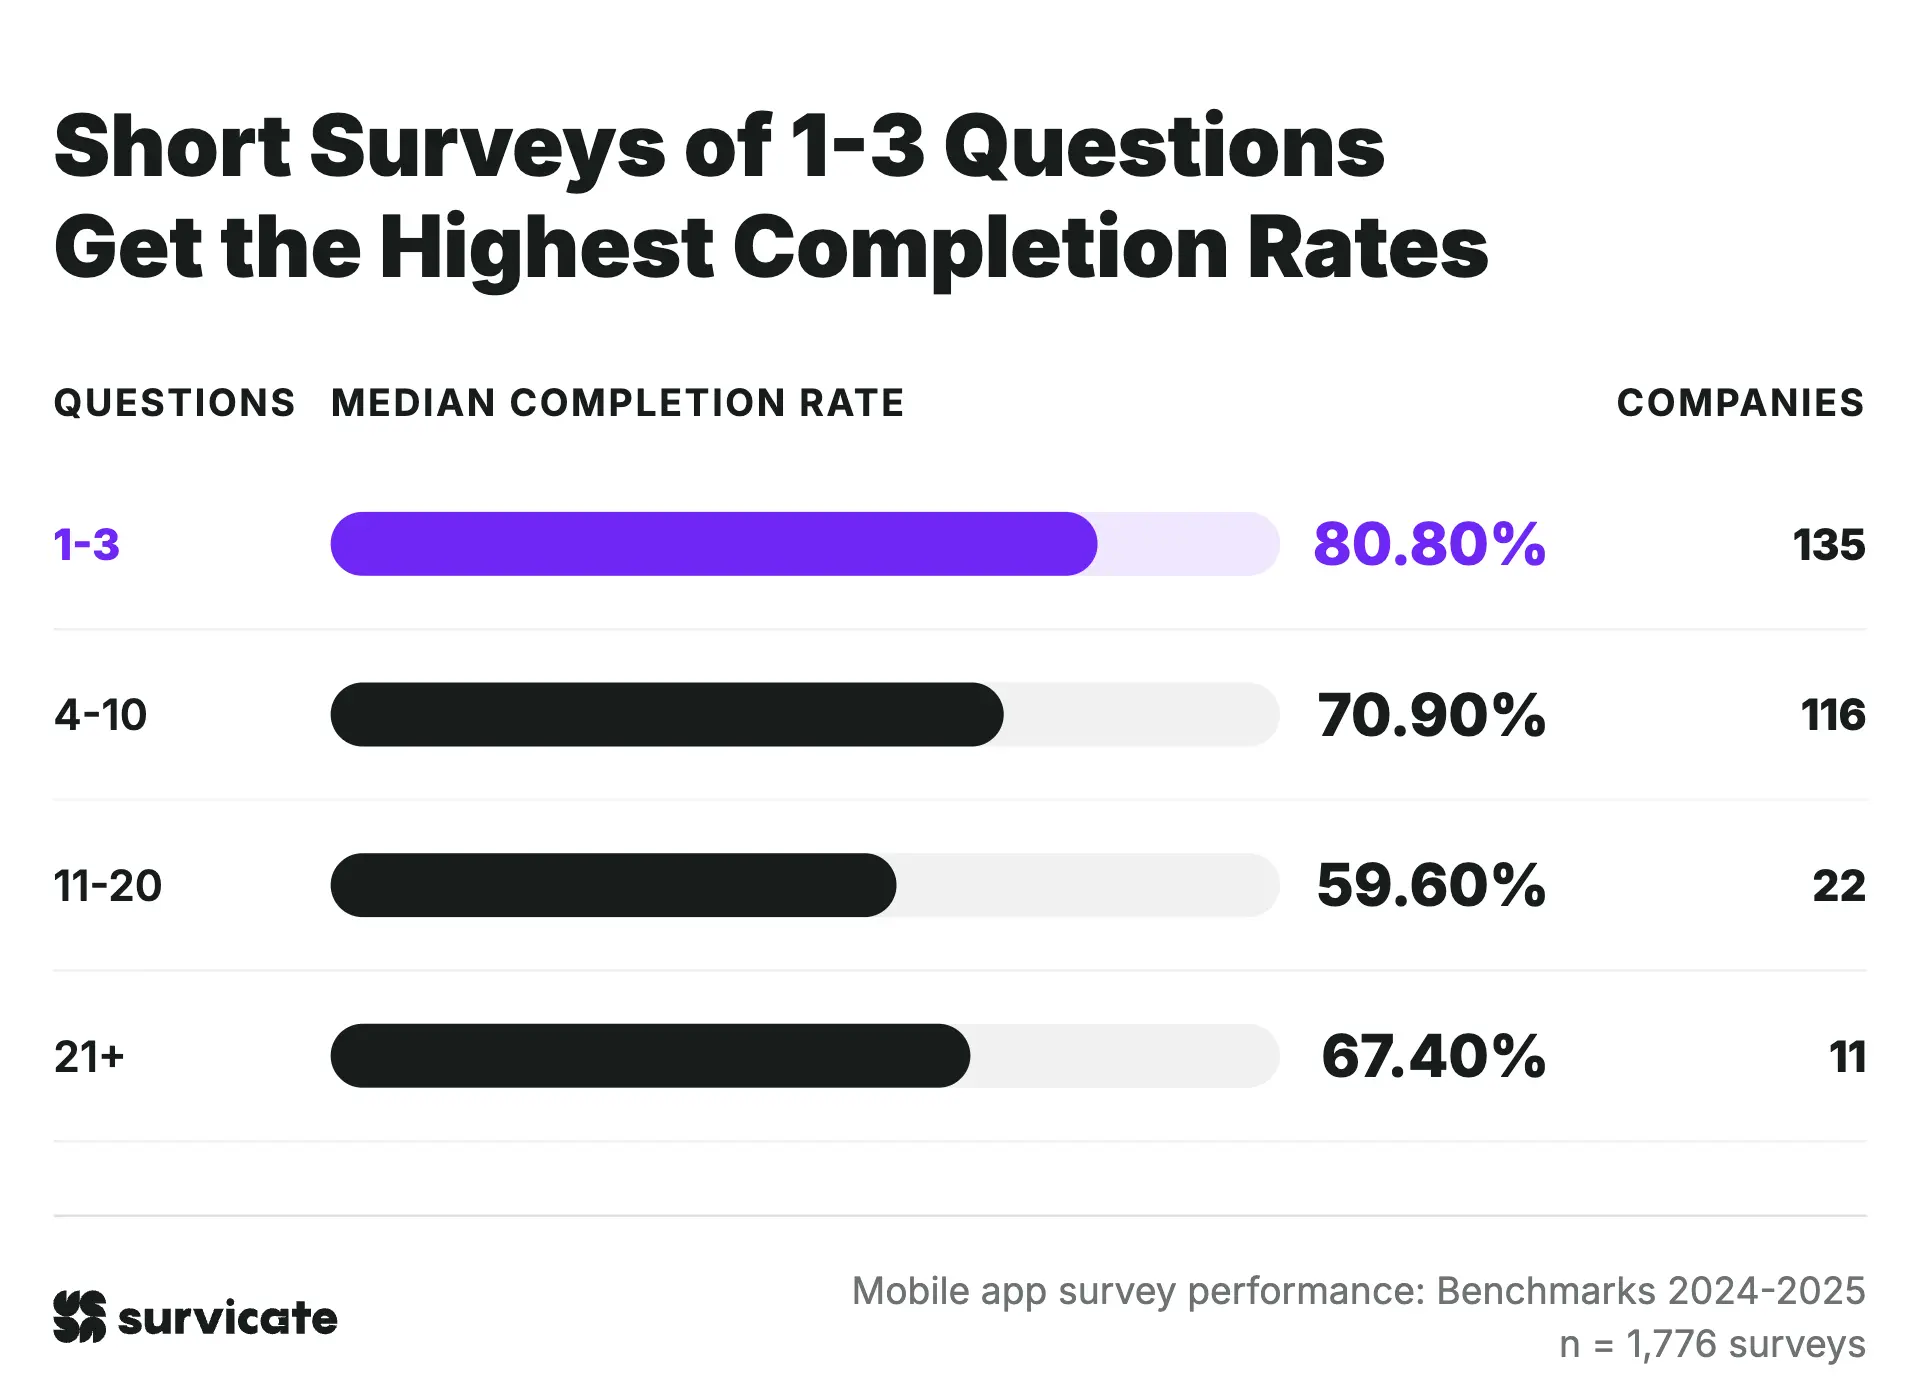
Micro-surveys with 1-3 questions have the highest median completion rate, at 80.8%. The median falls to 70.9% for surveys with 4-10 questions and 59.6% for those with 11-20 questions.
Each step up in question length costs roughly 10 percentage points (pp).
11-20 questions is, arguably, the “riskiest” length for surveys. It has the lowest median and the lowest floor in the table, with a quarter of these surveys finishing below 40%.
21+ is a surprising exception, but not a reliable one. This group includes just 35 surveys from 11 companies, so the results likely reflect a few highly-engaged audiences rather than evidence that extra long surveys work.
Nearly half of the surveys in our dataset (47.5%) contain 1-3 questions, while only 1.97% have 21 or more.
This breakdown includes completion rates only, as survey length likely carries a negligible casual effect on response rates.
Question types show clear links to response and completion rates
Mobile survey design elements are associated with differences in participation metrics across all 1,776 mobile app surveys. Our analysis excludes question types represented by only one survey and considers both overall survey length and individual question choices.
Smileys achieve the highest positive impact on response rates
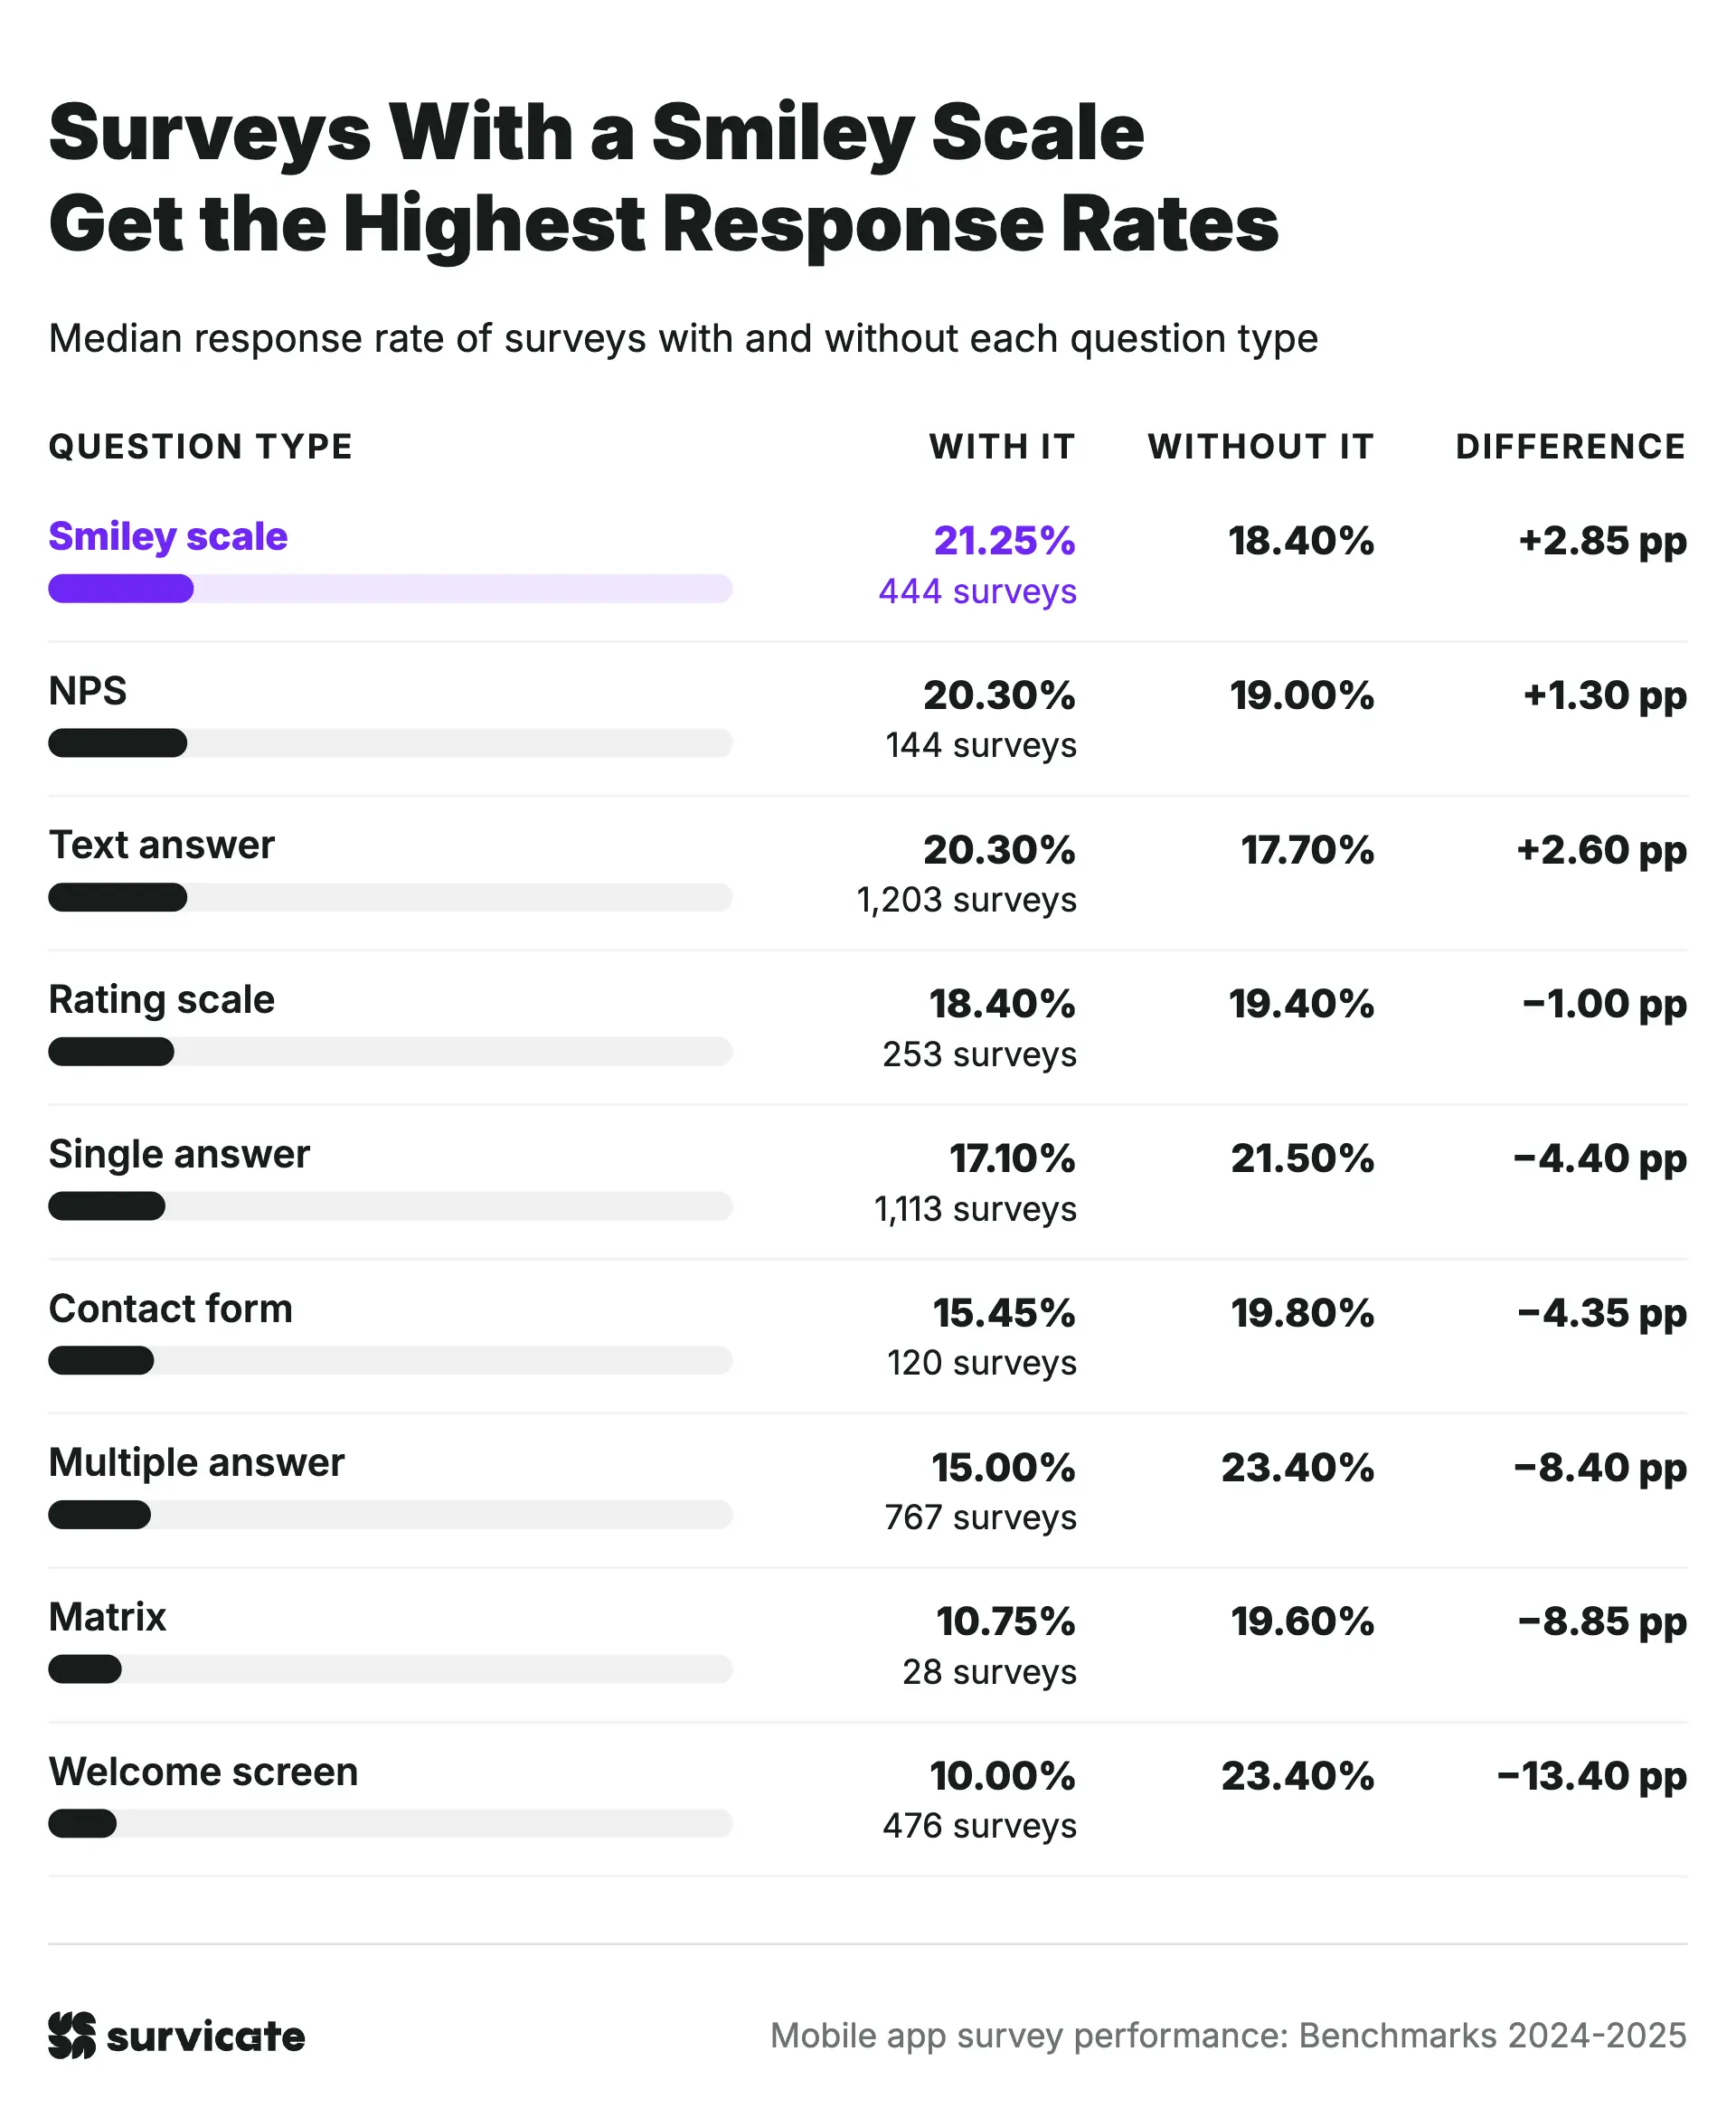
Smiley scales (+2.85 percentage points), text answers (+2.60 pp), and NPS (+1.30 pp) are the only question types that have higher response rates than surveys without them.
Welcome screens correspond to the sharpest drop in initial engagement, falling to a 10.0% median response rate compared to 23.4% for surveys without one (-13.40 pp gap).
Matrix questions have the highest negative impact on completion rates
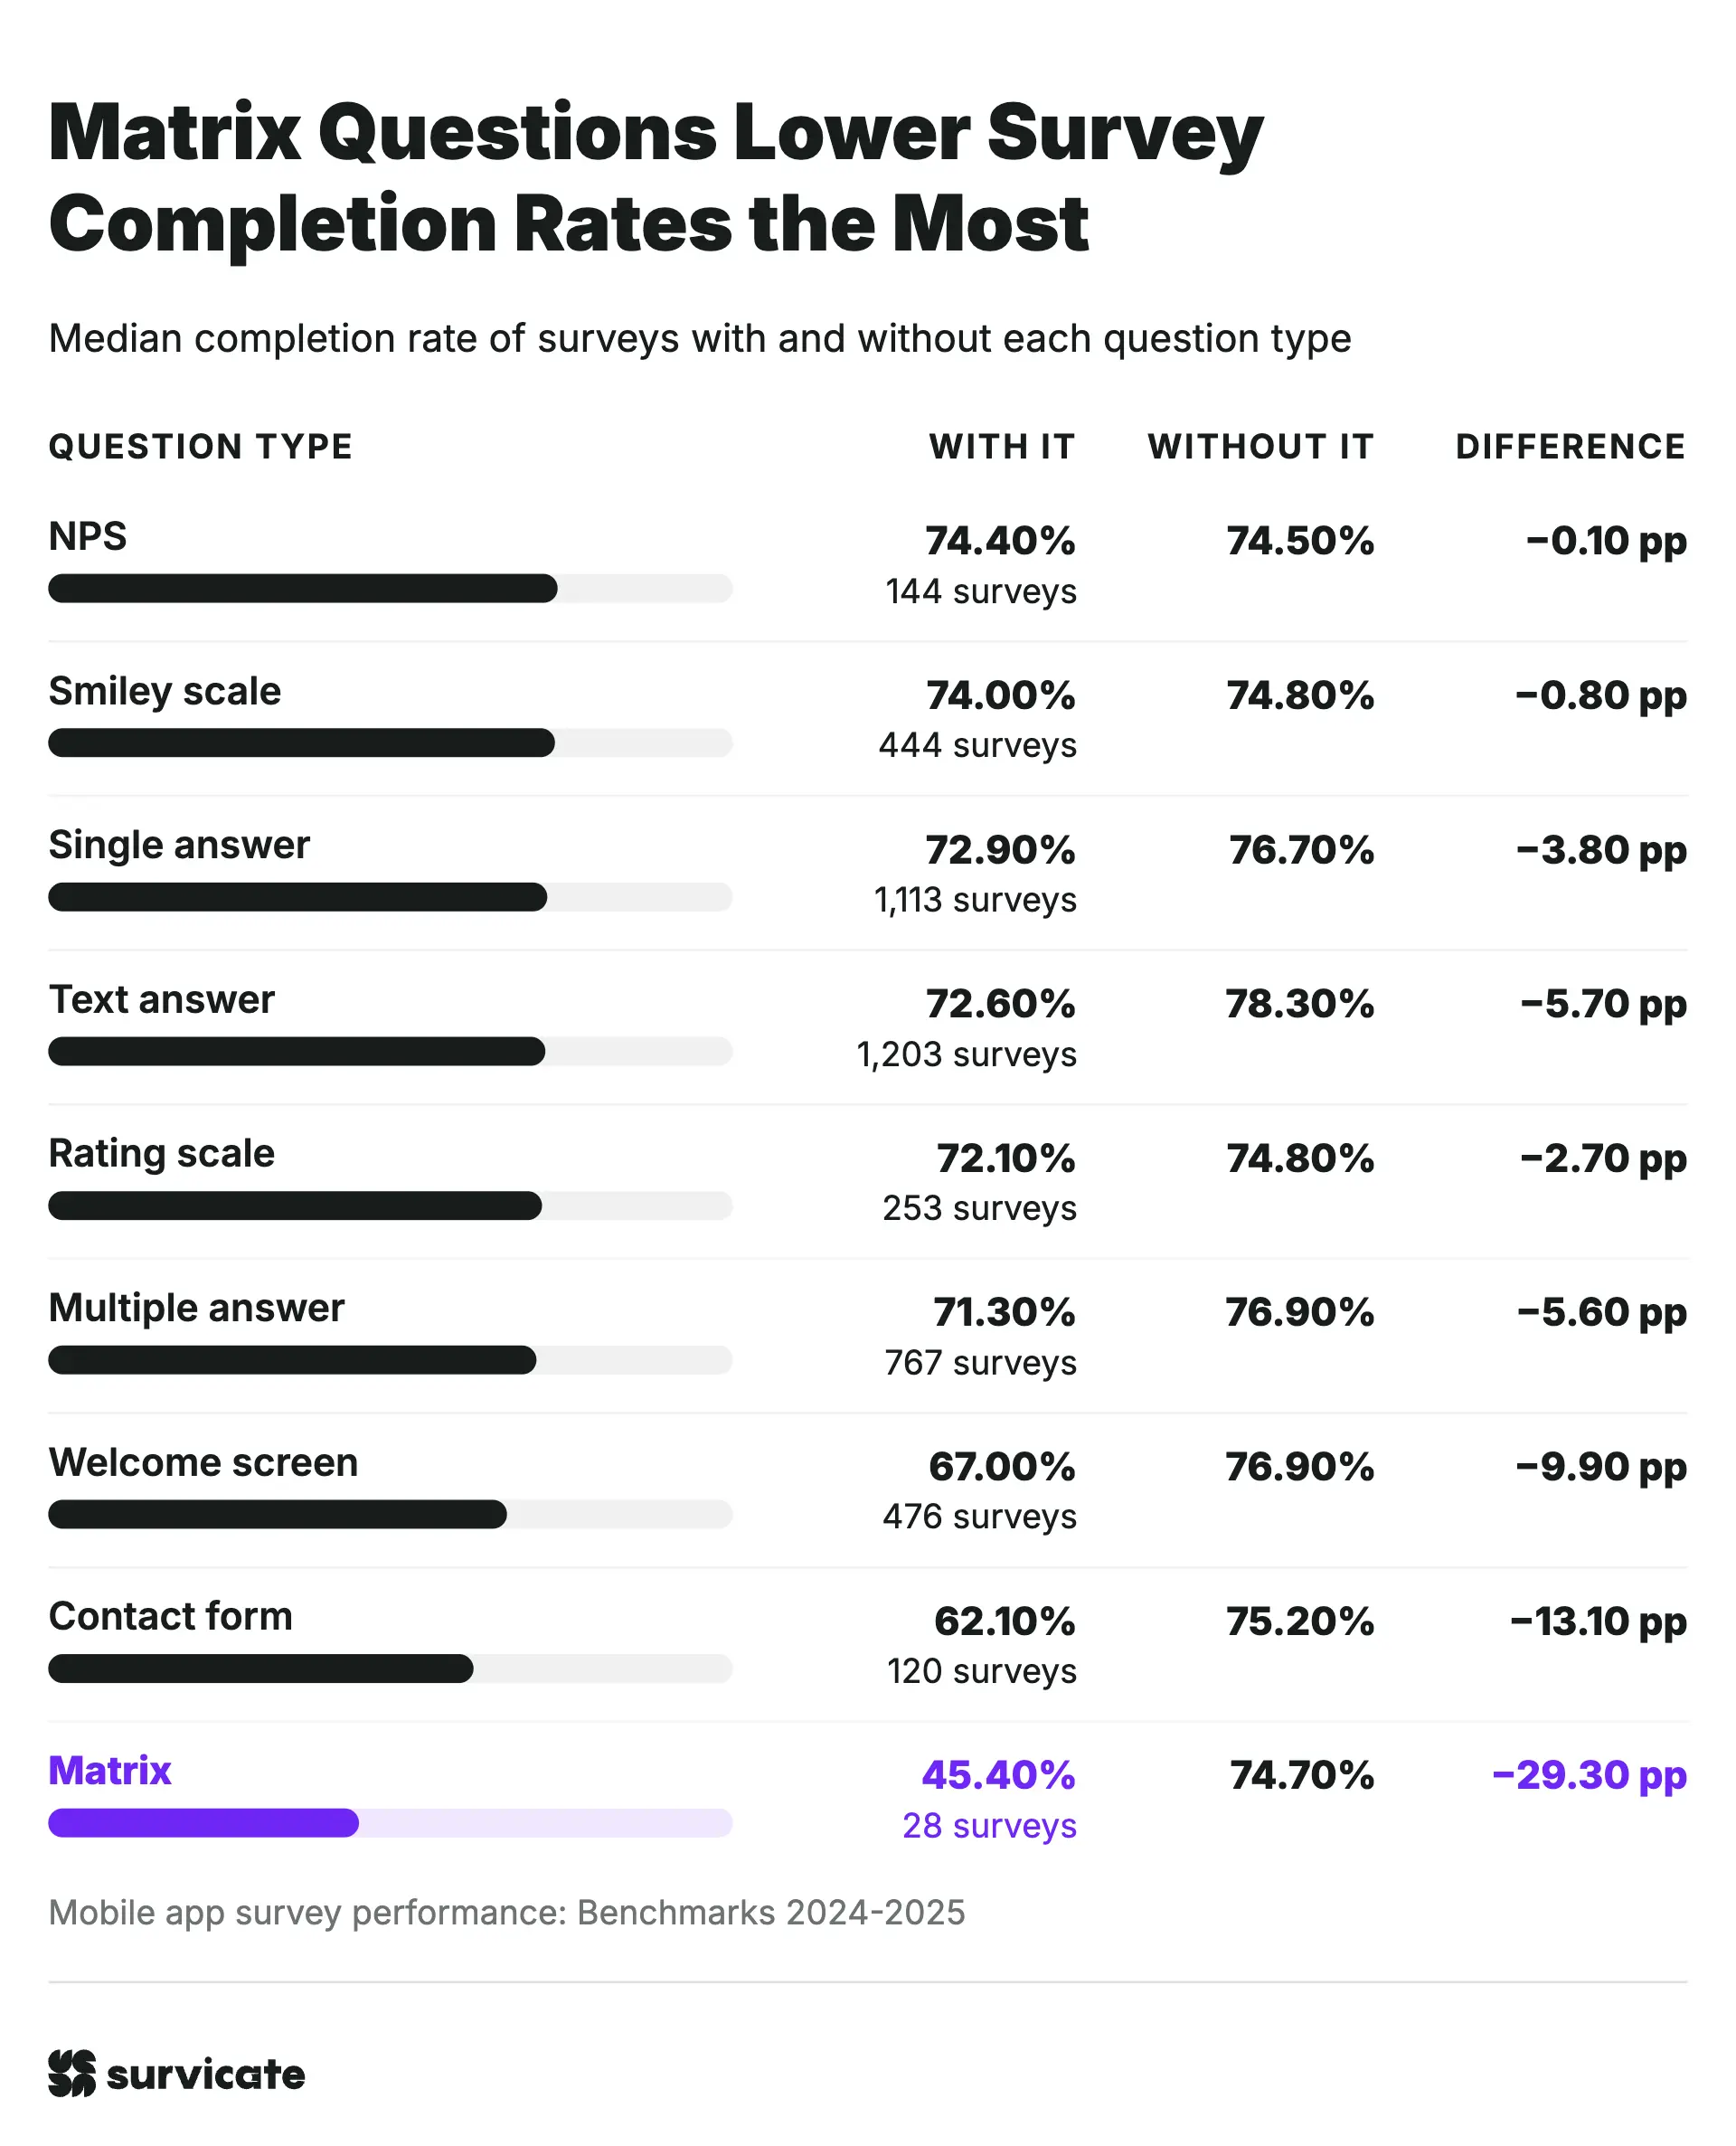
Matrix questions lead to the lowest completion rate at 45.4% (-29.30 pp gap). Contact forms (-13.10 pp) and welcome screens (-9.90 pp) also drop completion. Even top-performing matrix surveys in the 75th percentile (13.3% response, 63.1% completion) miss overall baseline medians on both measures.
Smiley scales and NPS questions remain stable. Both formats show neutral or positive links to response rates, with almost no negative impact on completion (-0.80 pp and -0.10 pp, respectively).
These figures reflect correlation, not direct causation. None of the listed question types match the 74.5% overall completion baseline, mostly because surveys with specific question types often include more total questions. Also, matrix questions appear in only 28 surveys, so those results offer early signals rather than firm baselines.
Response rates are the highest for companies with a 201-500 headcount
Companies with 201-500 employees have the highest median response rate, at 23.0%, followed by companies with 51–200 employees, at 21.3%. The 201-500 employee group also has the highest 75th percentile, at 43.2%.
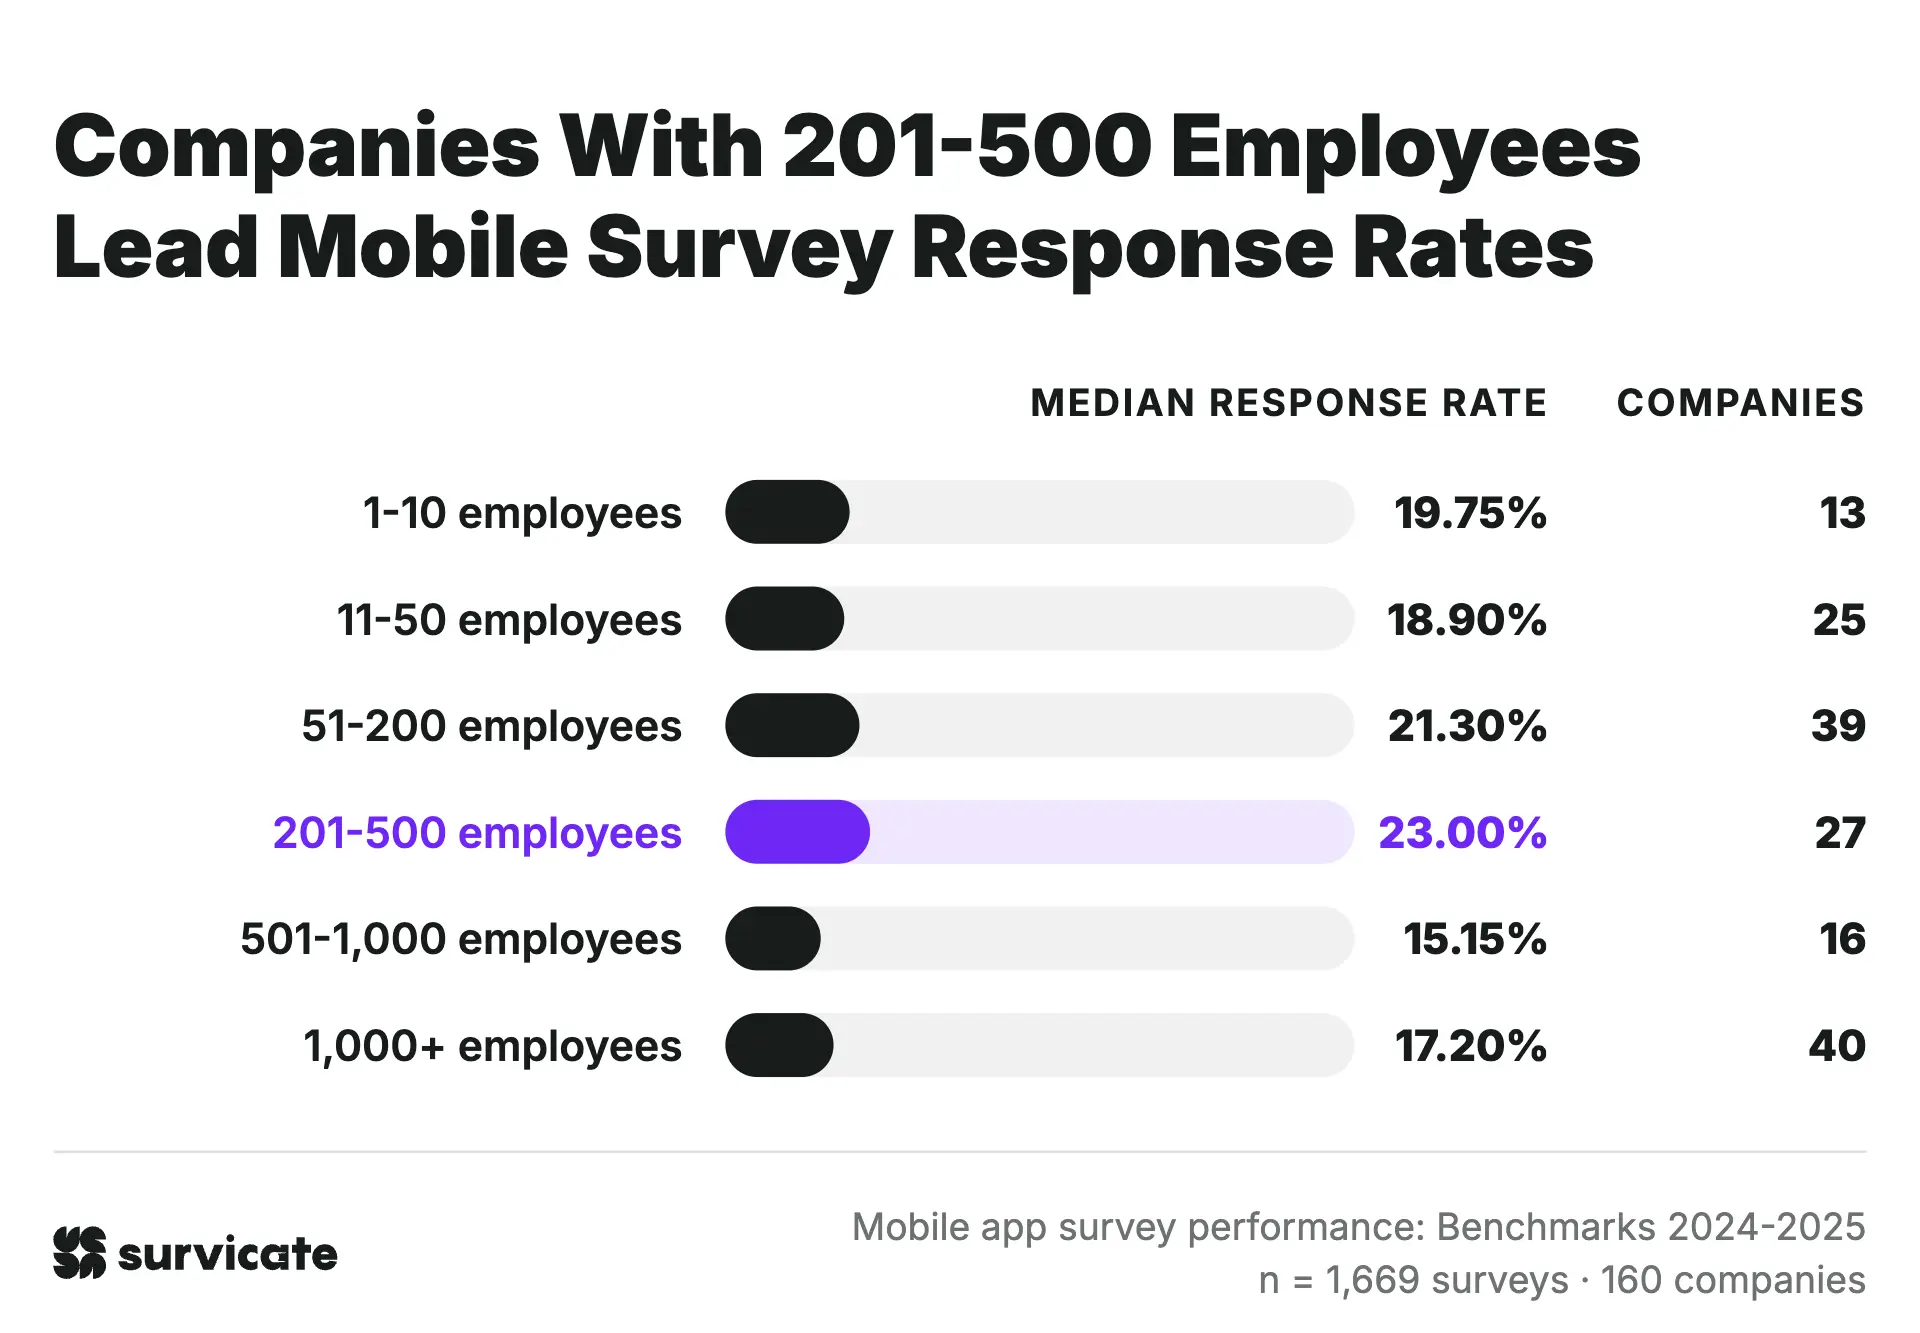
The results are lower among the largest companies. Those with 501-1,000 employees have a median response rate of 15.2%, while companies with more than 1,000 employees reach 17.2%. The 501-1,000 employee group also has the lowest 25th percentile, at 7.4%.
Company size appears to be less closely associated with response rates than industry. Median rates range from 15.2% to 23.0% across company sizes, compared with 14.1% to 45.1% across industries. For this reason, industry may provide a more useful reference point when setting response rate expectations.
Company size alone does not explain participation. The stronger response rates among mid-sized companies do not carry through to completion, where the largest companies rank lowest (see below). The data cannot tell us why, and the gap may reflect differences in survey length or design rather than company size itself. This remains a hypothesis rather than a relationship demonstrated by the data.
Companies with 11-50 employees see the highest completion rates
Businesses with 11-50 employees see the highest median completion rate, at 78.2%, followed by those with 51-200 employees, at 76.1%.
The largest companies have the lowest median rates – 72.2% for companies with more than 1,000 employees and 73.6% for those with 501-1,000 employees.
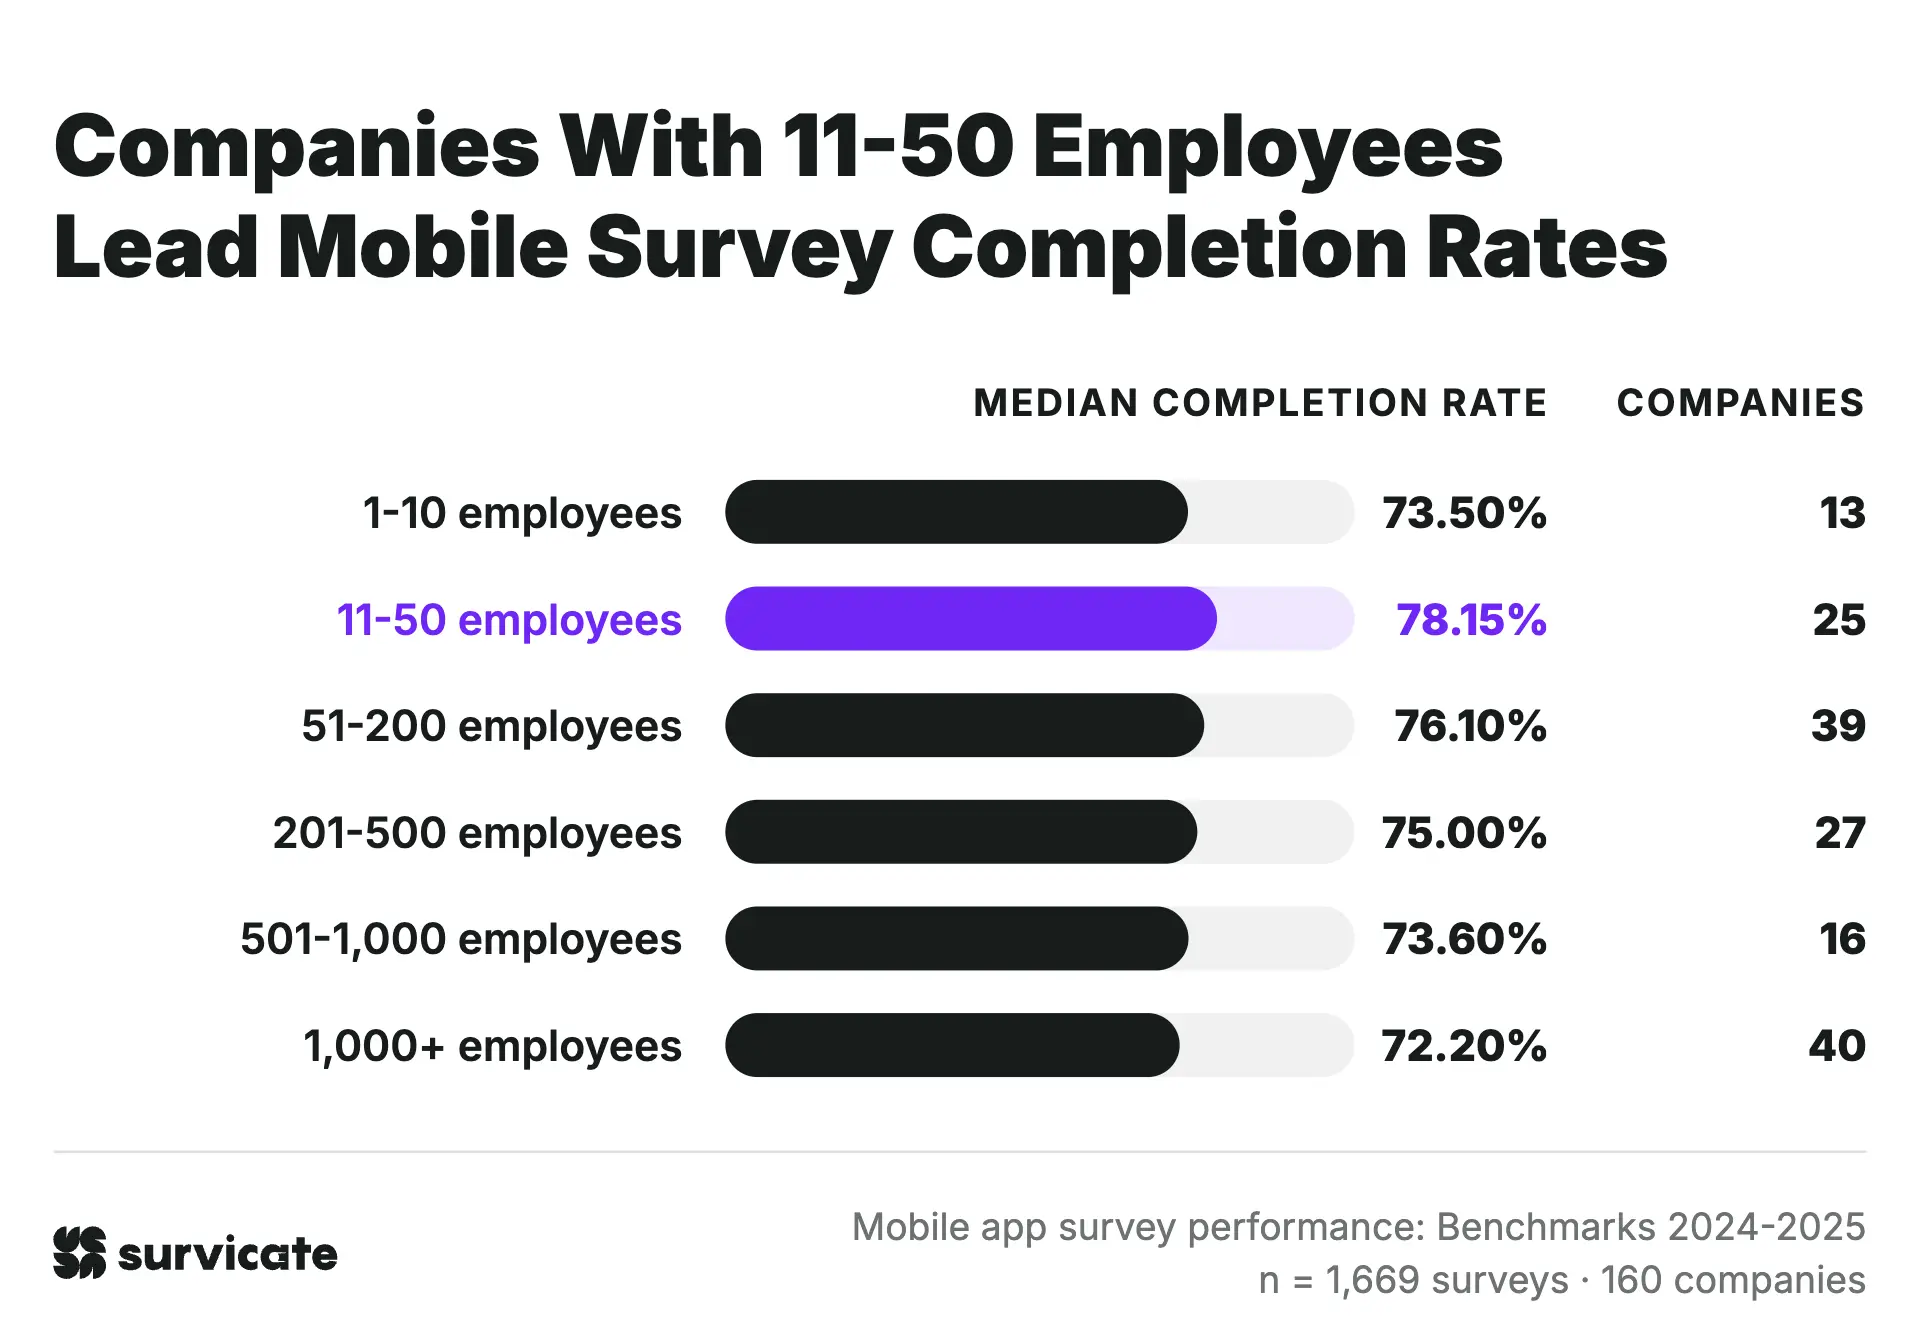
Company size relates differently to response and completion rates
This breakdown looked at 1,669 surveys from 160 companies. Company size could not be confirmed for 15 companies, representing 107 surveys, so these were excluded from the analysis.
Bear in mind that the 1-10 employee category includes just 30 surveys from 13 companies. When you look at the breakdowns, it’s worth treating them as a potential indicator rather than a firm benchmark.
How to apply these mobile app survey benchmarks
Compare performance against median figures rather than averages, which skew easily due to high-performing outliers. The business model serves as a key reference point here. B2C and B2B dynamics split sharply, as B2C mobile apps reach large user volumes that shift overall baseline figures.
Also, remember that mobile app survey benchmarks reflect a unique environment compared to web or email channels. App surveys operate under distinct conditions, with specific opportunities and limits around trigger timing, screen space, survey placement, and event tracking. App performance demands evaluation against dedicated mobile SDK standards rather than general survey baselines.
Ready to collect more targeted in-app feedback? Explore the Survicate Mobile SDK to get started.
For a broader perspective on survey performance, we also recommend comparing results across channels with our Survey Completion Rate Benchmarks Report and Survey Response Rate Benchmarks Report.