It’s often difficult to compare survey completion rates across different channels and formats. Is a lower completion rate a sign of poor survey design, or simply a result of how and where the survey is delivered?
This report answers that (and other questions) by analyzing over 8,000 surveys from more than 1,000 organizations, breaking down completion rates by format, industry, question count, and business model. By looking at both individual factors and combined breakdowns, it reveals how survey design and delivery shape how far respondents progress.
Rather than relying on a single benchmark, this approach shows how completion rates vary across contexts. Understanding these patterns allows teams to evaluate their results more accurately and design surveys that maximize the insights they capture.
Methodology
In this report, we analyzed 8,392 surveys from 1,087 organizations after applying a minimum threshold of 30 or more survey responses per survey. The dataset includes surveys conducted throughout 2025 across multiple survey formats, like mobile, page, widget, and Intercom surveys.
We ran the analysis at the survey level, meaning each survey counted as one unit in the dataset regardless of how many total responses it received. This approach helped prevent very large surveys from disproportionately influencing the benchmarks. It also makes the results more representative across different companies, industries, and survey setups.
What is survey completion rate?
Survey completion rate refers to the average percentage of survey questions answered across all respondents.
For example, if a survey contains 10 questions and respondents answer an average of 7 of them, the survey’s completion rate would be 70%.
This is different from response rate, which measures how many people started the survey compared to how many people saw it. A survey can have a high response rate but a lower completion rate if respondents begin the survey but drop off before finishing it.
Because completion rate measures how far respondents progress through a survey, it can help identify how survey length, format, or context affect respondent drop-off and overall survey engagement.
How we approached the analysis
Here’s what we decided on to keep the benchmarks reliable and comparable across different survey types and segments:
- We limited the dataset to surveys with at least 30 responses. At lower response volumes, completion rates became noticeably more volatile, where a small number of respondents could significantly shift the final result. Using a 30-response minimum helped reduce that potential issues, while still keeping the dataset broad enough to include smaller companies, niche industries, and lower-volume survey types.
- We analyzed completion rates across four primary breakdowns. These were: survey format, industry, question count, and business model (B2B vs. B2C). Where sample sizes were large enough, we also analyzed combinations of these breakdowns to compare completion rates across narrower survey segments.
- We treated each survey as a single unit in the analysis regardless of total response volume. In practice, this means a survey with 30 responses carried the same analytical weight as a survey with several thousand responses. This approach prevents high-volume surveys from dominating the benchmarks and allows the dataset to better reflect variation across the broader customer base.
- We report median completion rates together with 25th and 75th percentiles rather than averages. Averages are more easily skewed by unusually high or low results, while medians provide a more stable view of typical survey performance across the dataset.
- Our industry data insights required additional data cleanup before analysis. The original dataset included self-reported industry labels from customers, which were often highly specific, overlapping, or inconsistent. To make comparisons more meaningful and maintain statistically useful sample sizes, we enriched our dataset instead using external industry data and grouped those industries into broader categories before performing benchmark calculations.
- One-question surveys were treated separately in question-count analysis. Because respondents either answer the only question or abandon the survey before responding, one-question surveys naturally trend toward a median completion rate of 100%. Separating them from longer surveys helped avoid distorting broader question-count comparisons.
Key findings
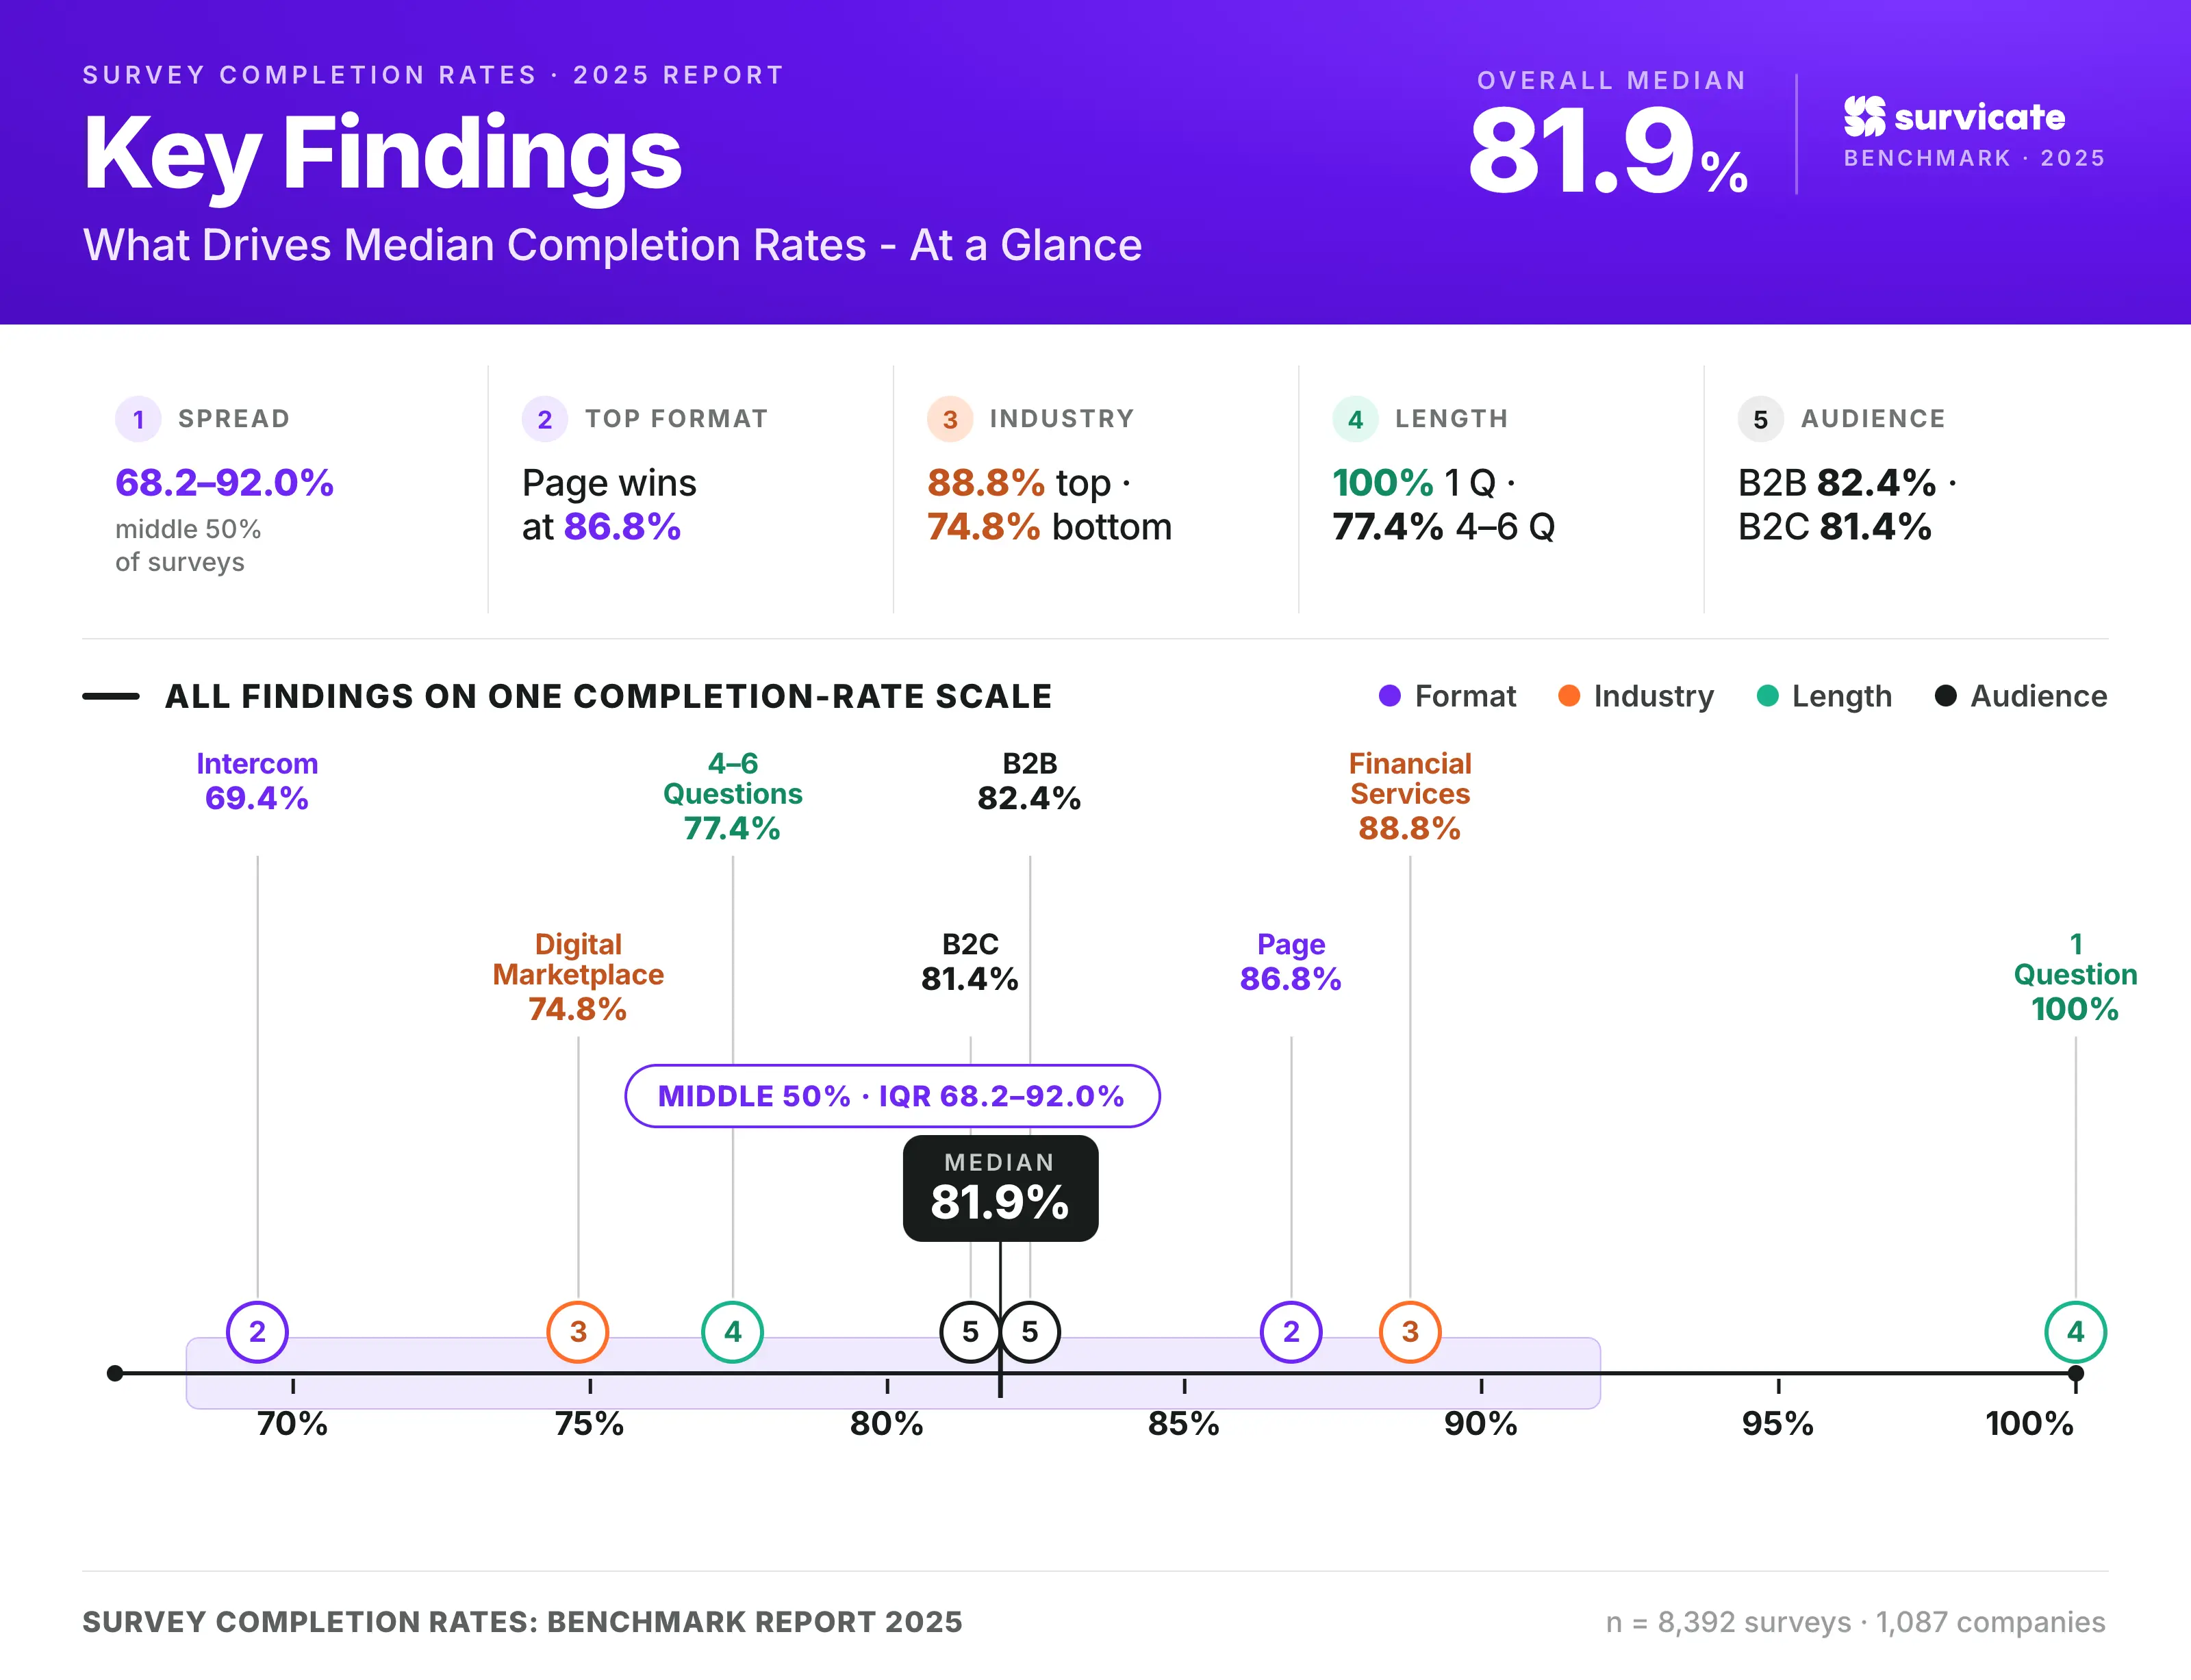
- The overall median survey completion rate is 81.9%.
Half of all surveys achieved a completion rate of 81.9% or higher. The middle 50% fell between 68.2% and 92.0%, which indicates that completion rates around 80% are broadly in line with most surveys in our dataset.
- Page surveys have the highest median completion rate at 86.8%.
Completion rates vary more by format than by business model or question count. Page surveys reached the highest median completion rate (86.8%), while widget and mobile surveys clustered around 75%. Intercom surveys saw a lower median of 69.4%.
- Financial Services (88.8%) and Wholesale (86.6%) lead all industries on median completion rate.
Media (74.9%) and Digital Marketplace (74.8%) sit lowest, with E-learning (79.6%) just above them, while most other sectors cluster in the low-to-mid 80% range. If you're in a lower-performing industry, benchmark against your peers rather than the overall median.
- Surveys with fewer questions consistently show higher completion rates, with a slight uptick after question no.7.
Microsurveys with 2-3 questions reached a median completion rate of 86.8%, compared to 77.4% for 4-6 questions. That said, while completion rates decline as surveys become longer, surveys with 7 or more questions show a slight increase to 78.8%. This shows that completion rates are highest for short surveys, while longer surveys follow a more nuanced pattern, with a modest uptick beyond the mid-length range.
- B2B surveys slightly outperform B2C surveys on median completion rate.
B2B surveys reached a median completion rate of 82.4%, compared to 81.4% for B2C. This difference is consistent but small, showing that completion rates are broadly similar across business models.
Overall completion rates – a high baseline across surveys
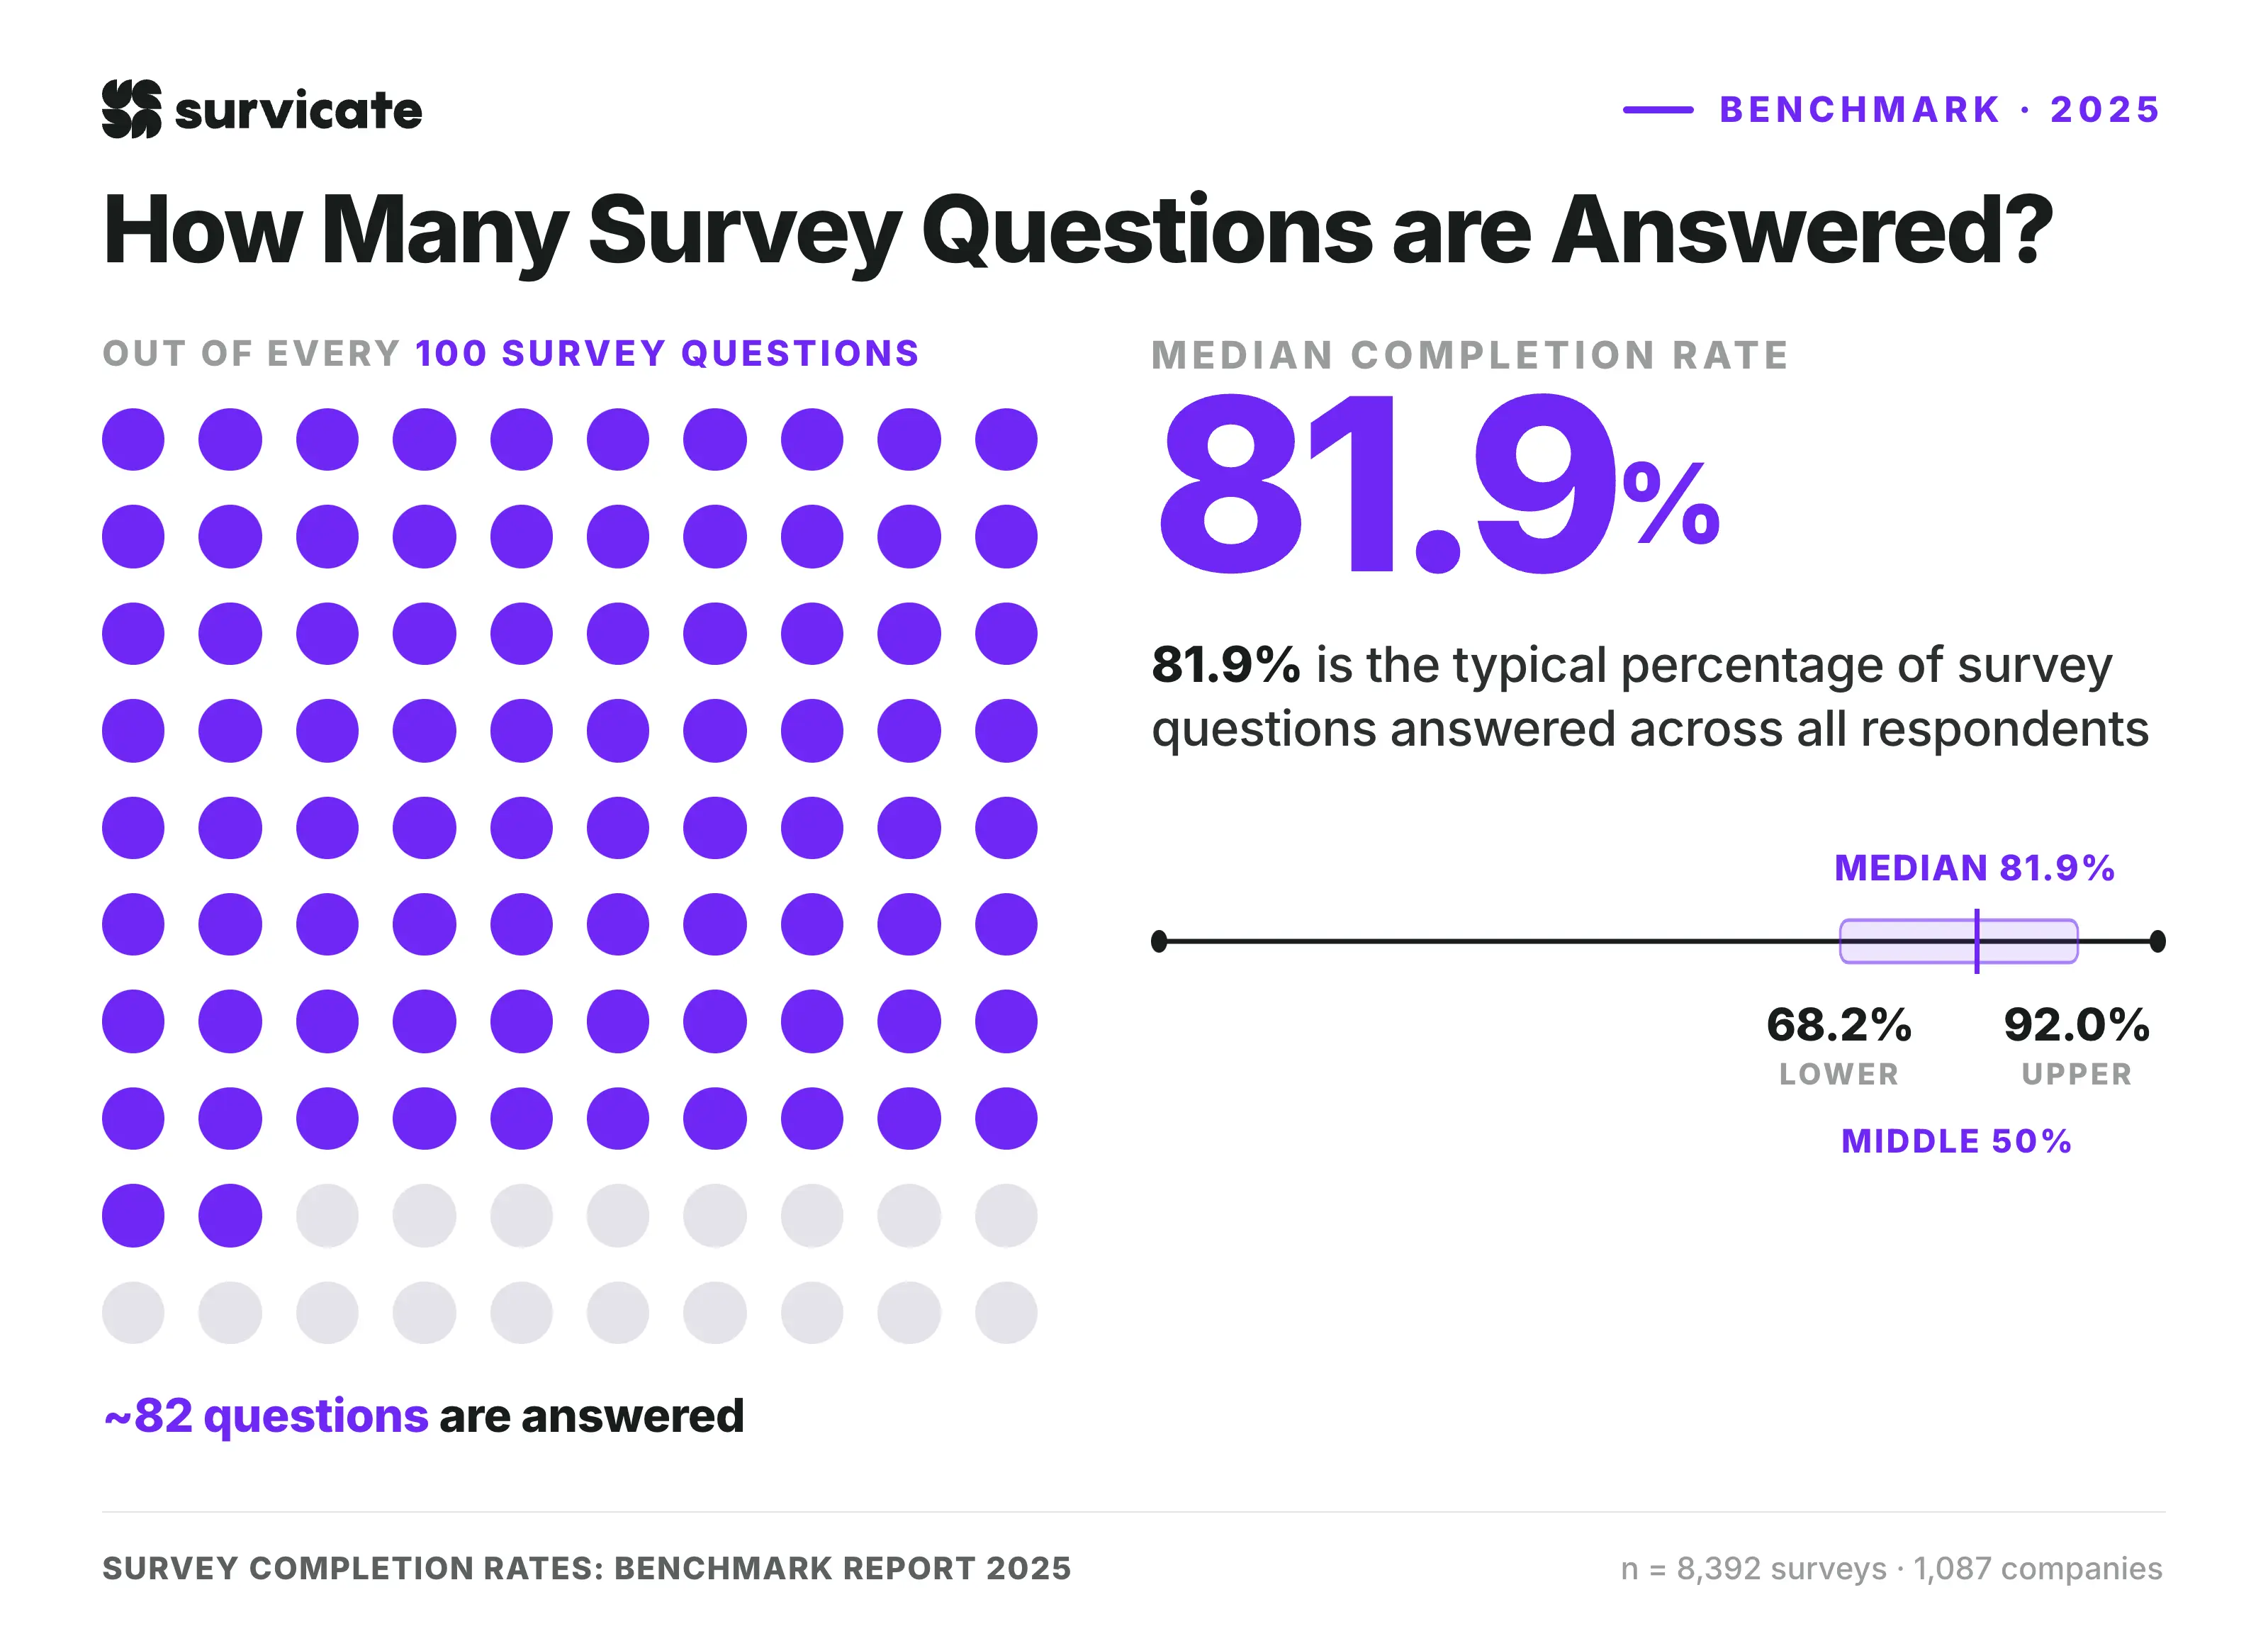
The overall median completion rate across the dataset is 81.9%, with a 25th percentile of 68.2% and a 75th percentile of 92.0%.
On their own, these numbers provide a baseline, but do not fully explain how completion rates vary. The differences become clearer when looking at how completion rates change across survey format, length, and delivery context.
Survey format: Page surveys are the clear winner
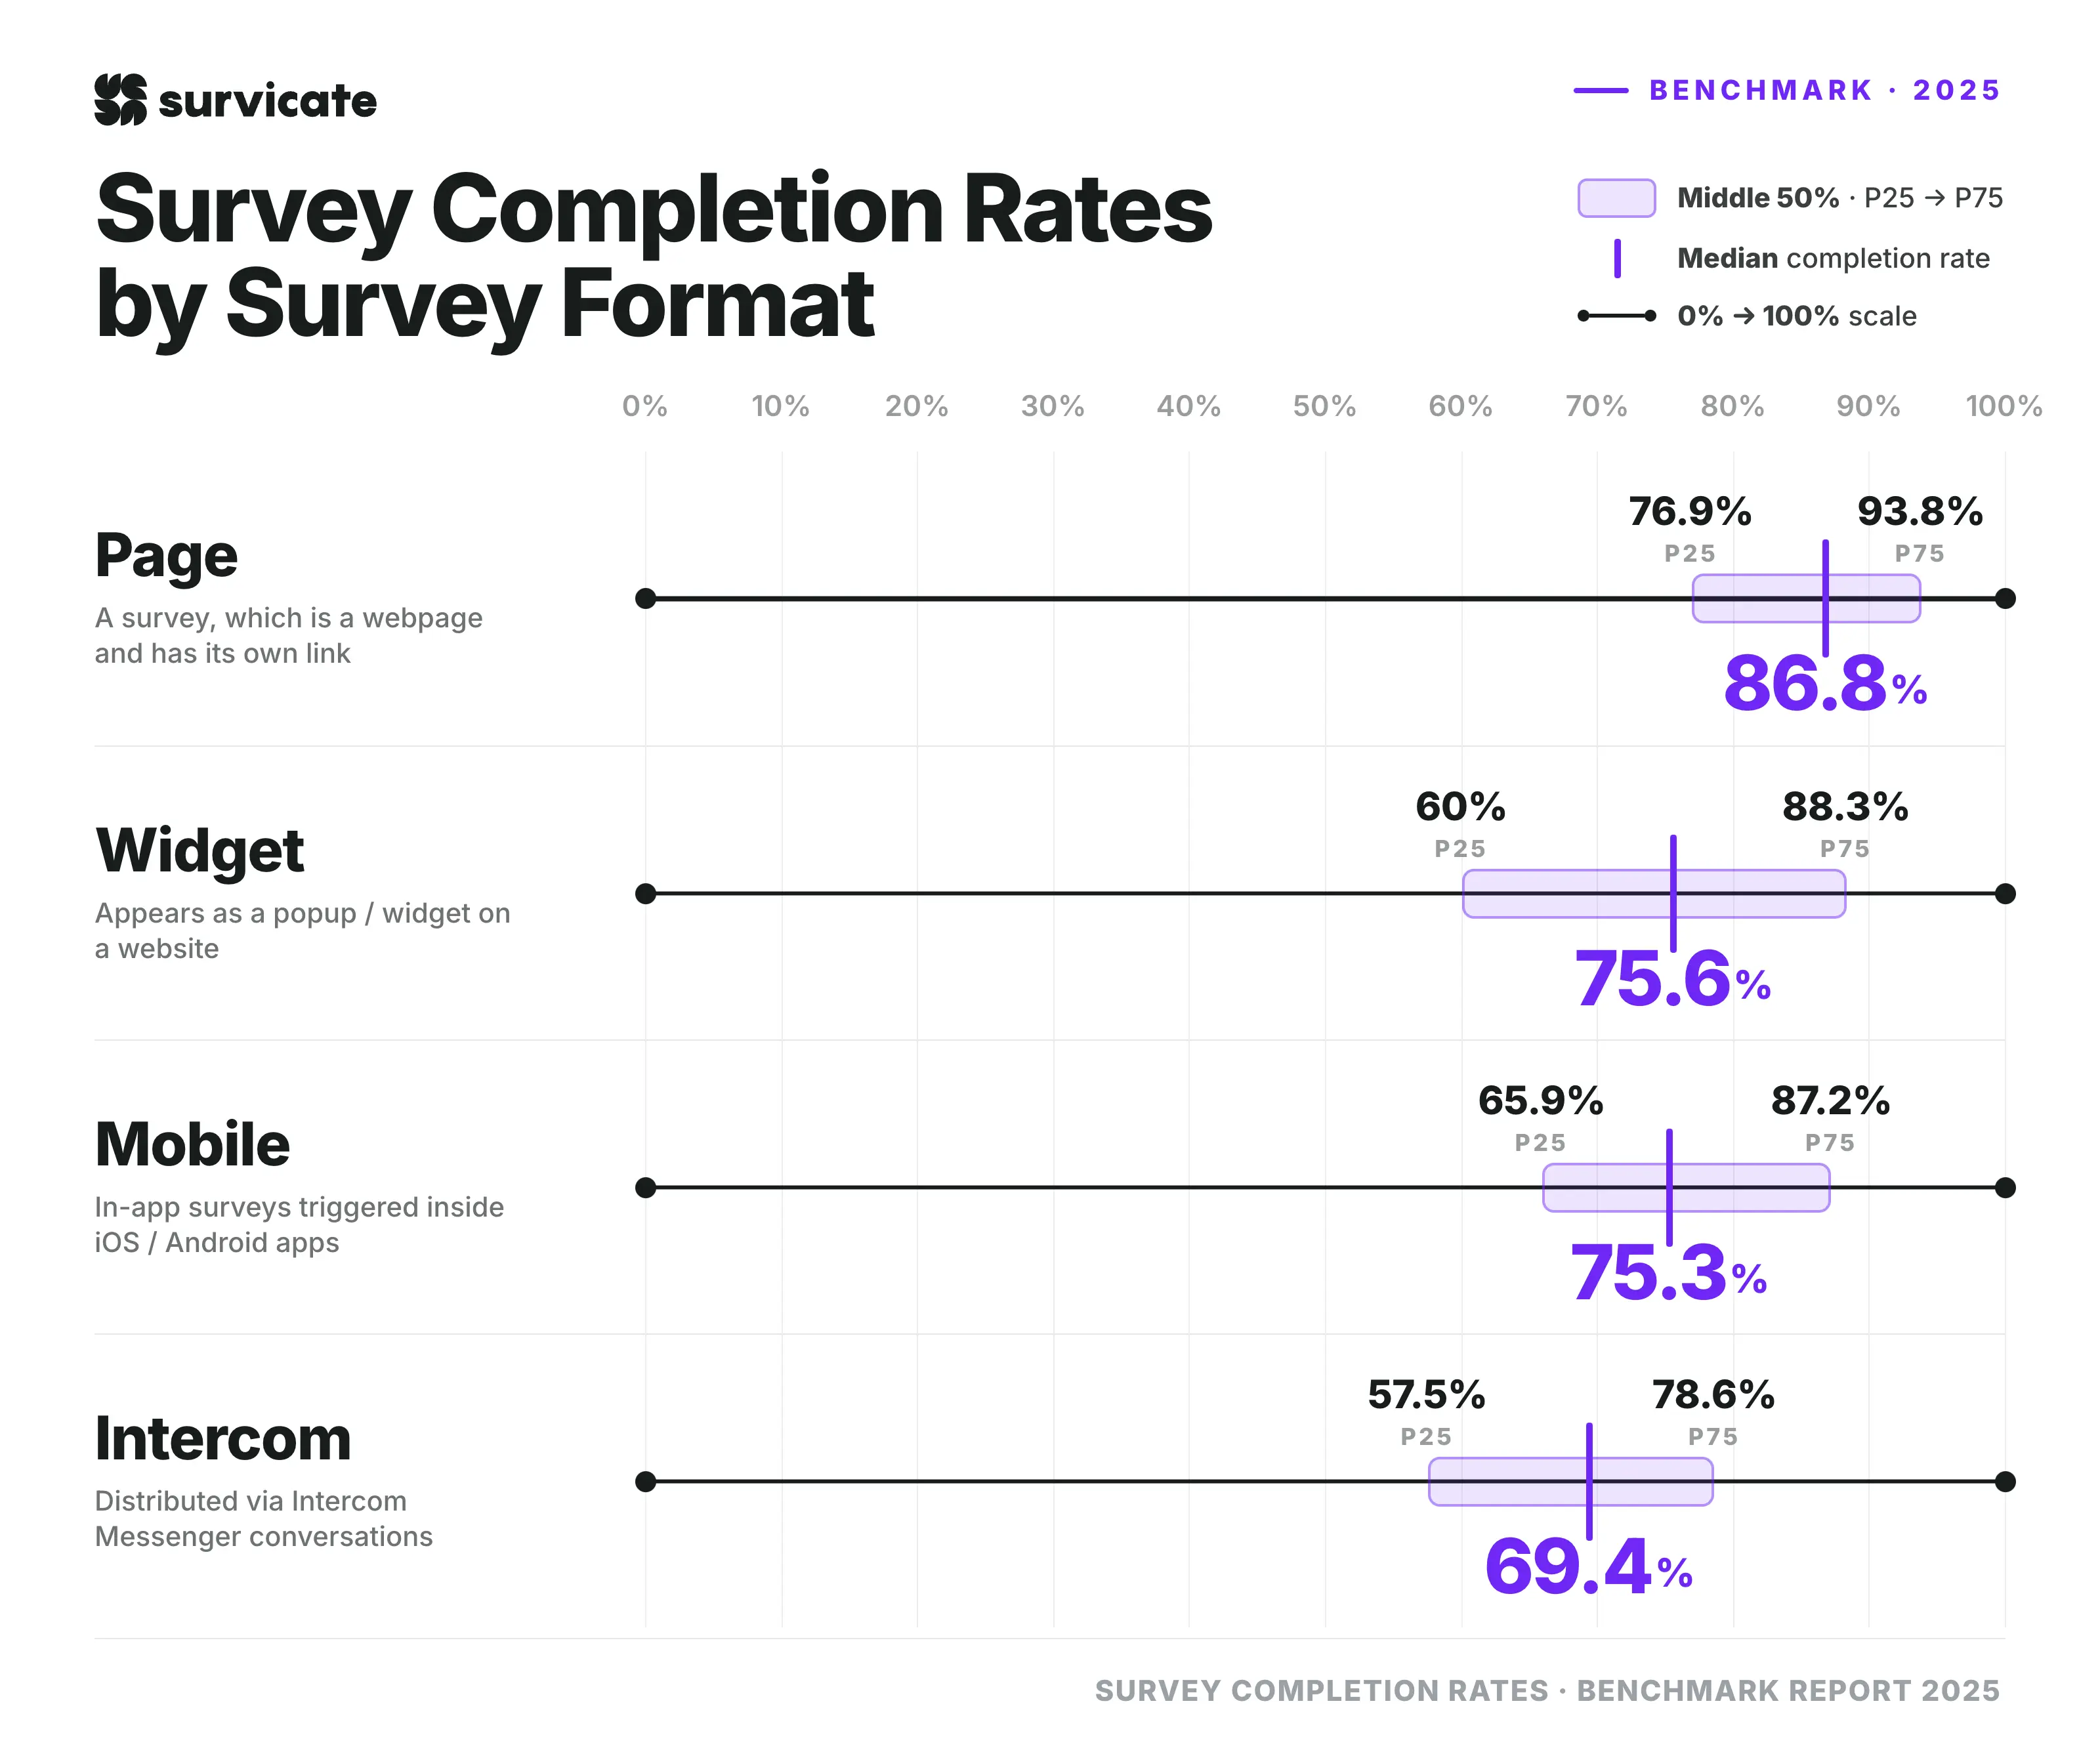
Page surveys show the highest completion rates in the dataset, with a median of 86.8%. They stand out even at the lower end of the distribution (76.9%), and outperform the average results of other formats.
Widget and mobile surveys see similar levels, with medians of 75.6% and 75.3% respectively. While the difference between them is minimal, mobile surveys have a slightly higher lower bound (65.9% vs. 60.0%), suggesting a higher baseline level of completion.
Intercom surveys record the lowest completion rates among the formats, with a median of 69.4%. They also show the narrowest range between the 25th and 75th percentiles. This points to more consistent, though lower, completion rates compared to other channels.
Benchmarks by industry: Financial Services at the top
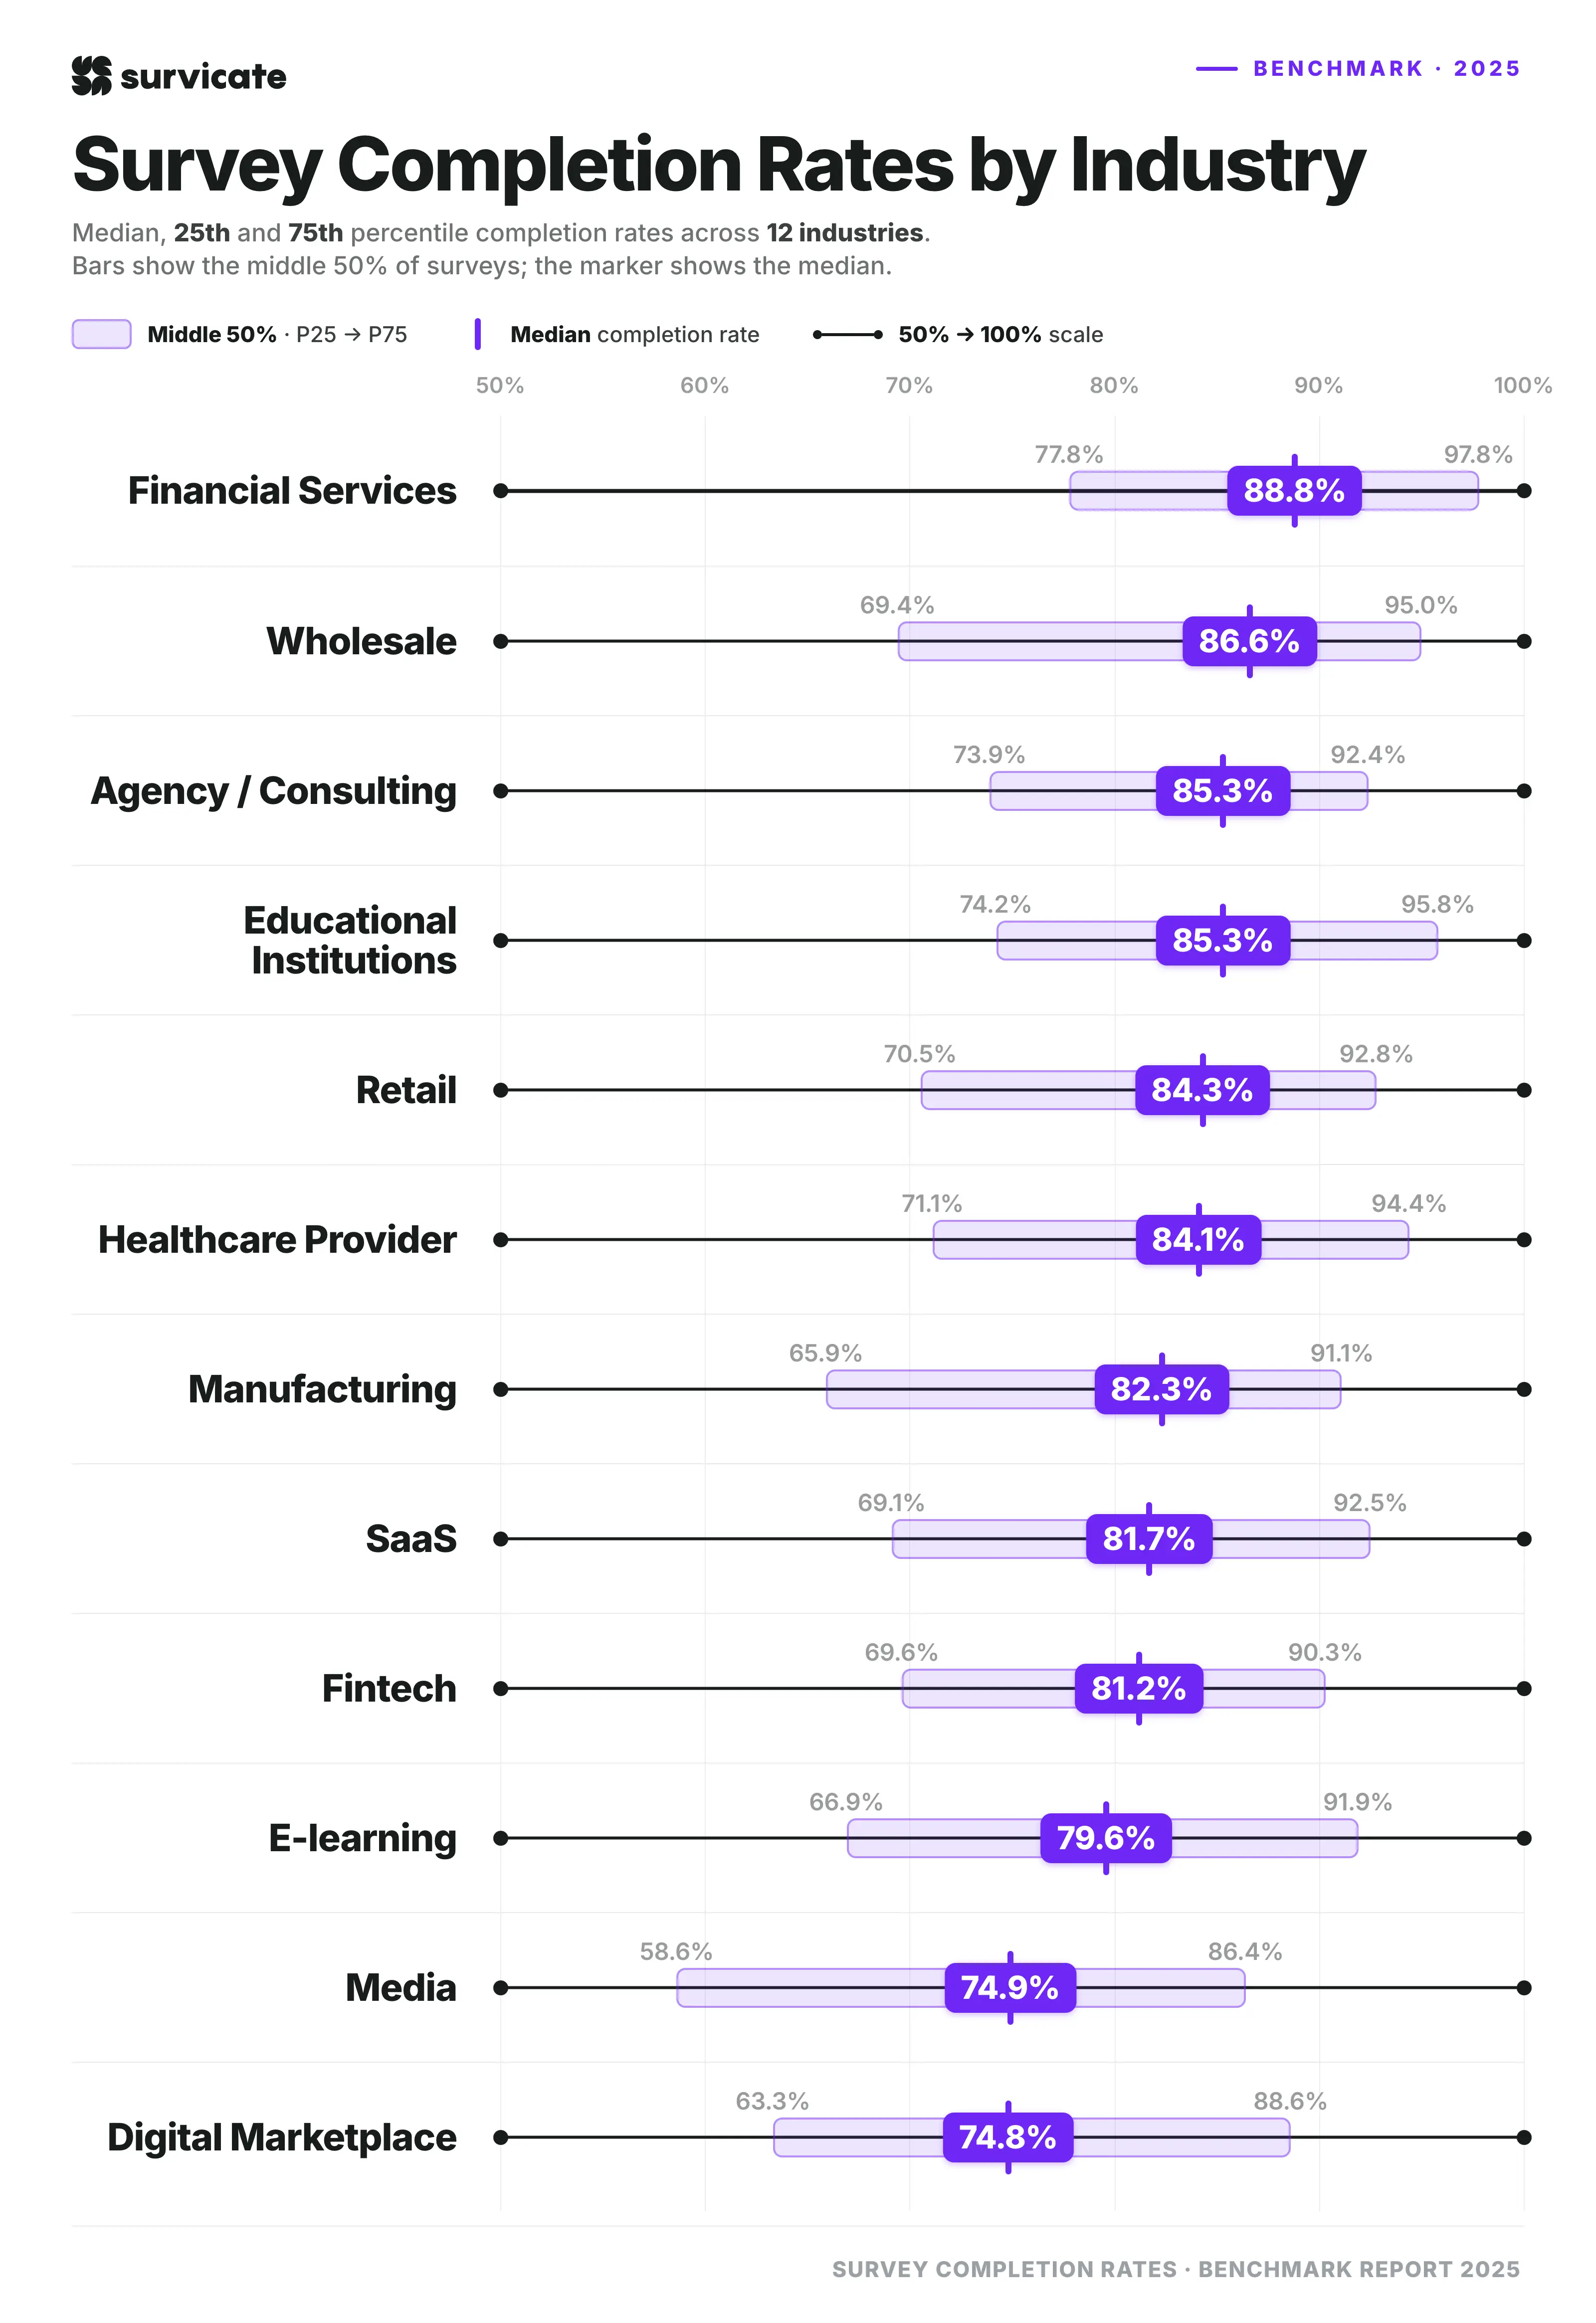
Completion rates vary across industries, though most sectors fall within a relatively narrow range. Financial Services sees the highest median completion rate at 88.8%, followed by Wholesale (86.6%) and both Agency / Consulting and Educational Institutions (85.3%).
A large group of industries cluster in the low-to-mid 80% range, including Retail (84.3%), Healthcare Providers (84.1%), Manufacturing (82.3%), SaaS (81.7%), and Fintech (81.2%).
These results sit close to the overall benchmark, with similar distributions across the middle 50% of surveys.
Lower completion rates are observed in E-learning (79.6%), Media (74.9%), and Digital Marketplace (74.8%). These industries also show wider variation, particularly at the lower end of the distribution, with 25th percentiles dropping below 65% for Media and Digital Marketplace.
Important note: The companies that were originally included in this dataset (i.e., Survicate users) self-report their industries, which can create inconsistencies and fragmentation in the data. To guarantee that we’re looking at reliable benchmarks, we used separate, external data enrichment based on customer business activity. This allowed us to report stable and comparable median and percentile results.
Benchmark by question count: Highest completion in short surveys
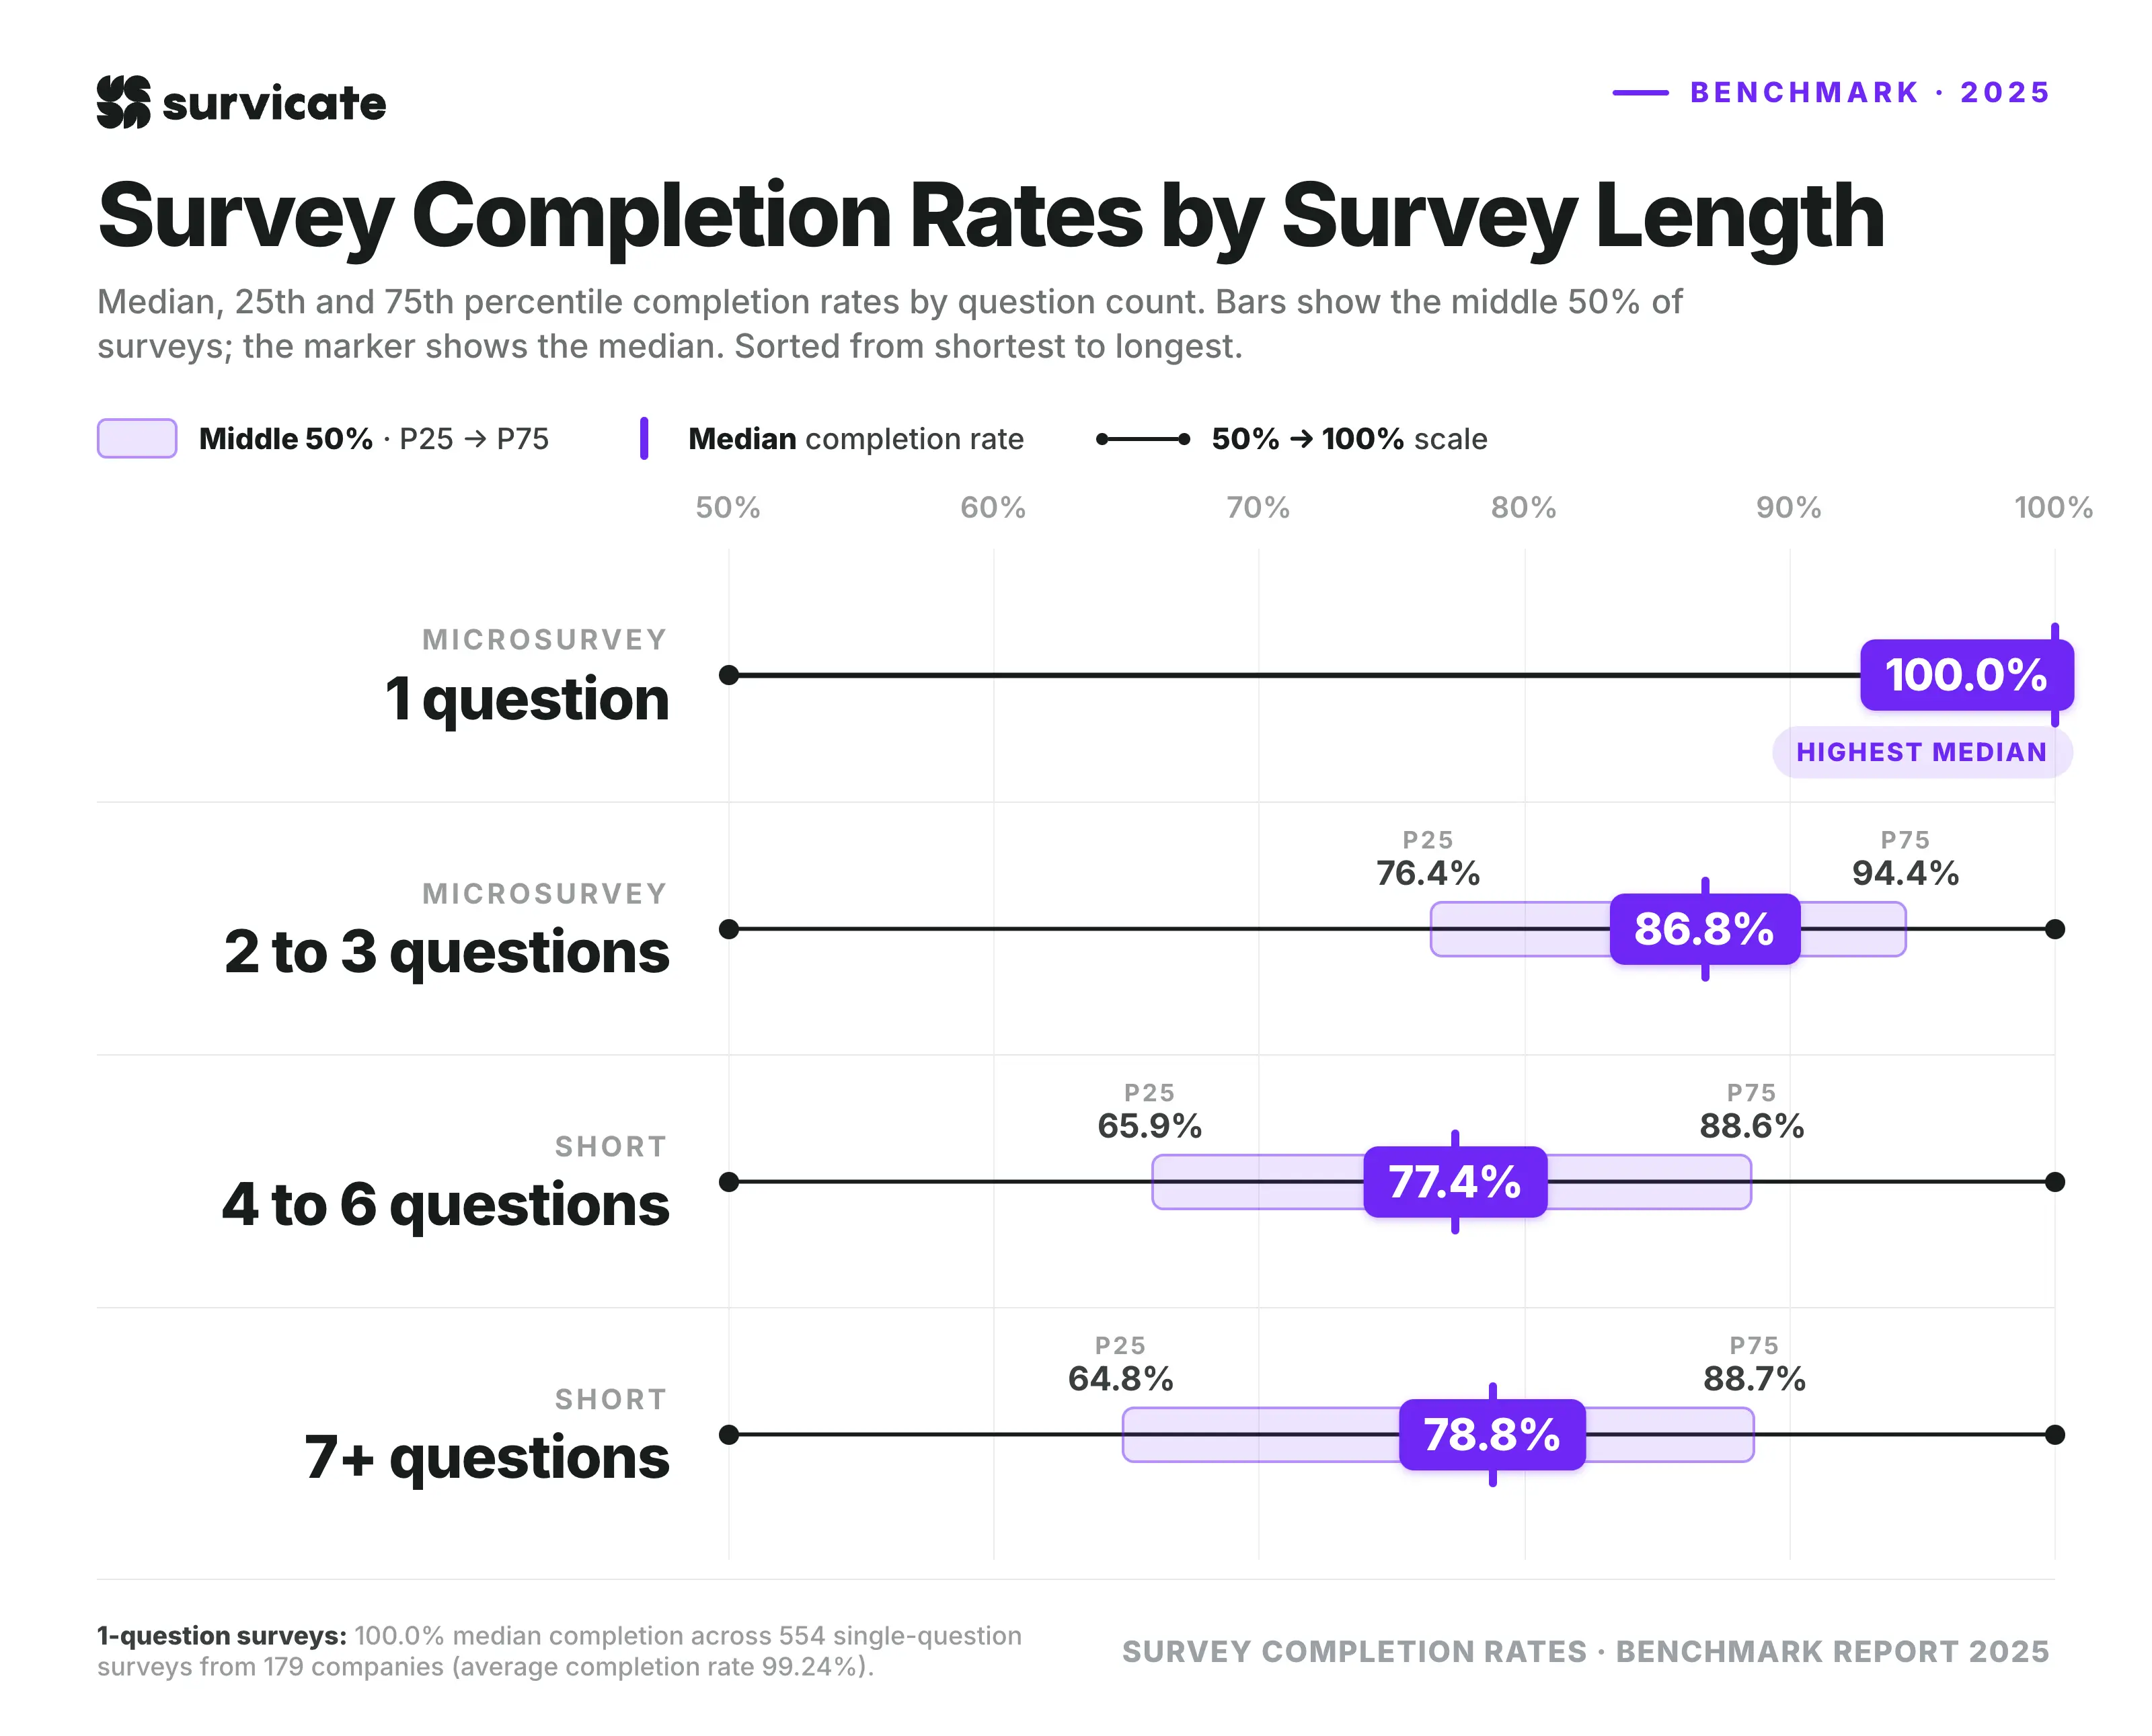
Completion rates vary by survey length, with the highest results observed in shorter surveys. Microsurveys with 2-3 questions reached a median completion rate of 86.8%, compared to 77.4% for 4-6 questions, marking the largest drop in completion across the range.
Importantly, for surveys with 7 or more questions, the median completion rate increases slightly to 78.8%. This shows a non-linear pattern, where completion rates peak for short surveys, drop most noticeably at mid-length (4-6 questions), and then show a modest uptick for longer surveys.
That said, one-question surveys are a special case. Because respondents either complete the survey immediately or abandon it, the median naturally reaches 100% across all percentiles. For additional context, there were 554 surveys from 179 companies which gathered 30 or more responses, so they qualified for the analysis.
Benchmark by business model: Minimal differences
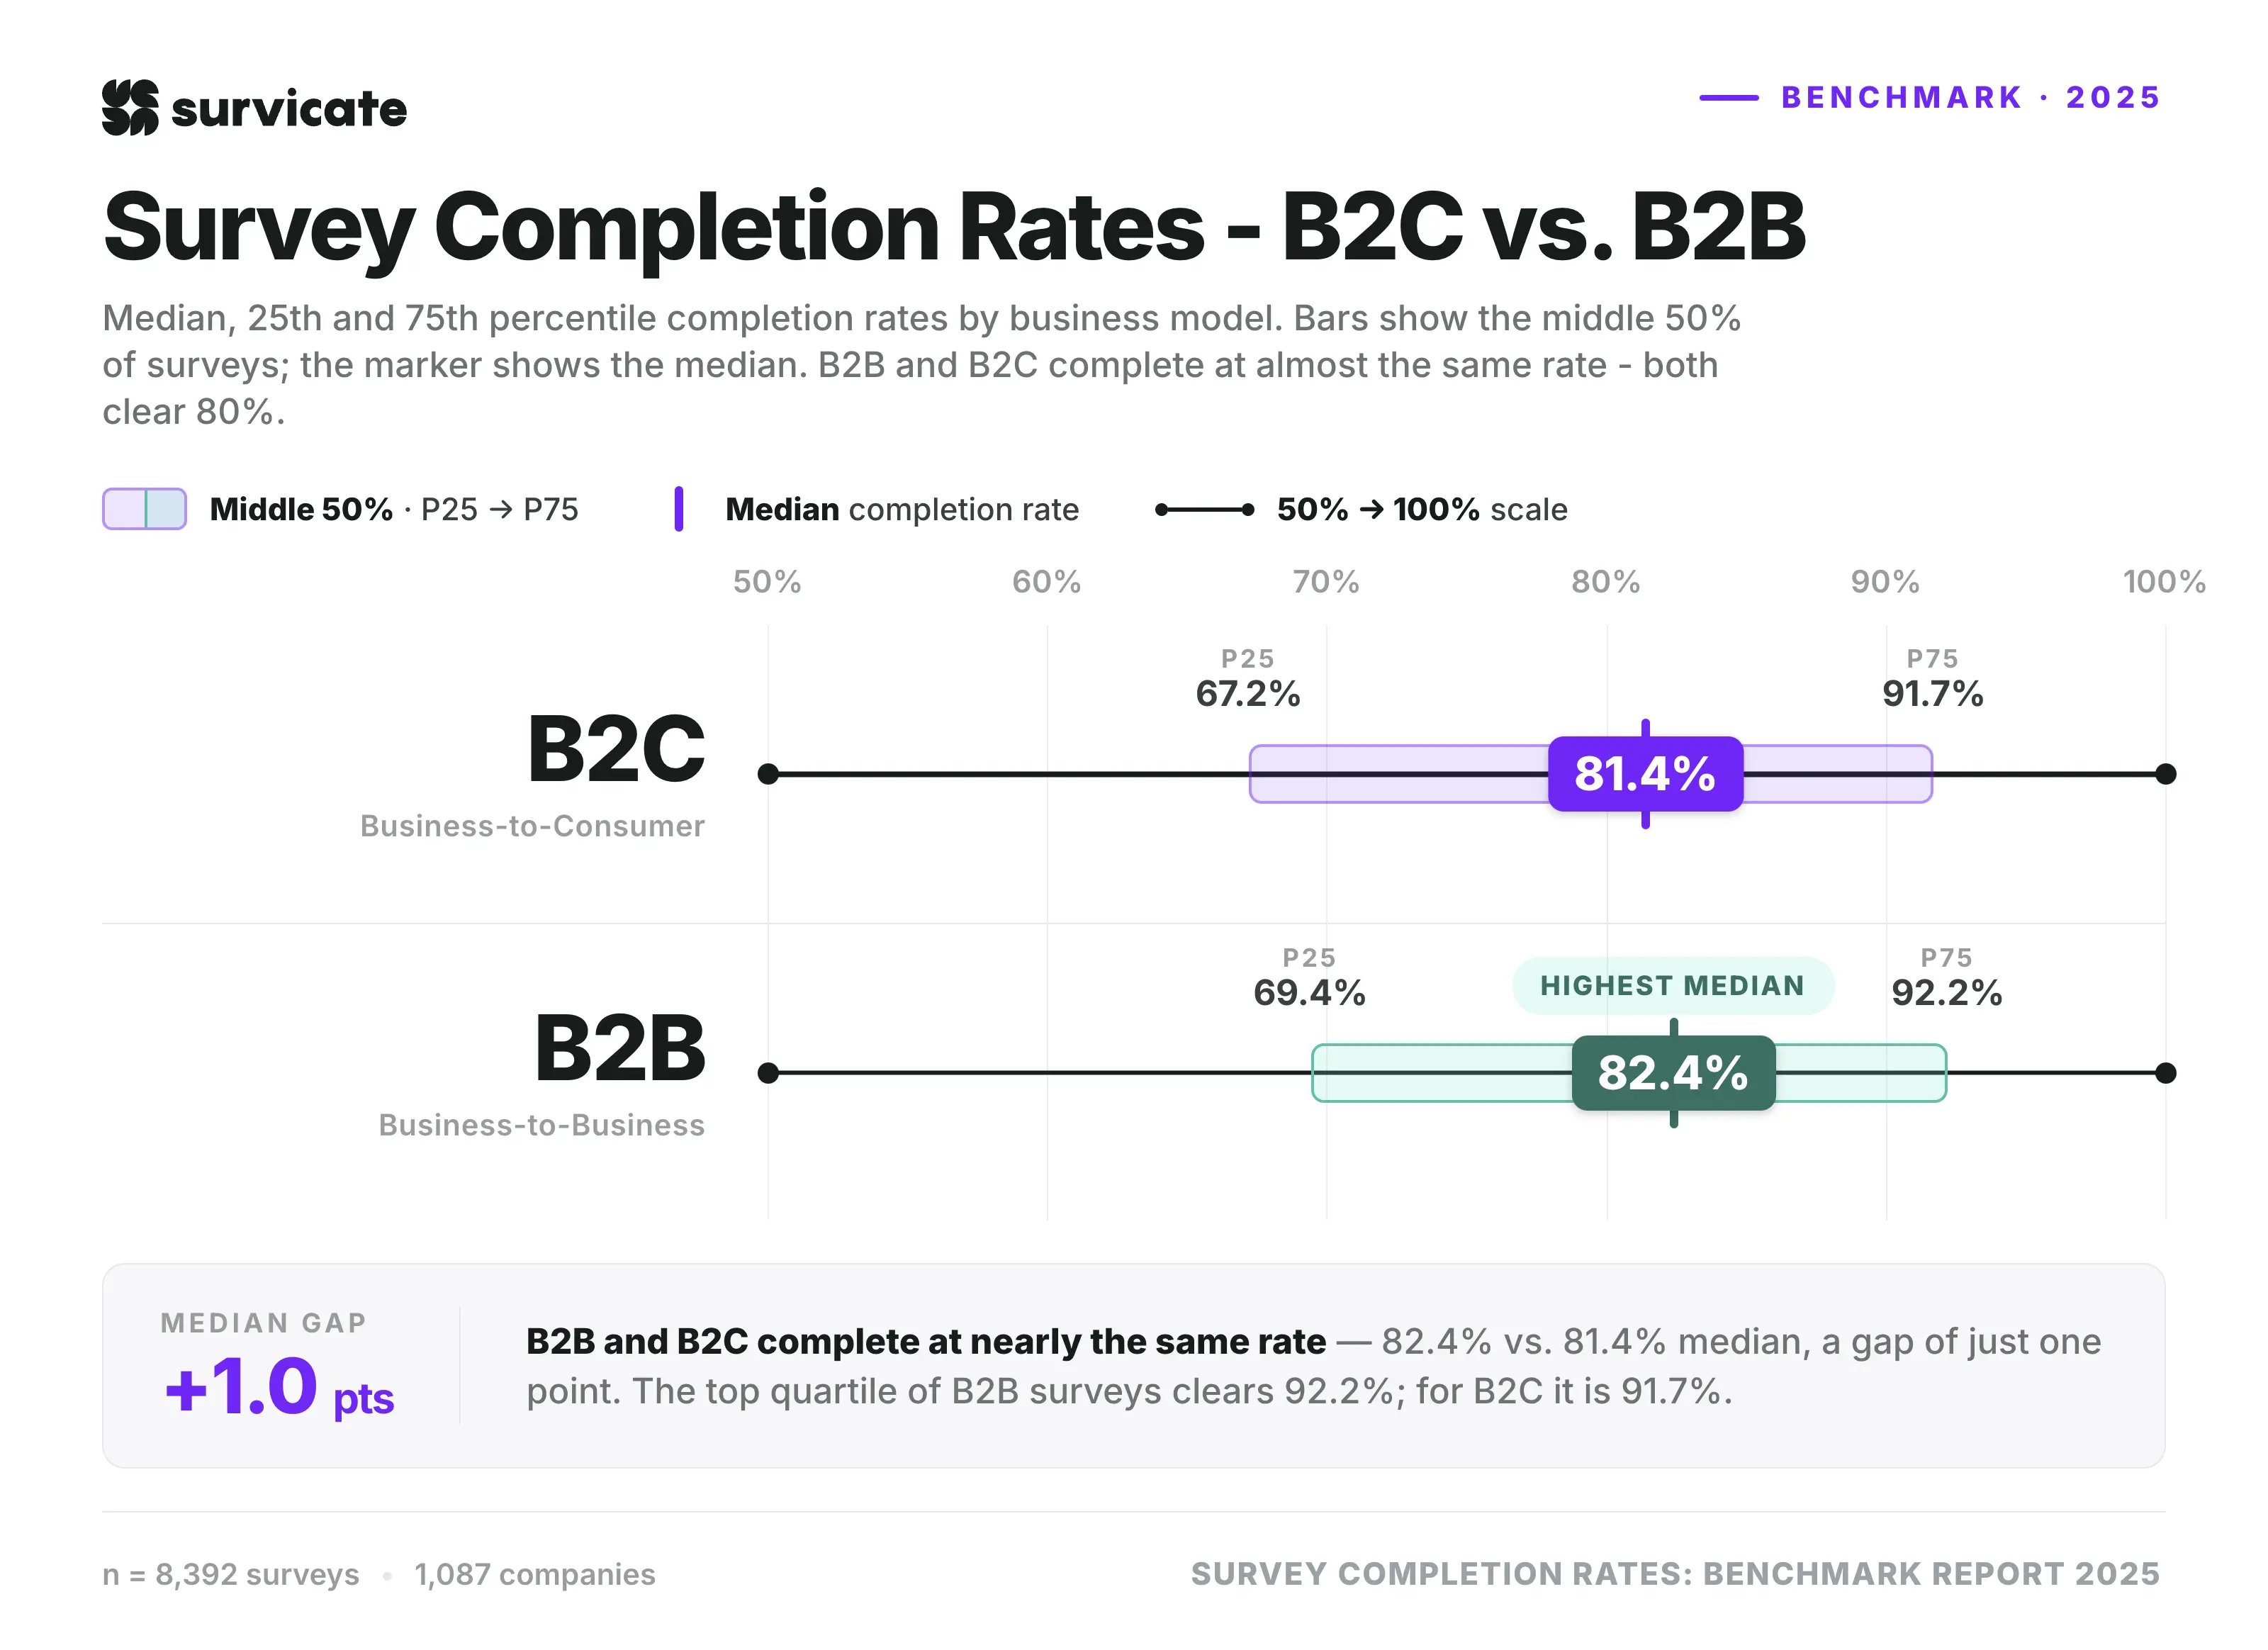
Completion rates are similar across business models, with B2B surveys reaching a median of 82.4% and B2C surveys at 81.4%. The middle 50% of results also overlaps closely, ranging from 69.4% to 92.2% for B2B and from 67.2% to 91.7% for B2C.
While B2B surveys show a slightly higher median, the difference is small and consistent across the distribution, indicating that completion rates are broadly comparable between the two models.
Note: In a separate benchmark report on survey response rates, B2C surveys showed significantly higher response rates than B2B (36.67% vs. 21.88%). Taken together, these results tell us that while B2C surveys tend to attract more respondents, completion rates among those who start a survey remain similar across both business models.
How completion rates vary across combined factors
Combined breakdowns show how completion rates change when multiple factors interact. We analyzed combinations such as format and business model, format and question count, and question count and business model, where sample sizes supported reliable results.
1. Format × Business Model: Page surveys lead across both B2B and B2C
Our data reveals that completion rates vary more by survey format than by business model. Across both B2B and B2C, page surveys show the highest completion rates, with medians of 86.0% and 87.7% respectively, and consistently strong performance across the middle 50% of results.
Below page surveys, the ranking differs slightly between business models. In B2B, widget surveys show the second-highest median (79.0%), followed by mobile and Intercom. In B2C, mobile surveys rank second (with 75.0%), followed by Intercom, while widget surveys have the lowest median completion rate.
Overall, differences between B2B and B2C remain smaller than the variation across formats.
2. Question Count × Format: completion declines consistently as surveys get longer
To show how survey length affects each format, we decided to break this section down into two parts. The first table shows a summary of median completion rates across formats and question counts for a quick comparison.
Next, there’s a detailed breakdown for each question count, including 25th and 75th percentiles to show how results vary within each group.
Across all formats, microsurveys (2-3 questions) achieve the highest completion rates. Page surveys lead in every group, reaching 92.4% for short surveys and remaining above 84% even for longer surveys.
The largest drop in completion occurs between 2-3 and 4-6 questions across all formats. This decline is most pronounced in widget and mobile surveys, where median completion rates fall more sharply compared to page surveys.
For surveys with 7 or more questions, completion rates decline further across all formats. This differs from the overall question count benchmark, where a slight uptick appears for 7+ questions. This shows that the pattern observed in the overall data does not hold when results are broken down by format.
Looking at the breakdown by format, it’s worth noticing that page surveys remain relatively stable when moving from 4-6 to 7+ questions, while the largest drops appear in other formats, particularly widget and mobile surveys.
What we’re seeing here is that the U-shape question pattern only appears when all formats are combined. When we compare surveys within the same format, completion rates consistently decrease as surveys get longer.
3. Question Count × Business Model: similar patterns across B2B and B2C
Differences between B2B and B2C are minimal across all question counts.
Completion rates drop from short to mid-length surveys, with the largest decline occurring between 2-3 and 4-6 questions.
For surveys with 7 or more questions, median completion rates increase slightly in both B2B and B2C (more noticeably in B2C) though they remain below the levels observed for shorter surveys.
This is also where the U-shaped pattern for surveys with 7 or more questions reappears.
Survey format drives most variation in completion rates
When you think about survey completion, it's worth remembering that it’s about how much insights you're able to capture from surveys, and not solely how many people finish the survey. What stands out in this analysis, is how much survey design matters – the format you choose and how long your survey is can make a real difference in how far respondents get.
To get the most out of your survey data, you should be able to capture responses even when surveys aren't fully completed. Survicate saves answers as respondents progress from question to question, so you don't lose valuable input even if someone drops off or gets interrupted. This means more insights from every respondent, not just the ones who reach the end.
Try Survicate for free to start capturing more complete insights from your surveys.
Frequently Asked Questions
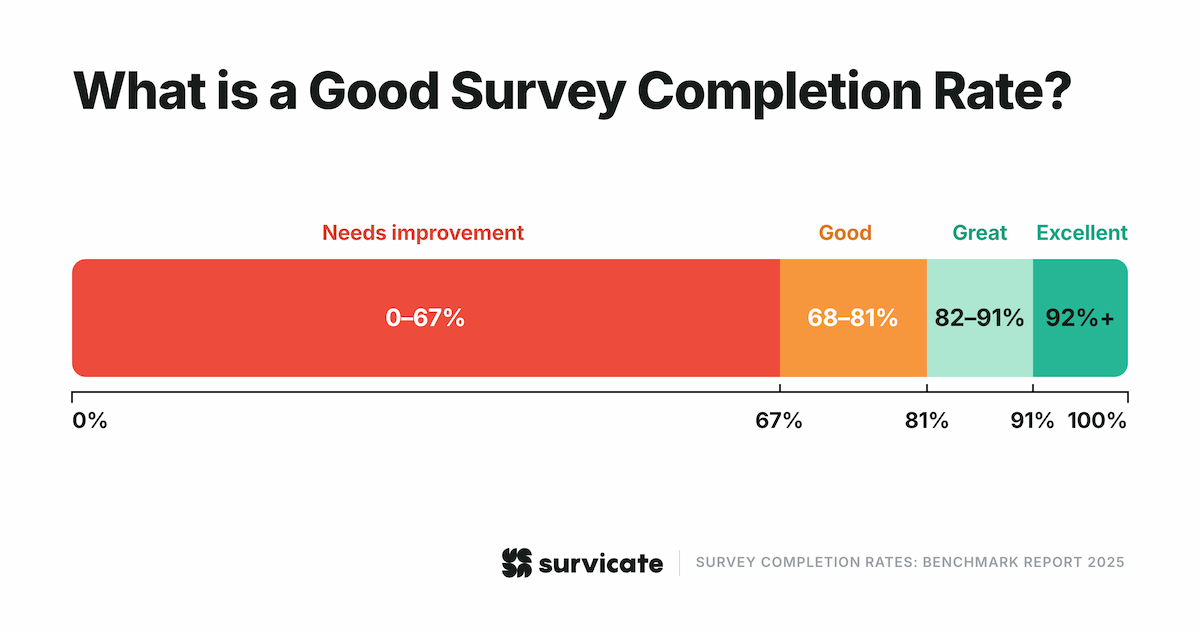
What is a good completion rate for a survey?
A good survey completion rate is typically around or above 80%. In this dataset, the overall median completion rate is 81.9%, meaning half of all surveys perform at or above this level.
The middle 50% of results falls between 68.2% and 92.0%, showing that online survey completion rates can vary depending on survey design and context. Benchmarks are most meaningful when compared within similar formats, lengths, or industries.
What is the average completion rate for an online survey?
The average completion rate for an online survey varies. However, in this report we use medians instead of averages, as they provide a more reliable benchmark. Averages can be skewed by unusually high or low results, while the median reflects the midpoint of all surveys and better represents typical performance. The overall median completion rate across the dataset is 81.9%, meaning half of all surveys achieve completion rates above this level.
How do I calculate survey completion rate?
Survey completion rate is calculated as the average percentage of questions answered by respondents. For example, if a survey has 10 questions and respondents answer an average of 8, the completion rate is 80%. This metric reflects how far respondents progress through a survey rather than how many start it. It is therefore different from response rate, which measures participation rather than completion.
What counts as a "complete" in Survicate?
In Survicate, a response is counted once a respondent answers at least one question or starts the survey from a welcome screen. Completion rate is then calculated based on how many questions that respondent answers on average. This means a survey does not need to be fully completed to count toward the metric. Instead, it captures partial progress across all respondents.