


Popup surveys spark endless debate. When used poorly, they feel intrusive and disrupt the experience. But when used right, they deliver incredible insights.
The trouble is, most teams have no idea if their performance is actually good or bad. Without real benchmarks, it's hard to tell whether a 5% response rate is a huge win or a sign to rethink the setup.
To cut through the guesswork, we analyzed thousands of real customer surveys to build a clear, data-backed answer on what an ideal configuration looks like. We looked directly at what drives responses and completions in practice, and the findings might surprise you.
Methodology
This report draws on popup survey data collected throughout 2025 from companies using Survicate's paid plans. The following criteria define the scope of the analysis and ensure that each benchmark is based on a sufficient amount of data:
- The dataset covers 3,029 popup surveys from 349 companies.
- In order to qualify for the analysis, each survey had to collect at least 30 responses. This requirement helped us limit the impact of very small samples on the overall benchmarks.
Here’s the breakdown we’ve used to reach the 30 response threshold:
- Industry benchmarks include only industries represented by at least 8 unique companies.
- We calculated response rates by dividing the total number of responses by the total number of popup views.
- Median response rates were rounded to one decimal place to improve readability without changing the interpretation of the results.
- We decided on showing medians and percentiles, because popup survey performance varies considerably across different companies and use cases. Unlike averages, the median reflects the typical result without being disproportionately affected by a small number of exceptionally high or low values.
Key findings
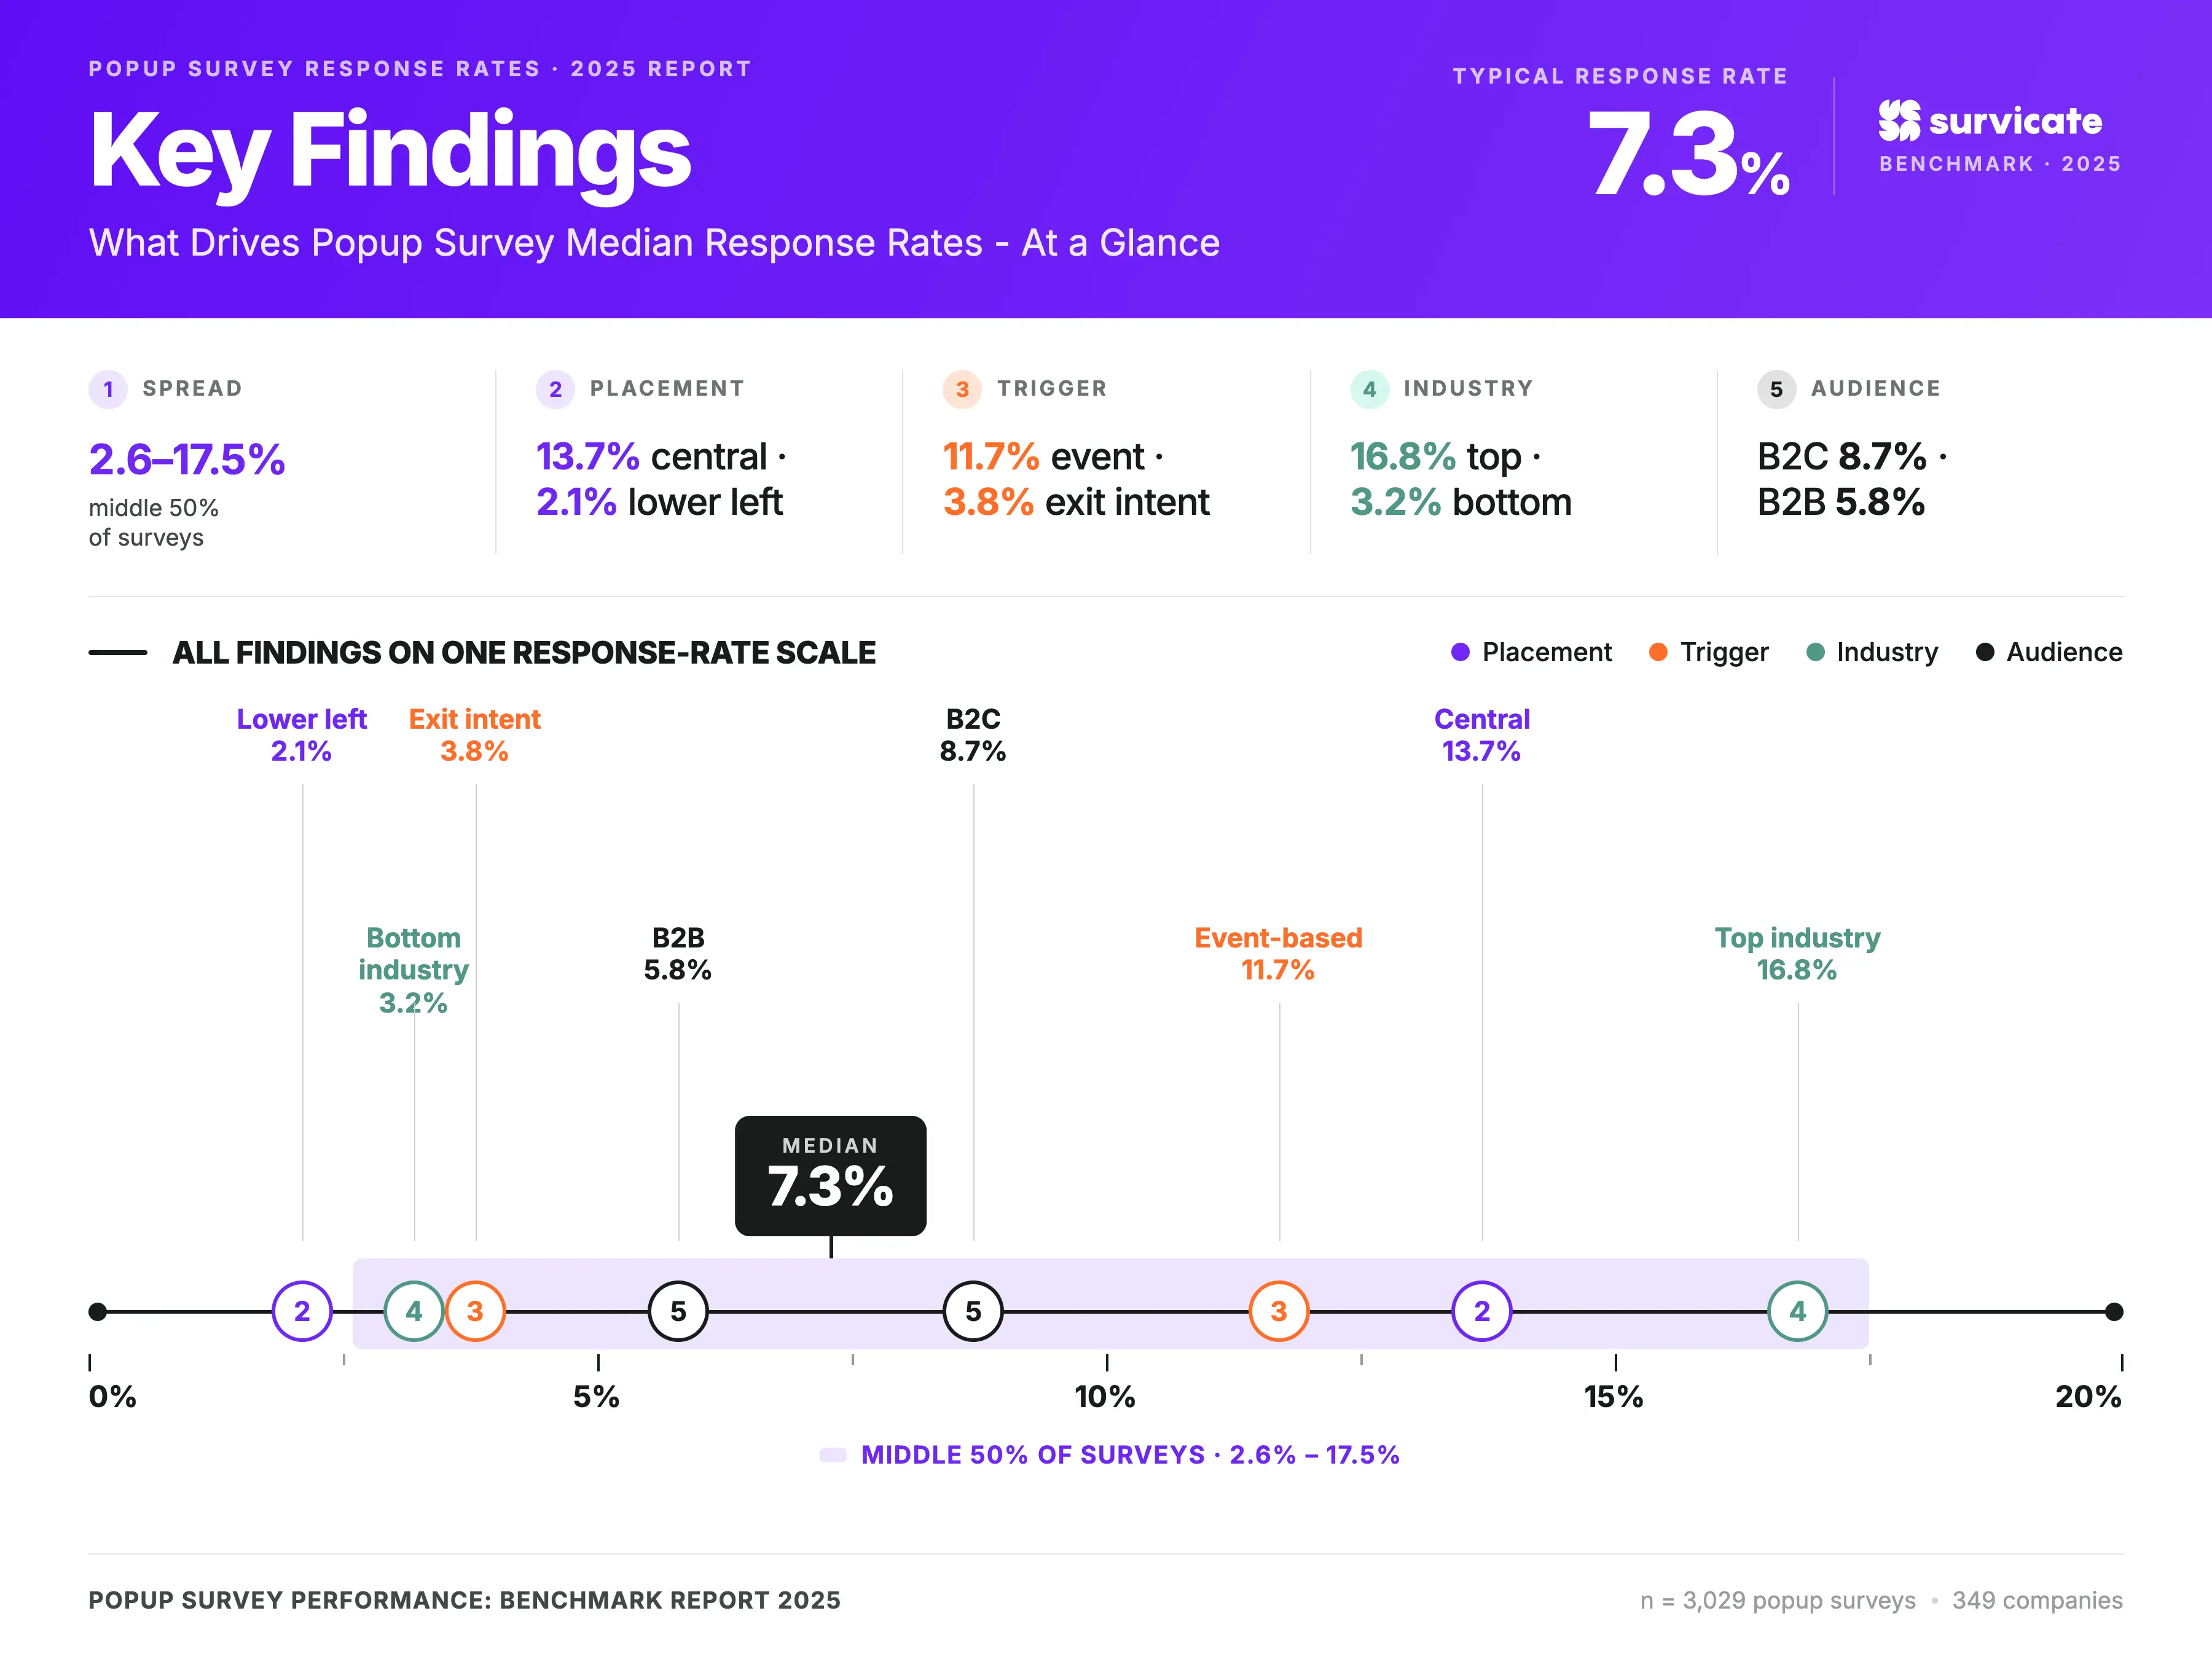
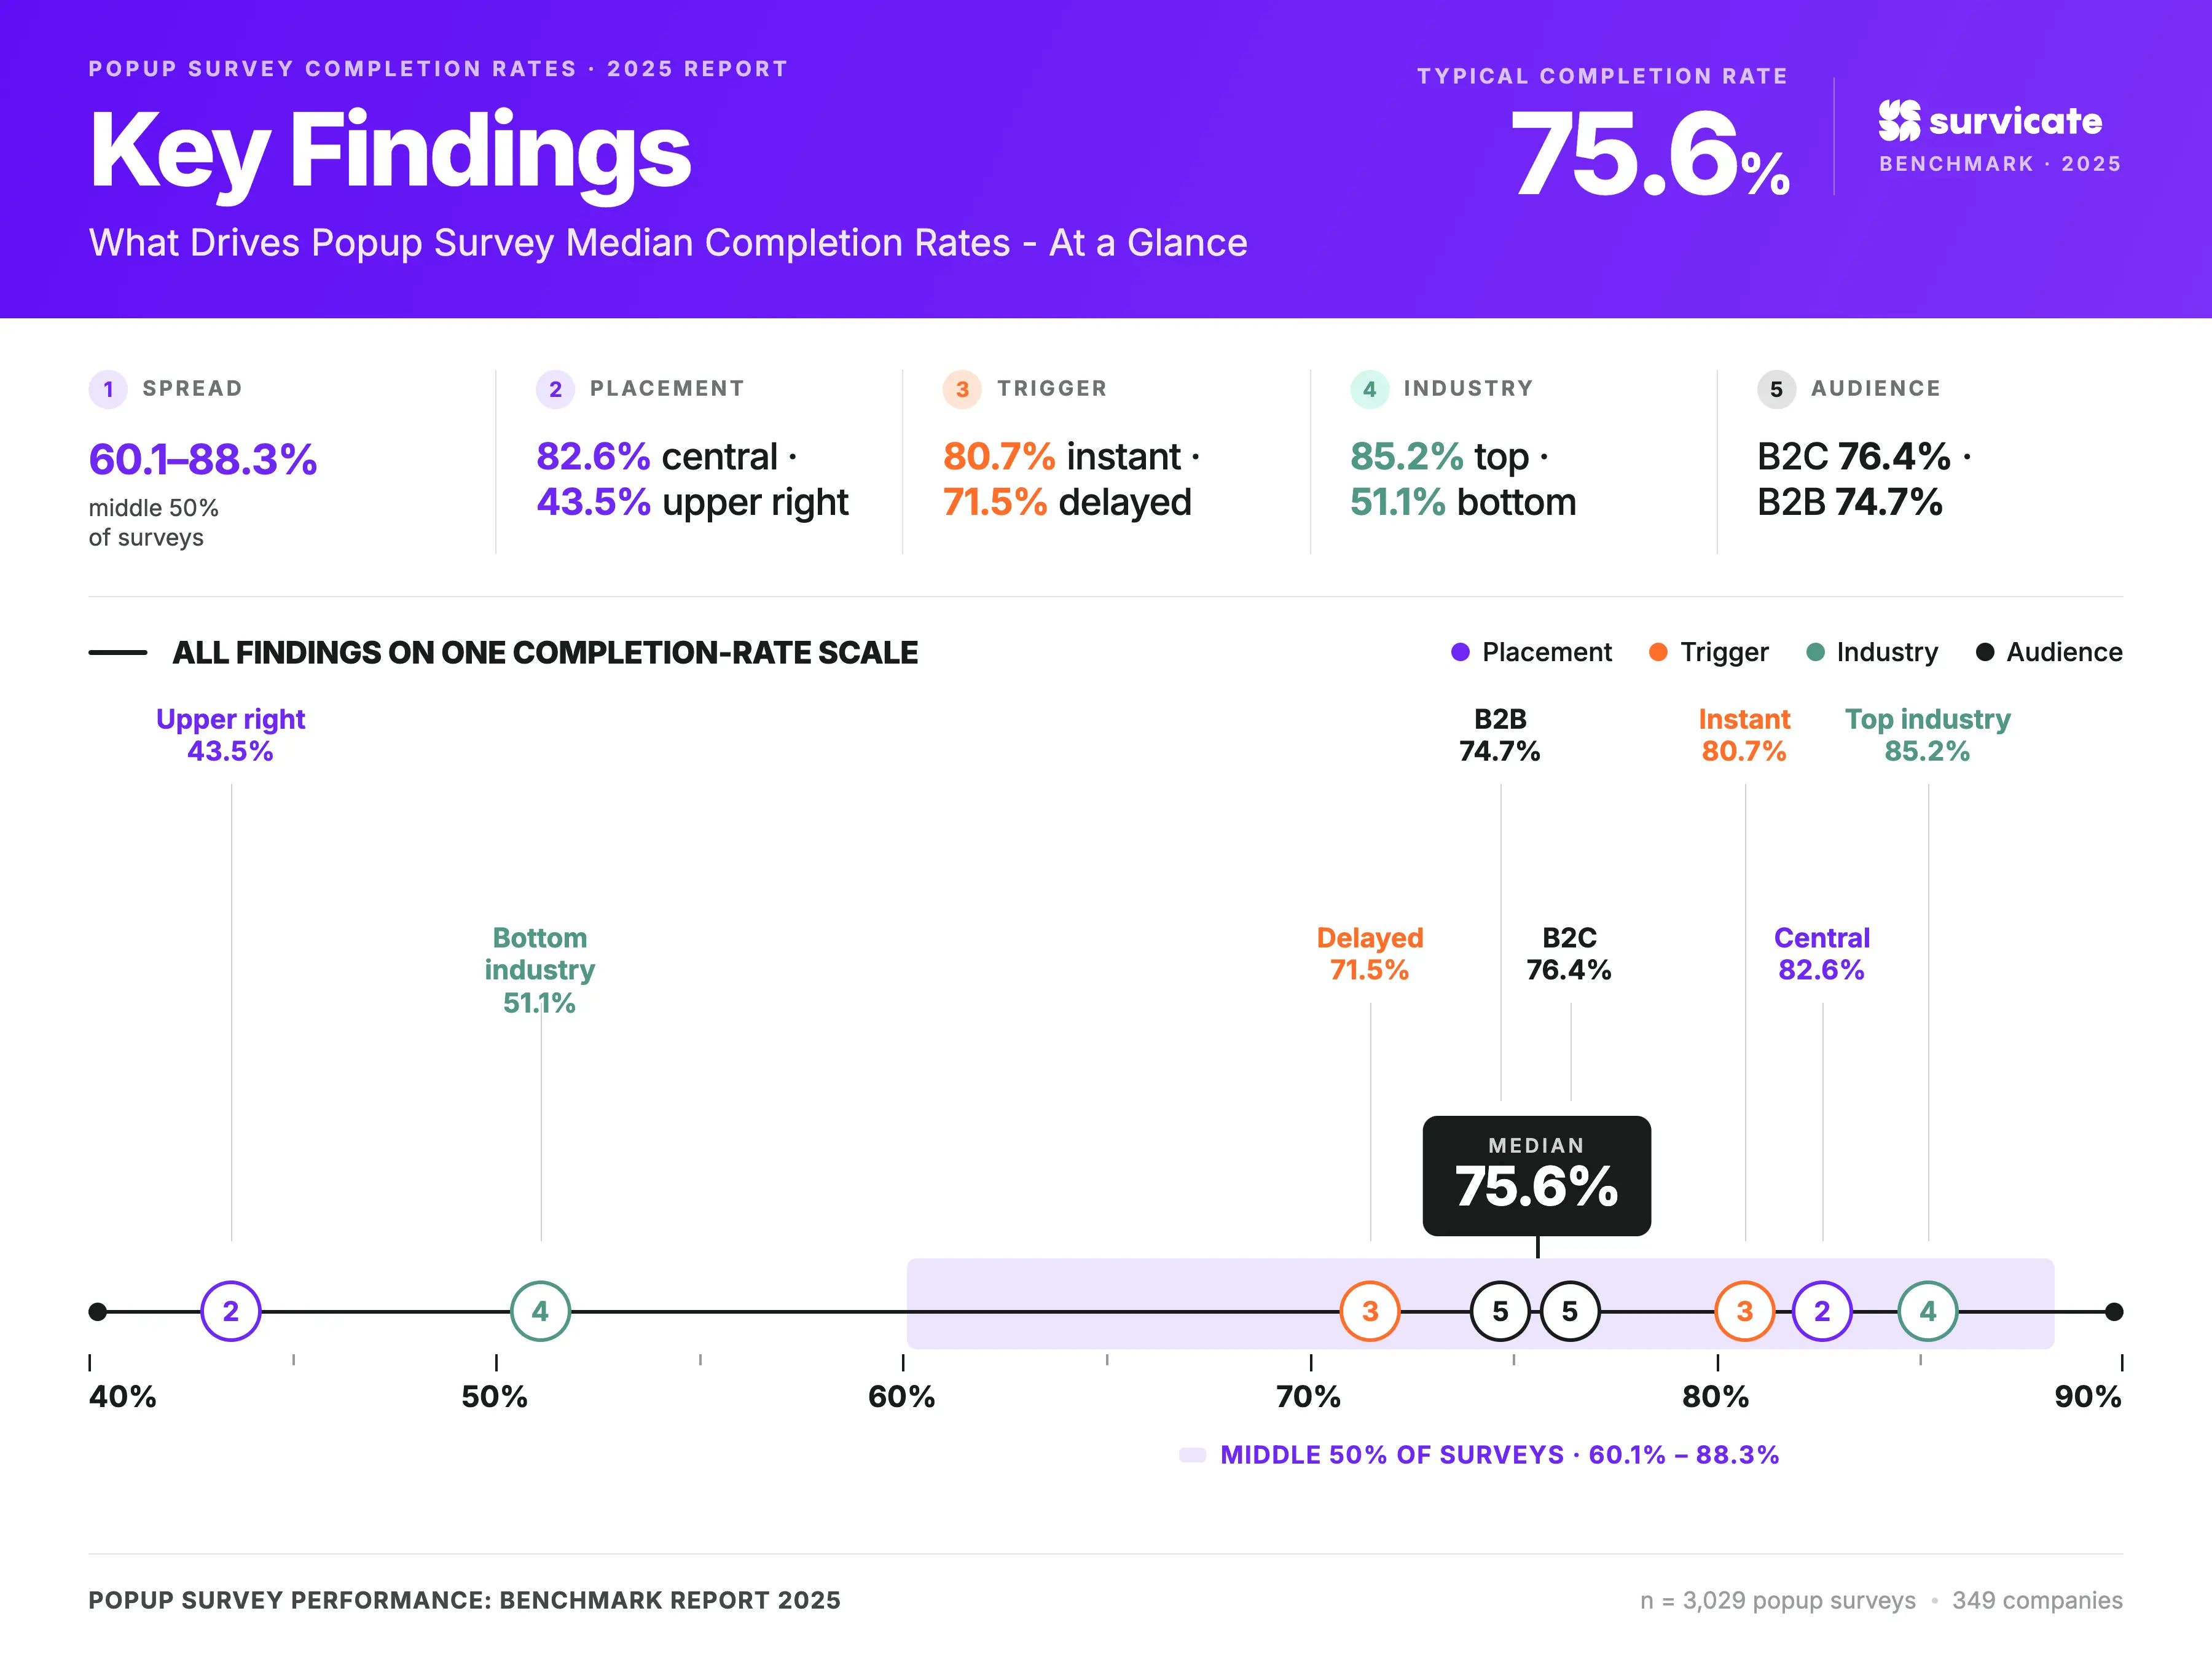
- The typical popup survey records a 7.3% response rate and a 75.6% completion rate. While response rates vary substantially between surveys, completion rates stay much more consistent. Once visitors start a popup survey, most go on to finish it.
- Central placement delivers the strongest overall performance. It reaches the highest median response rate (13.7%) and completion rate (82.6%), despite being used in fewer than one in ten surveys. Meanwhile, the lower-right corner remains the default choice, accounting for nearly 79% of all popup surveys in the dataset.
- Instant and event-based triggers generate the highest response rate. They outperform delayed, scroll, and exit-intent triggers on completion rates. Exit-intent records the lowest median response rate of all trigger types.
- B2C companies attract more responses overall, but the strongest B2B results come from central placement. Across the full dataset, B2C popup surveys achieve a median response rate of 8.7%, compared to 5.8% for B2B. At the same time, central placement produces the highest response and completion rates within the B2B segment.
- Performance differs more by industry at the response stage than after someone starts a survey. Financial services, fintech, and agencies record the highest response rates, while media and manufacturing sit at the other end of the spectrum. Completion rates remain relatively stable across most industries, suggesting the largest differences emerge before respondents begin the survey.
The overall benchmark – popup response rates vary widely, completion rates stay more consistent
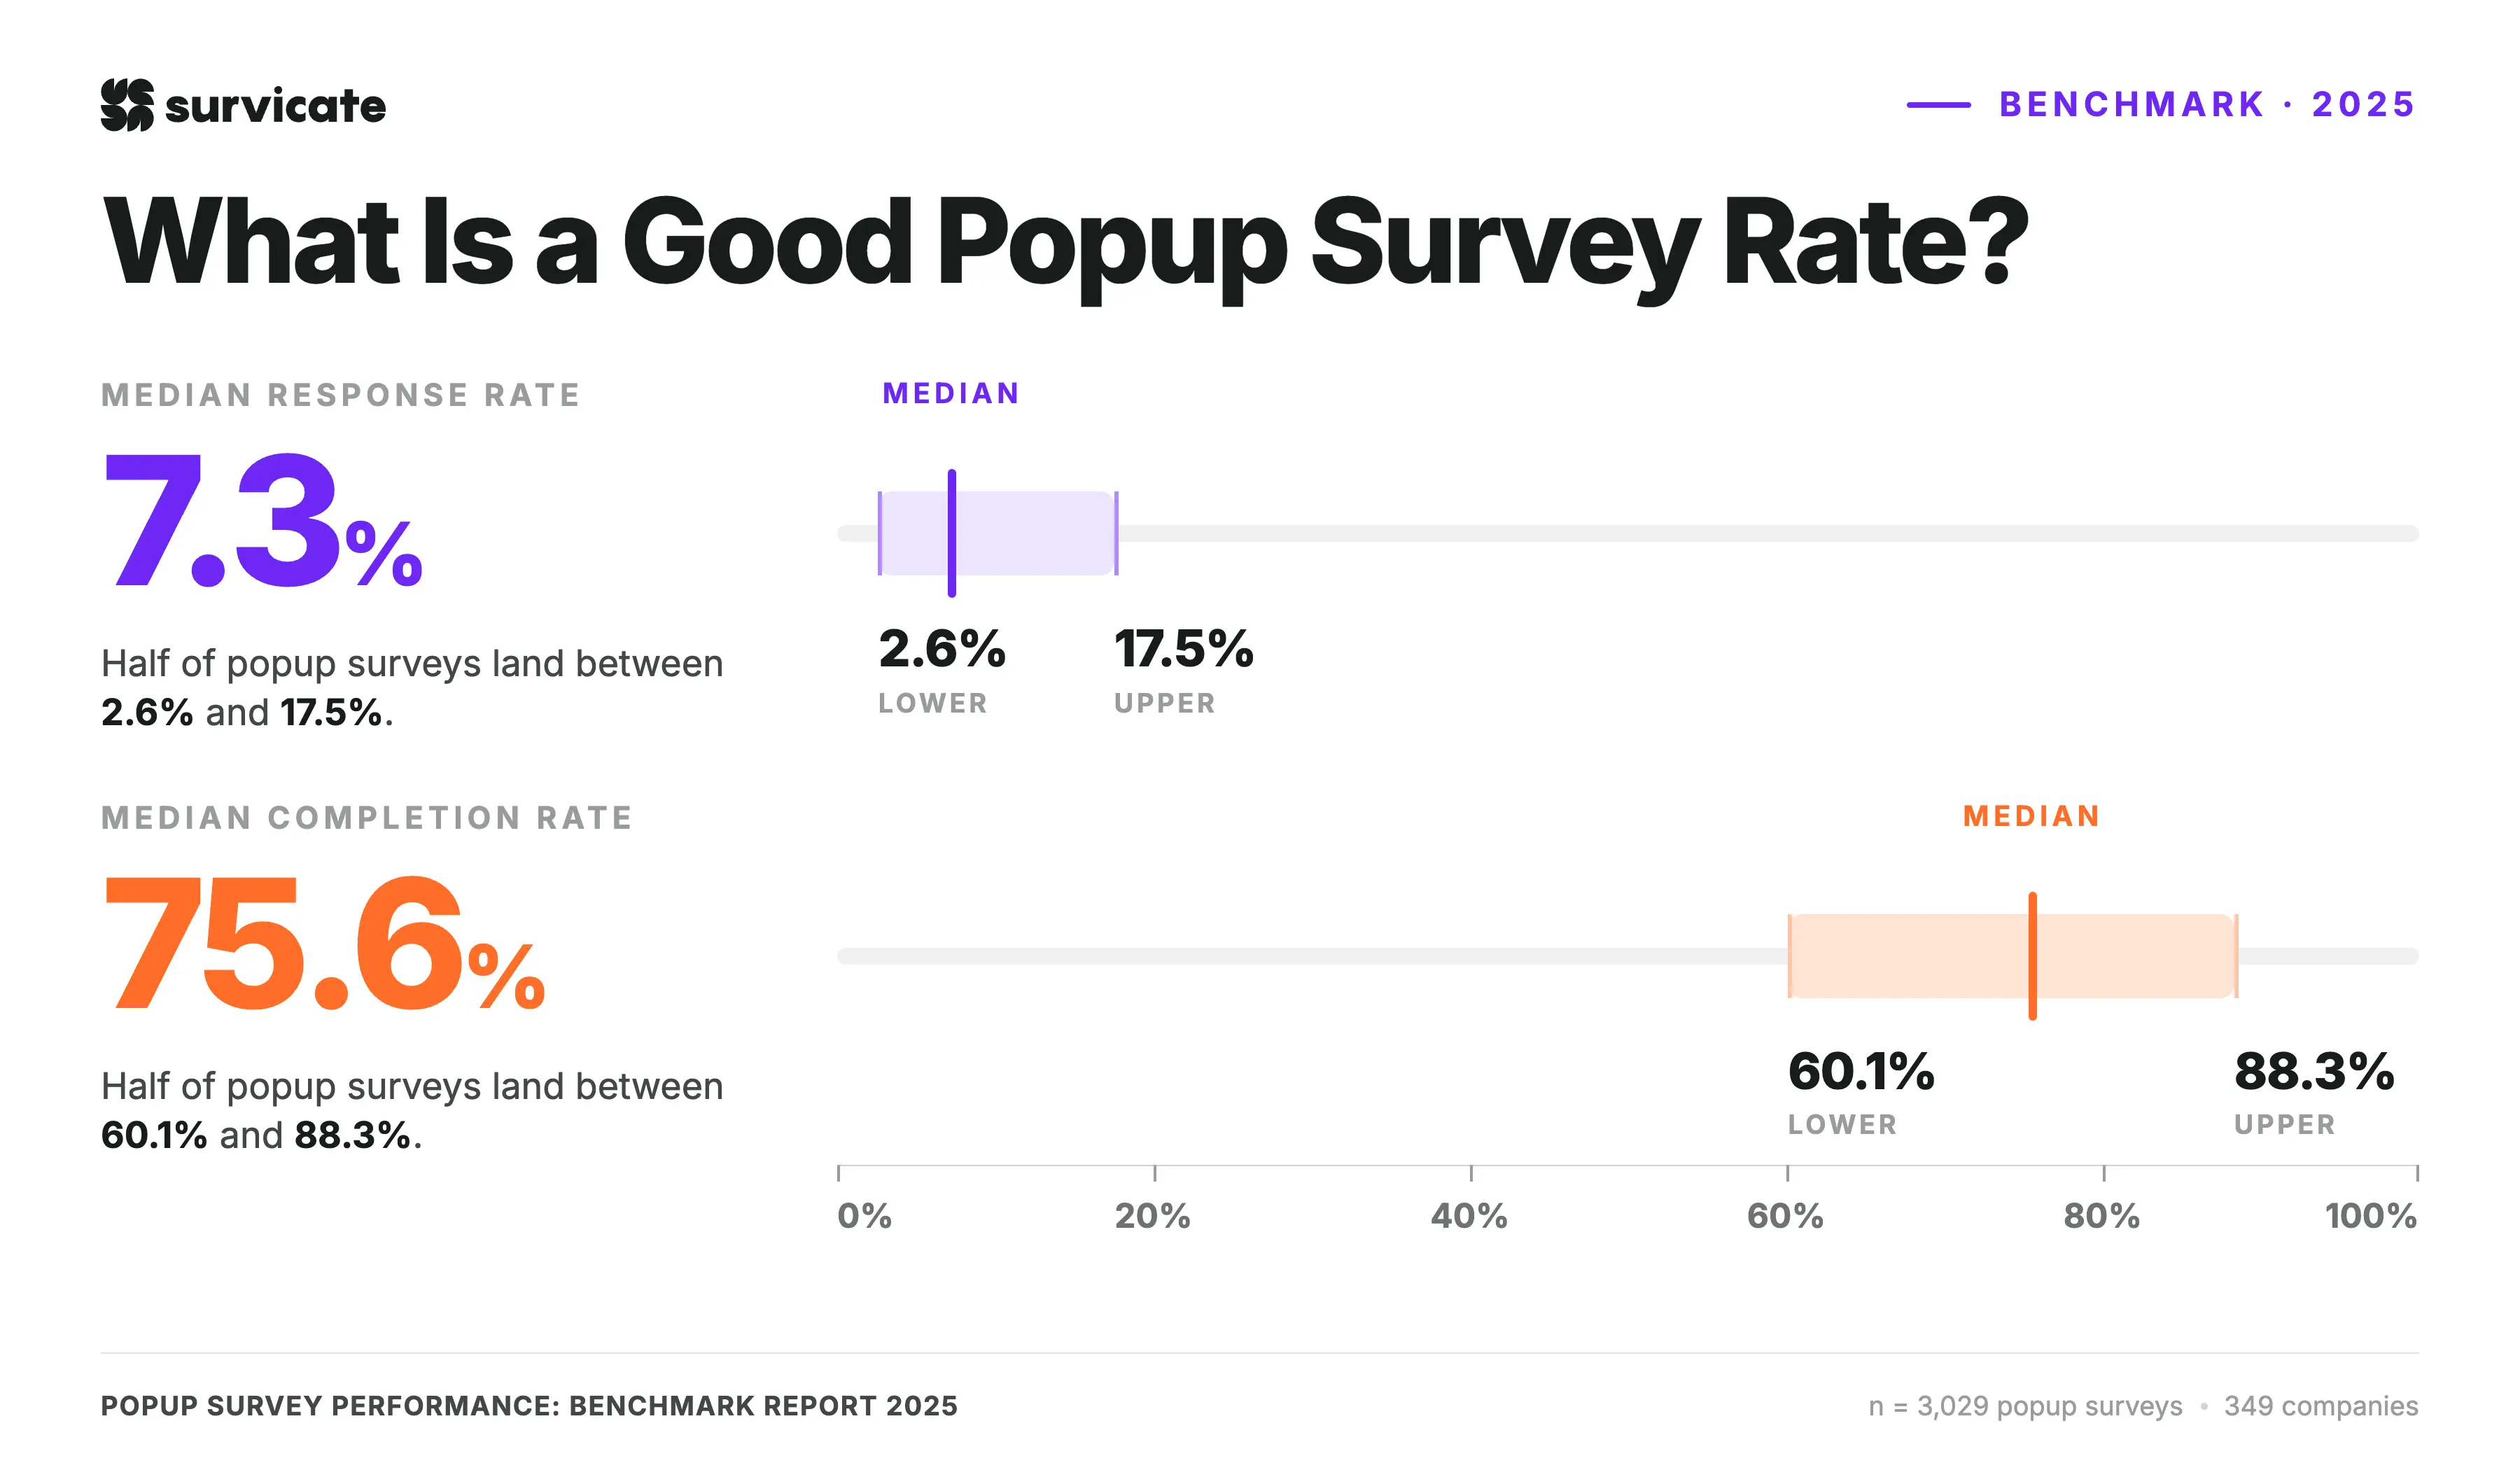
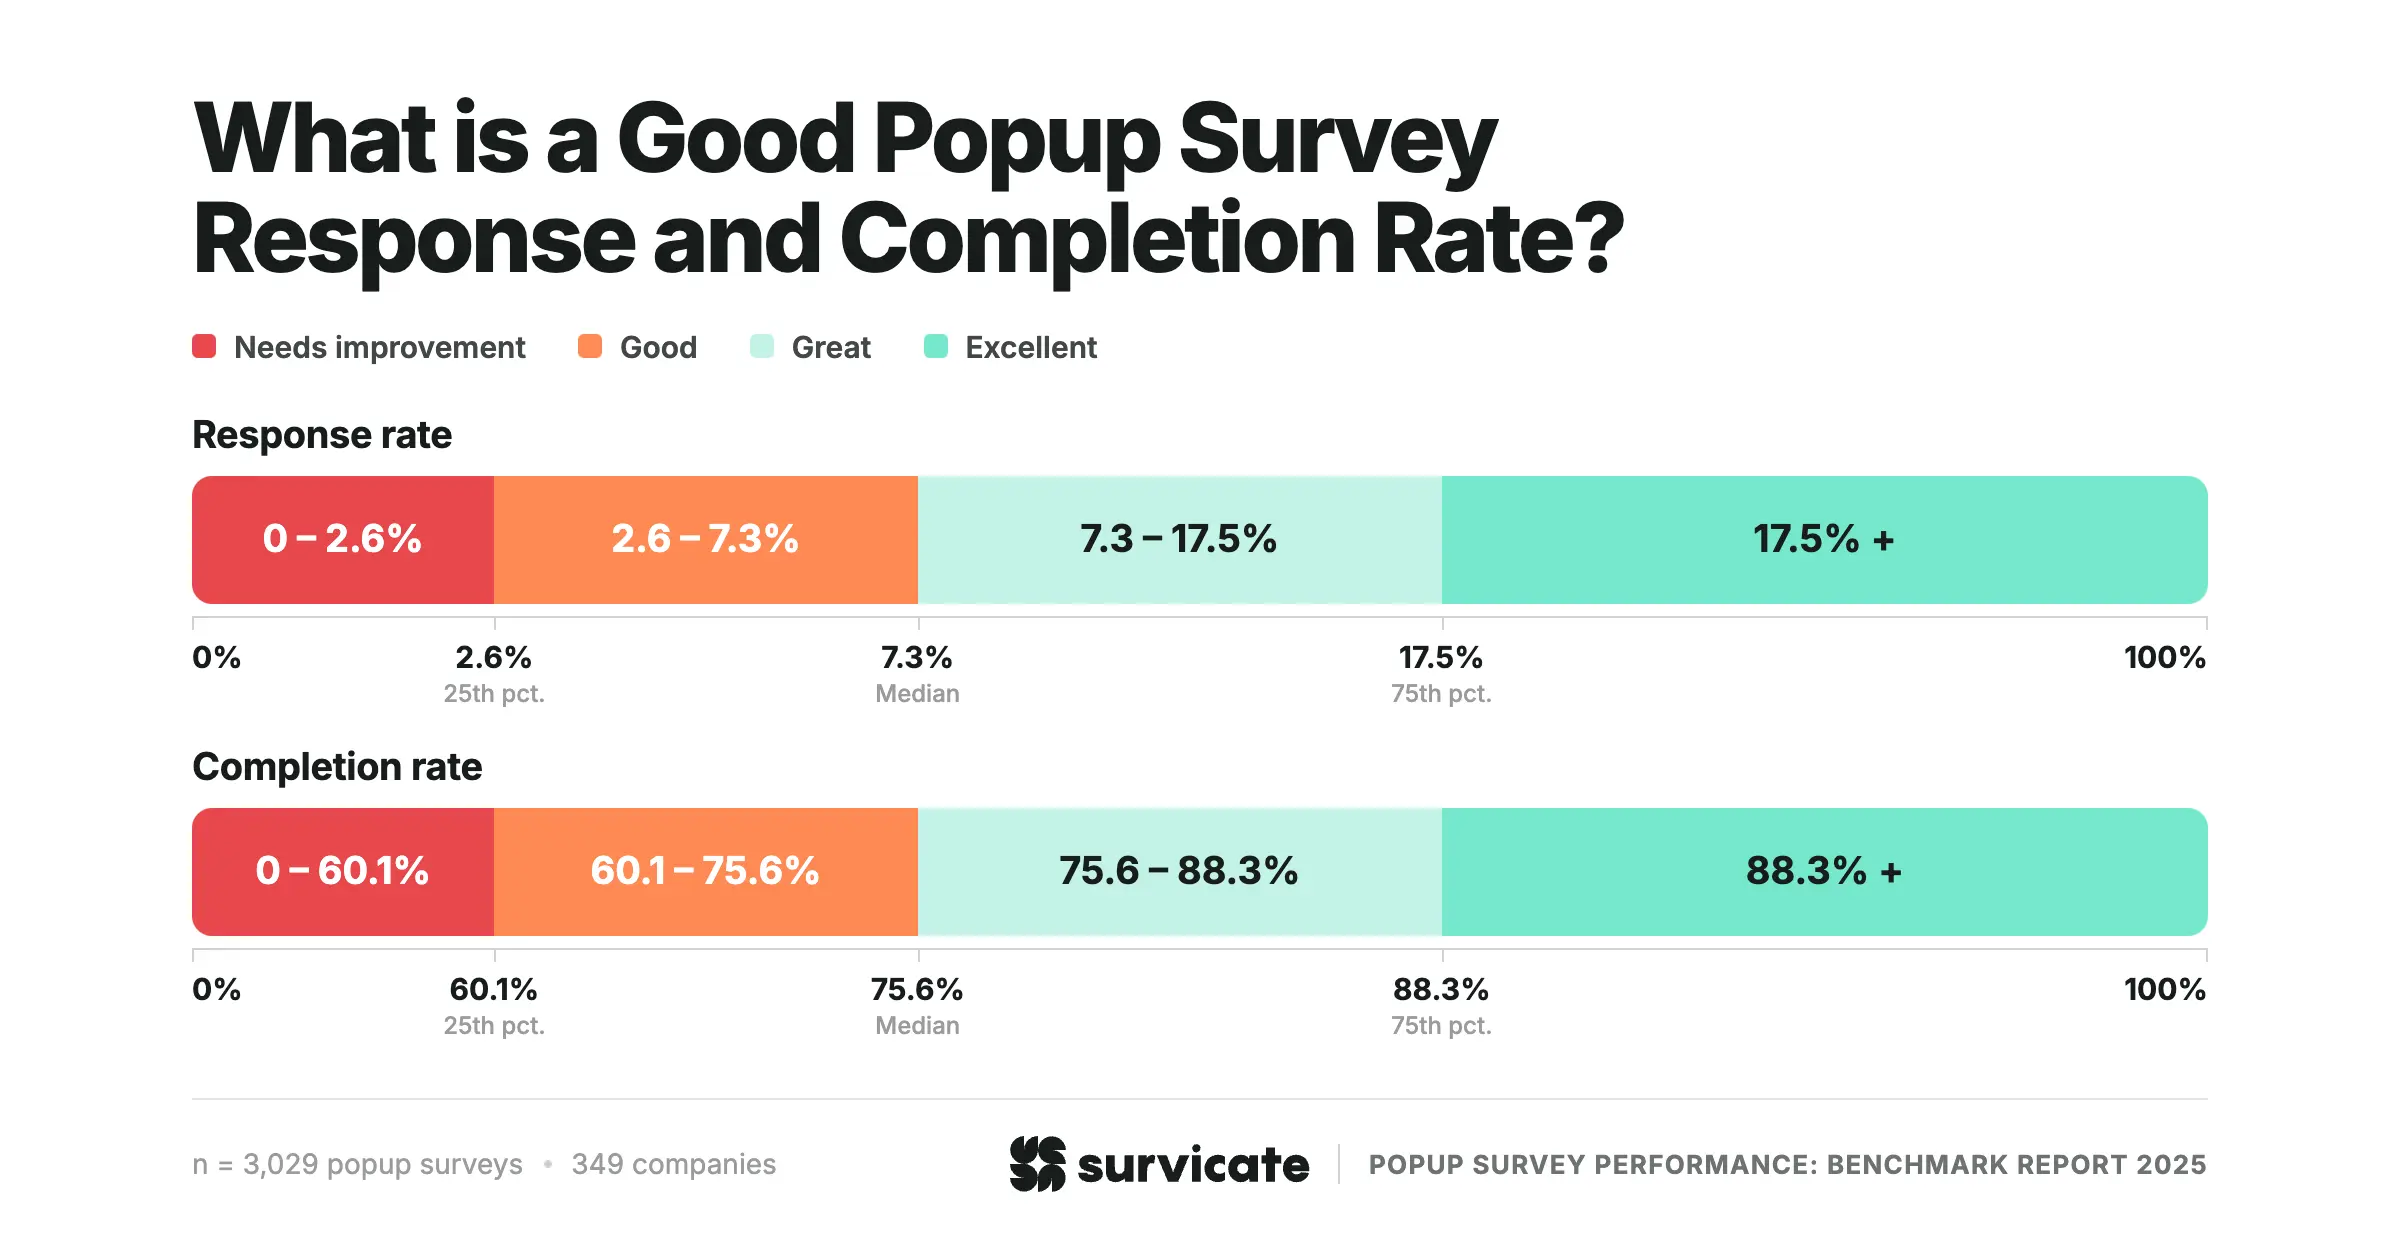
Across all popup surveys in the dataset, the median response rate reached 7.3%. This means that half of the surveys generated a response from at least 7.3% of visitors who saw them, while the other half fell below that mark.
The middle 50% of popup surveys recorded response rates between 2.6% (25th percentile) and 17.5% (75th percentile), showing that response rates vary considerably across companies and use cases.
Completion rates proved much more consistent. The median completion rate came in at 75.6%, with the middle half of surveys ranging from 60.1% to 88.3%. In other words, once visitors started a popup survey, most went on to complete it, regardless of how many chose to respond in the first place.
The upper-left option has been excluded from the main performance metrics due to a tiny sample size (just 0.2% of total surveys). It easily takes the spot as the least popular choice.
Central popup placement drives 2x higher response rates than lower-right standard
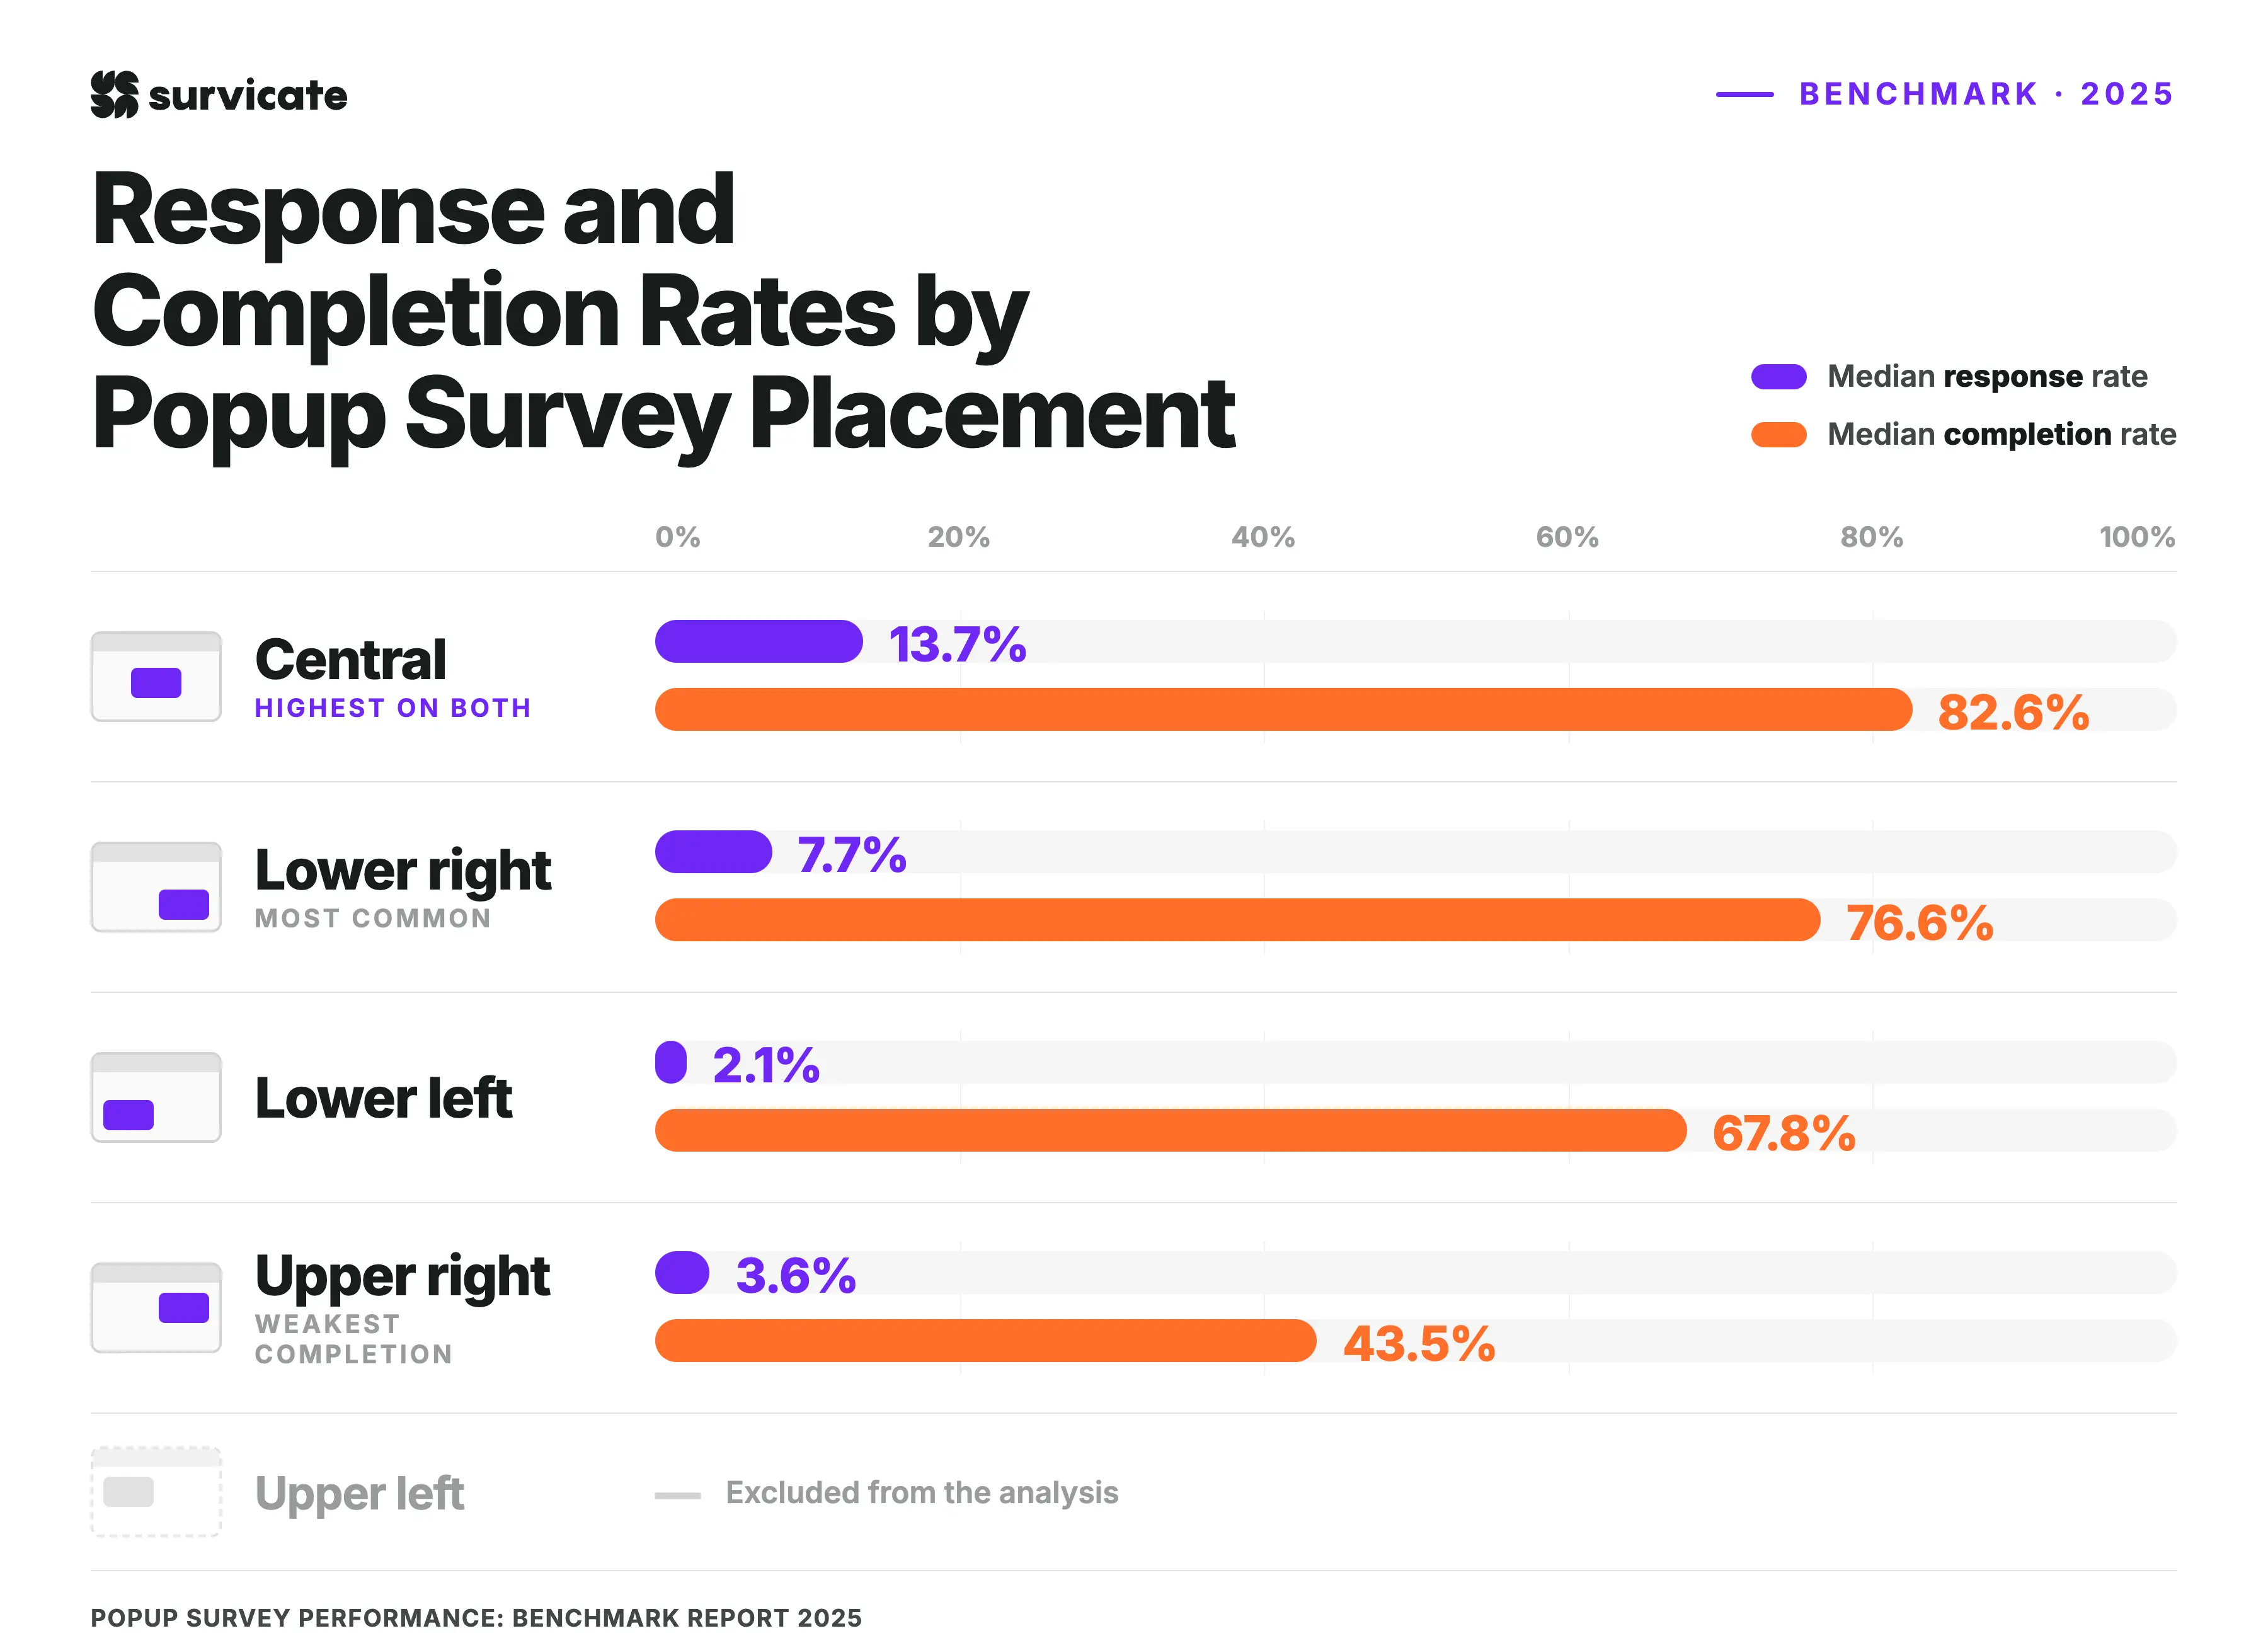
Central placement stands out as the best performer, reaching a 13.7% median response rate – nearly double the 7.7% seen in the typical lower-right setup. It also leads the pack with an 82.6% median completion rate.
Surprisingly, most surveys stick to the lower-right corner. That single spot accounts for 78.9% of all analyzed surveys, even though its results remain fairly average.
Placements in the lower-left and upper-right corners perform far worse on response rates, dropping to 2.1% and 3.6% respectively. The upper-right position also sees a sharp dip in completions at just 43.5% (compared to lower-left's 67.8%).
Instant and event-based popup triggers achieve the strongest response rates
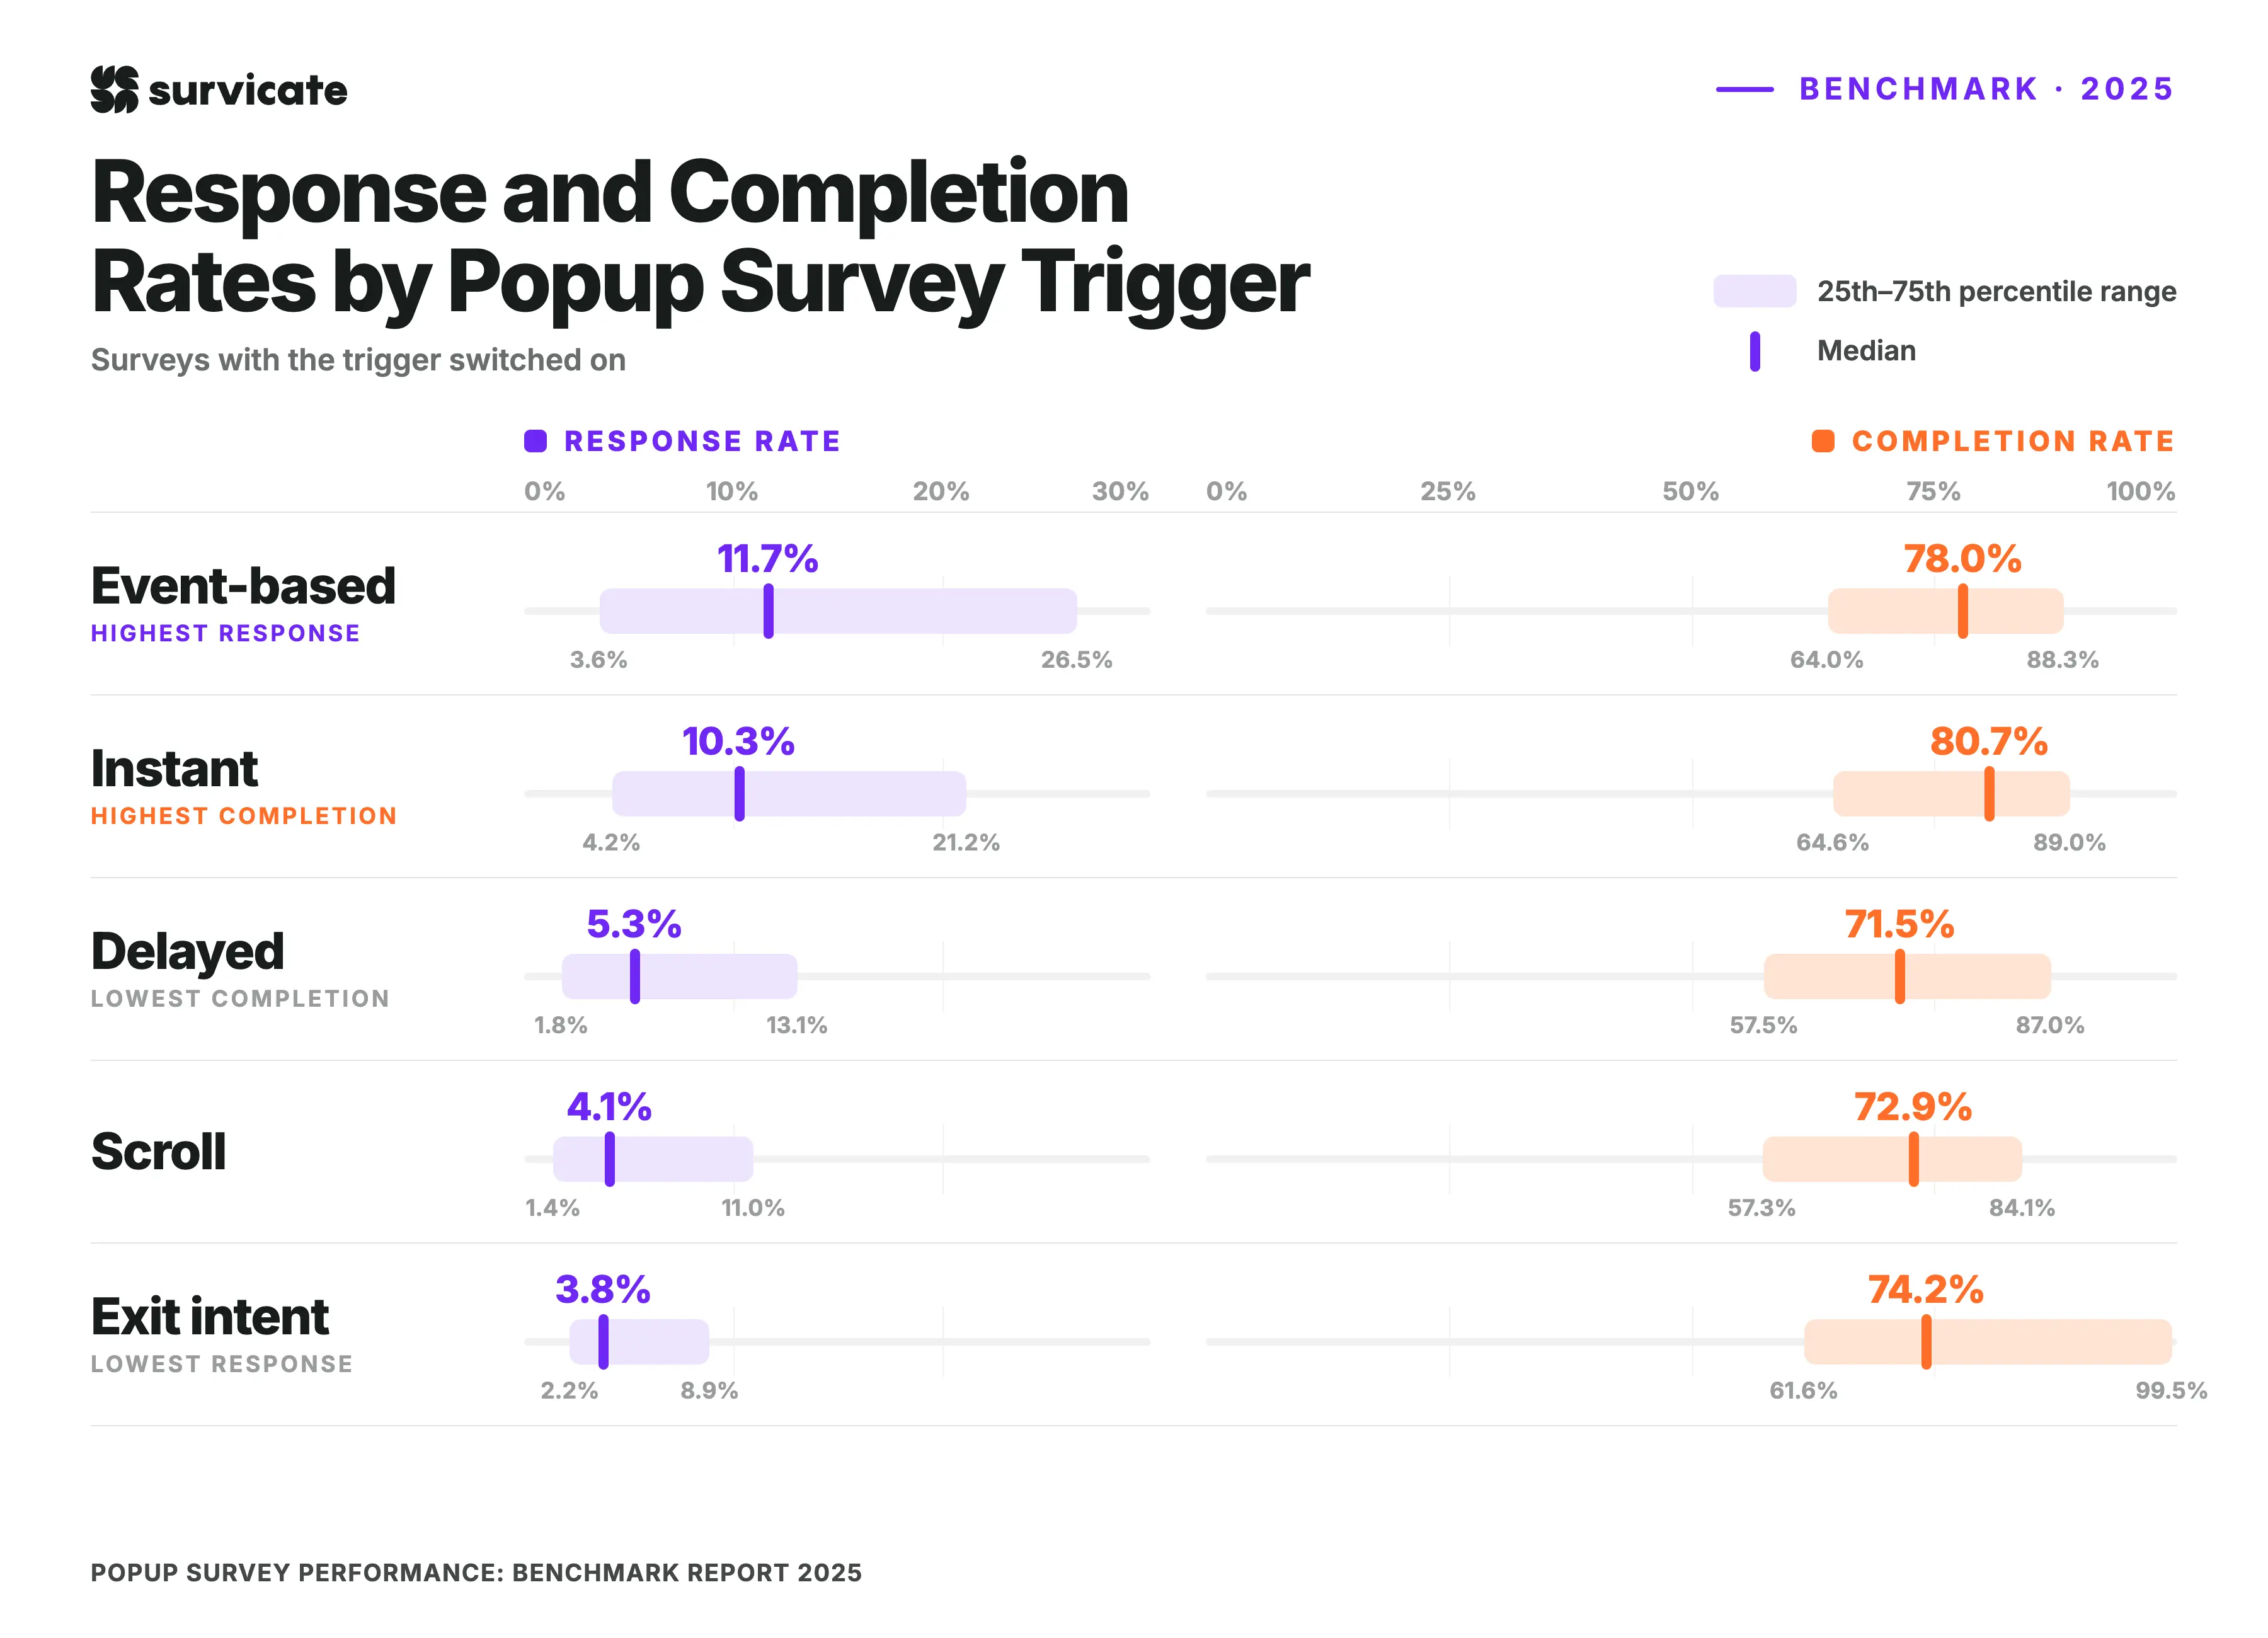
The way a popup survey is triggered has a clear relationship with both response and completion rates.
Here, we present data for five trigger types:
- Event-based
- Instant
- Scroll
- Delayed
- Exit intent
"Switched on" refers to surveys where the specified trigger type was enabled, while "switched off" to those that may have used a different trigger instead.
Two trigger types clearly stand out from the rest.
Event-based triggers lead the dataset with a median response rate of 11.7%, compared to 7.0% when this trigger isn't enabled. They also achieve a median completion rate of 78.0%, exceeding the 75.5% benchmark for surveys that rely on other trigger types.
Instant triggers follow closely. Surveys displayed as soon as a visitor lands on the page record a median response rate of 10.3%, nearly double the 5.7% observed when the instant trigger is switched off. They also post the highest median completion rate in the dataset at 80.7%, compared to 72.4% for all other trigger settings.
The remaining trigger types fall below the overall benchmark on both metrics. Scroll triggers reach a median response rate of 4.1%, delayed triggers reach 5.3%, and exit-intent triggers record the lowest result at 3.8%. Completion rates follow the same pattern. Surveys using delayed triggers show the lowest median completion rate (71.5%), followed by scroll (72.9%) and exit intent (74.2%). In every case, surveys that use a different trigger achieve higher median response and completion rates.
B2C beats B2B on popup response rates, but B2B peaks centrally
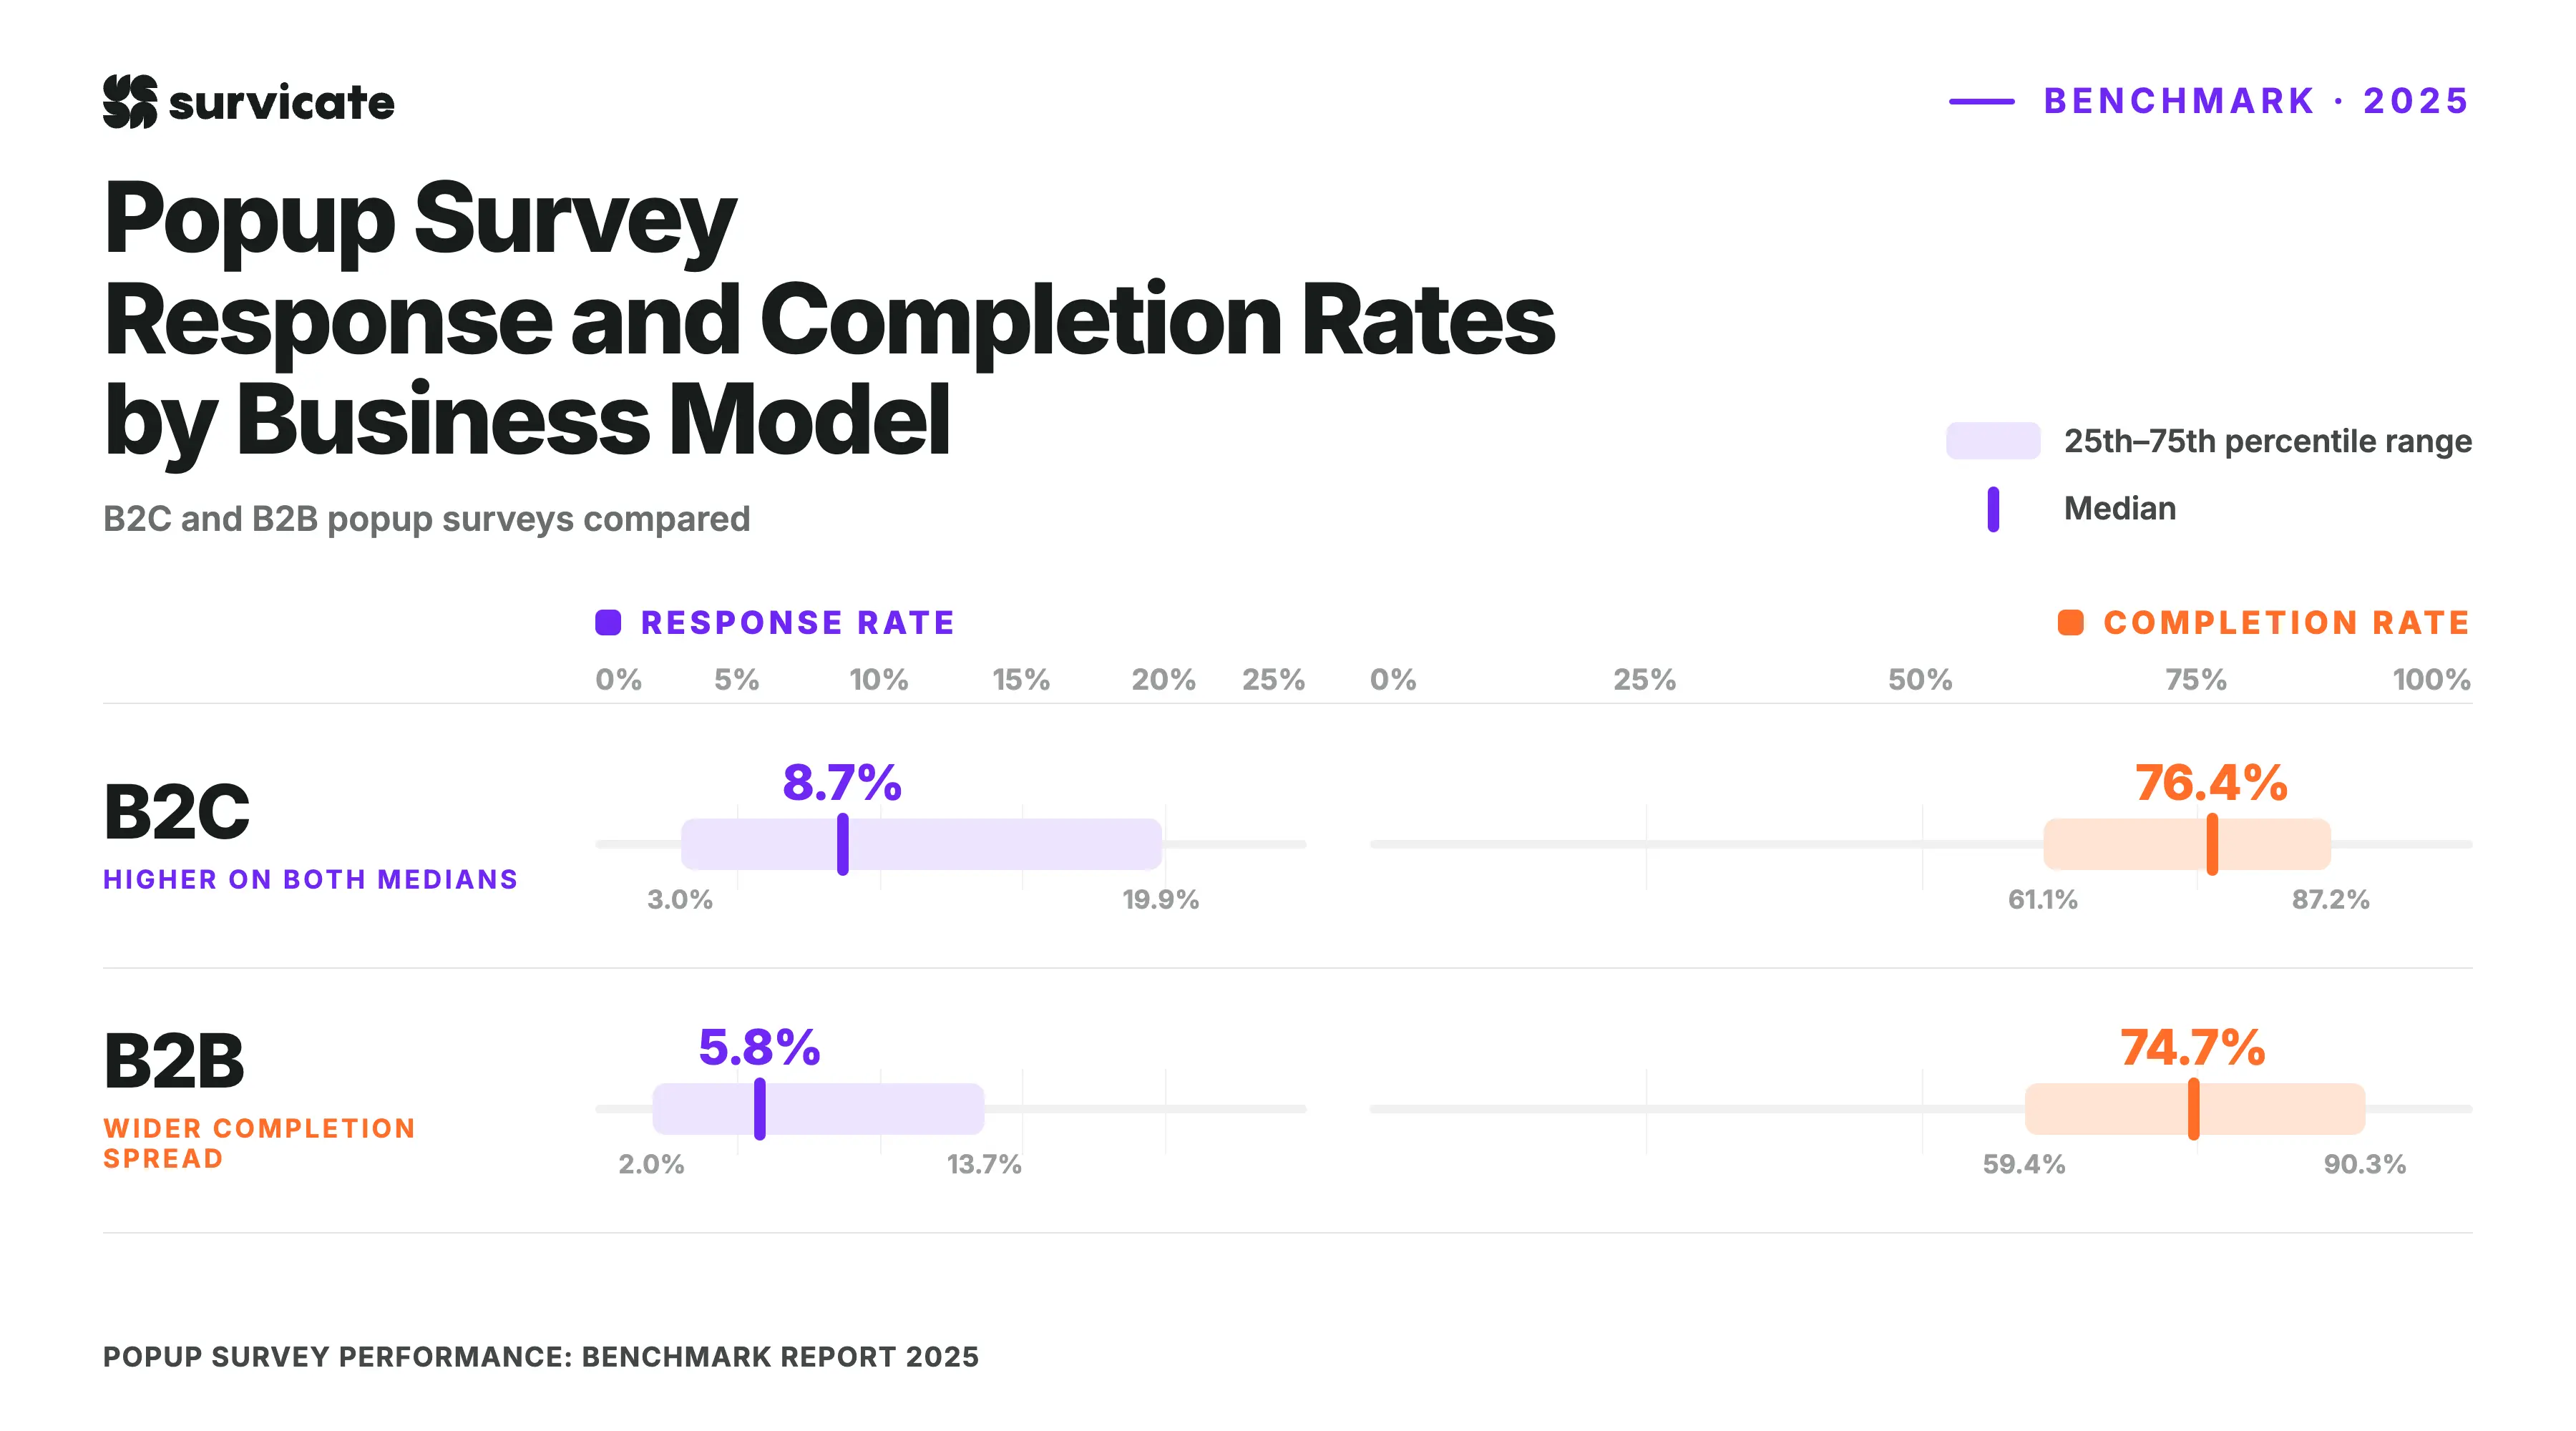
B2C companies achieve higher response rates overall across the dataset. The median response rate for B2C sits at 8.7%, compared to 5.8% for B2B, which is a full 50% higher. Median completion rates stay fairly neck-and-neck. B2C hits 76.4% while B2B reaches 74.7%.
When looking at specific placements, the strategy changes. In B2B, central placement stands out as the clear winner. It delivers a 14.5% median response rate and an 83.4% median completion rate. The standard lower-right placement follows in second place at a 5.7% response rate and 74.5% completion rate.
In B2C, central placement still leads on response rates at 11.9%, with a 70.7% completion rate. However, the popular lower-right placement holds up much stronger at scale in B2C, reaching a 9.6% response rate and the highest completion rate for B2C at 78.0%.
Other placements lag behind for both models. Lower-left yields a 2.0% response rate for B2B and 2.2% for B2C. Upper-right scores 3.3% in B2B and 8.0% in B2C, but sees poor completion rates (40.9% in B2B and 67.6% in B2C).
Upper-left survey placement has been excluded from both datasets due to a low sample size.
Fintech and agencies lead popup response rates; media and manufacturing lag behind
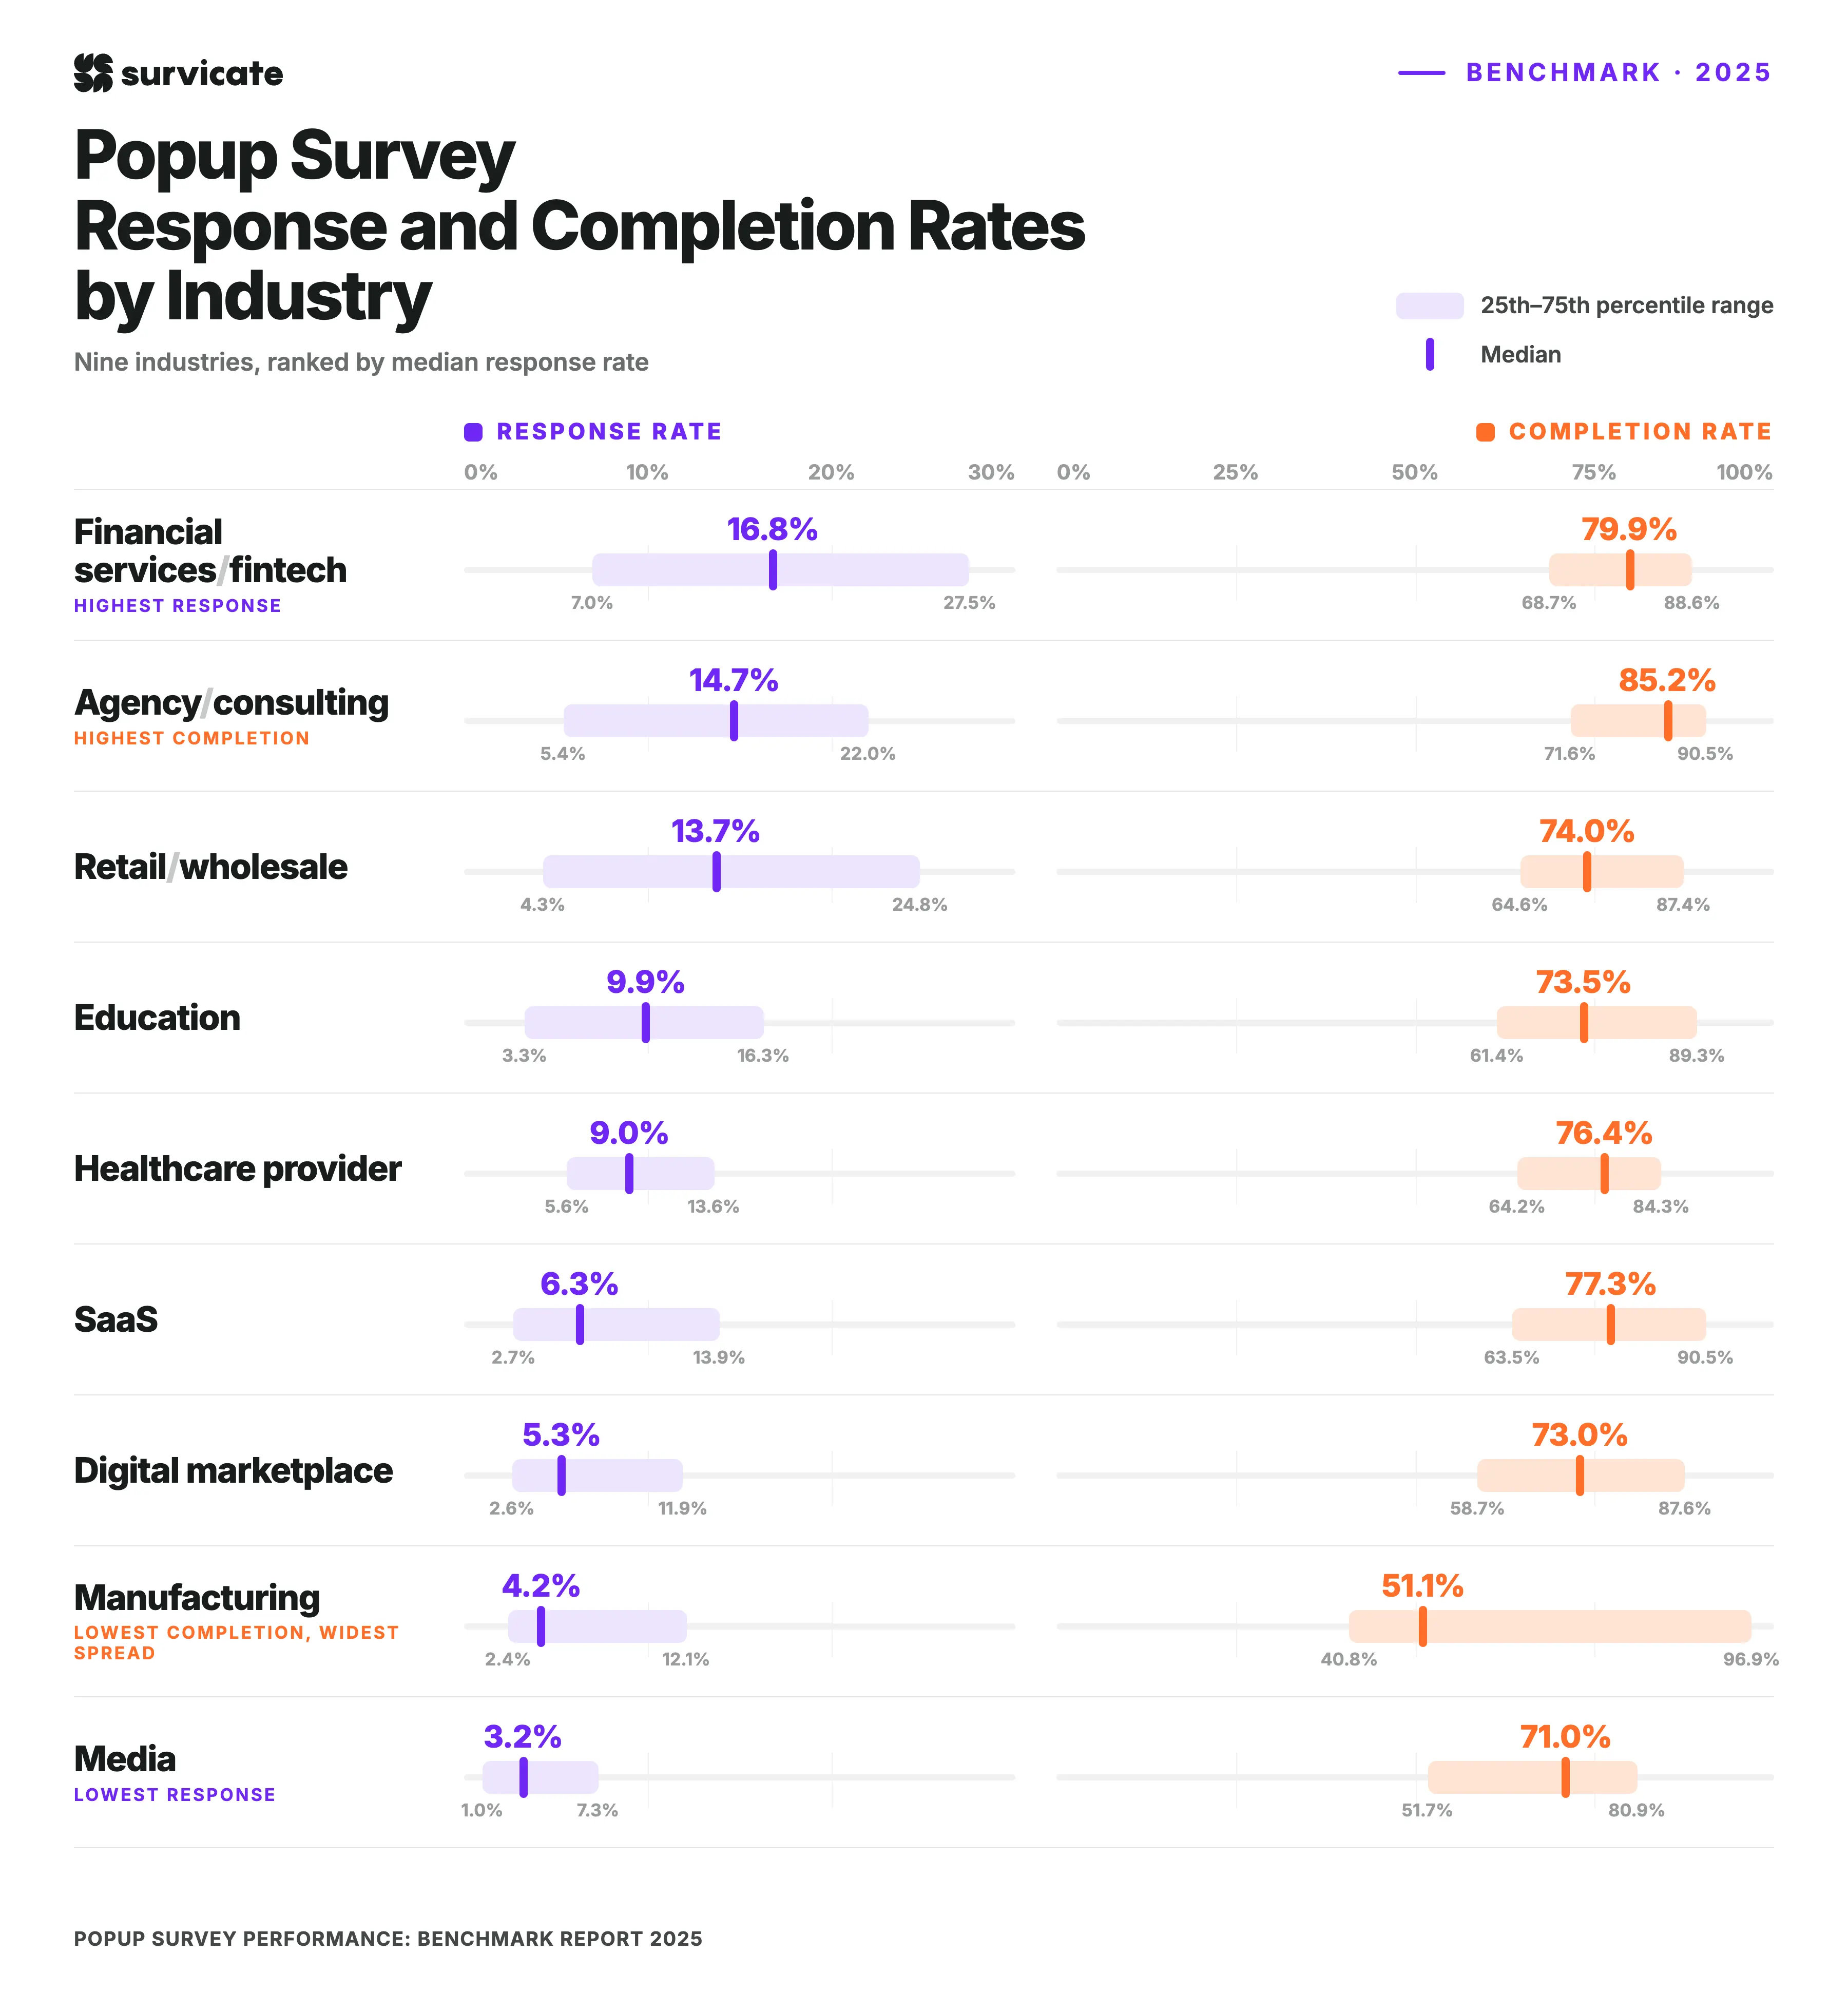
Financial services/fintech and agency/consulting record the highest response rates, hitting medians of 16.8% and 14.7% respectively. Retail/wholesale follows closely at 13.7%. Agency/consulting also takes the top spot for completion rate at 85.2%.
On the other end of the spectrum, media (3.2%), digital marketplaces (5.3%), and SaaS (6.3%) generate lower response rates, despite representing some of the largest sample sizes in the dataset.
Completion rates stay much more consistent across sectors, ranging mostly between 71.0% and 85.2% (with manufacturing as the lone outlier at 51.1%). This pattern shows that the biggest performance gaps happen at the initial response stage rather than after someone starts filling out the survey.
Important note: We limited this analysis to lower-right placement because it accounts for nearly 80% of all surveys in the dataset, i.e., the most representative sample for industry comparisons. Other placements included too few unique organizations (fewer than 8 in several categories), making those results less reliable.
So, what's the ideal popup survey setup?
While standard industry advice often points to the lower-right corner, our dataset shows that central placement overall outperforms every other option.
Central placement stands out as the single strongest choice for driving engagement. The traditional lower-right corner functions as a common fallback mainly because of its widespread adoption, capturing a 78.9% share of surveys while delivering mid-tier performance with a 7.7% median response rate.
The impact of location varies depending on the audience model. In B2B setups, central placement delivers the largest measurable lift, pushing performance to a 14.5% median response rate and an 83.4% median completion rate. For B2C brands, the lower-right position holds up nearly as well as central – reaching a 9.6% response rate compared to central's 11.9%, and actually edges ahead on completion at 78.0% versus 70.7%.
Timing matters just as much as positioning. Instant triggers on page load and specific event-based triggers consistently beat out scroll depth, time delays, and exit-intent. Among all available options, exit-intent ranks as the single weakest trigger for getting an initial response.