


A Net Promoter Score on its own tells you very little, because you can't tell whether a 42 means quiet churn risk or healthy retention without a benchmark from companies like yours. Most averages you'll find lump completely different business models into the same bucket, and a lot of them are outdated.
That is why I pulled our 2026 NPS benchmarks side by side with 2025 and 2021, built on over 3,000 real Survicate surveys across all three years. Instead of raw response averages that let a few massive accounts skew the curve, I looked at company-level medians and split out B2B from B2C, so you can compare your score with similar companies.
Methodology
I analyzed NPS surveys created between January and September in 2026, 2025, and 2021 by companies on Survicate's paid plans. I used the same nine-month window for all three years, because the analysis ran in fall 2026 and the full year isn't in yet.
- How I define NPS. A survey qualifies if it asks respondents to rate, on a scale of 0 to 10, how likely they are to recommend the whole company, brand, or core product. The question can refer to personal contacts, a specific group ("someone like you"), people in general, or leave the audience unspecified. I excluded questions about individual features, sessions, content, people, past behavior, specific time limits, or multiple things at once. eNPS surveys were also excluded. AI (Claude) reviewed every question, and I checked borderline cases manually.
- Company-level calculation. I combined each company's eligible surveys into one NPS per year, so every company counts once, regardless of how many surveys it ran. Benchmarks are the median, 25th percentile, and 75th percentile across company scores. I merged responses to identical questions asked to different groups. I kept the most general question when the same respondents answered several different NPS questions (43 surveys were affected).
- Period and sample. I included surveys from paid plans created between January and September in each year. Each survey needed at least 30 responses, and each breakdown category needed at least 8 companies. I tested thresholds of 20, 30, 50, and 100 responses, and the median NPS remained broadly stable across all four.
- Industry categorization. I used external enrichment data and internal analysis models to create a narrow classification that reflects Survicate's current customer base. I identified 15 industries, but reported only the nine which had at least 8 qualifying companies.
- Cleaning and rounding. I removed 38 surveys with missing response or completion rates, or response rates above 100%. When I discuss NPS, I round the values to whole numbers.
- Year-over-year comparisons. Treat year-to-year changes with care, because each year covers a different set of companies, not a panel tracking the same businesses. In smaller industries a handful of companies can move the median on their own.
Key findings
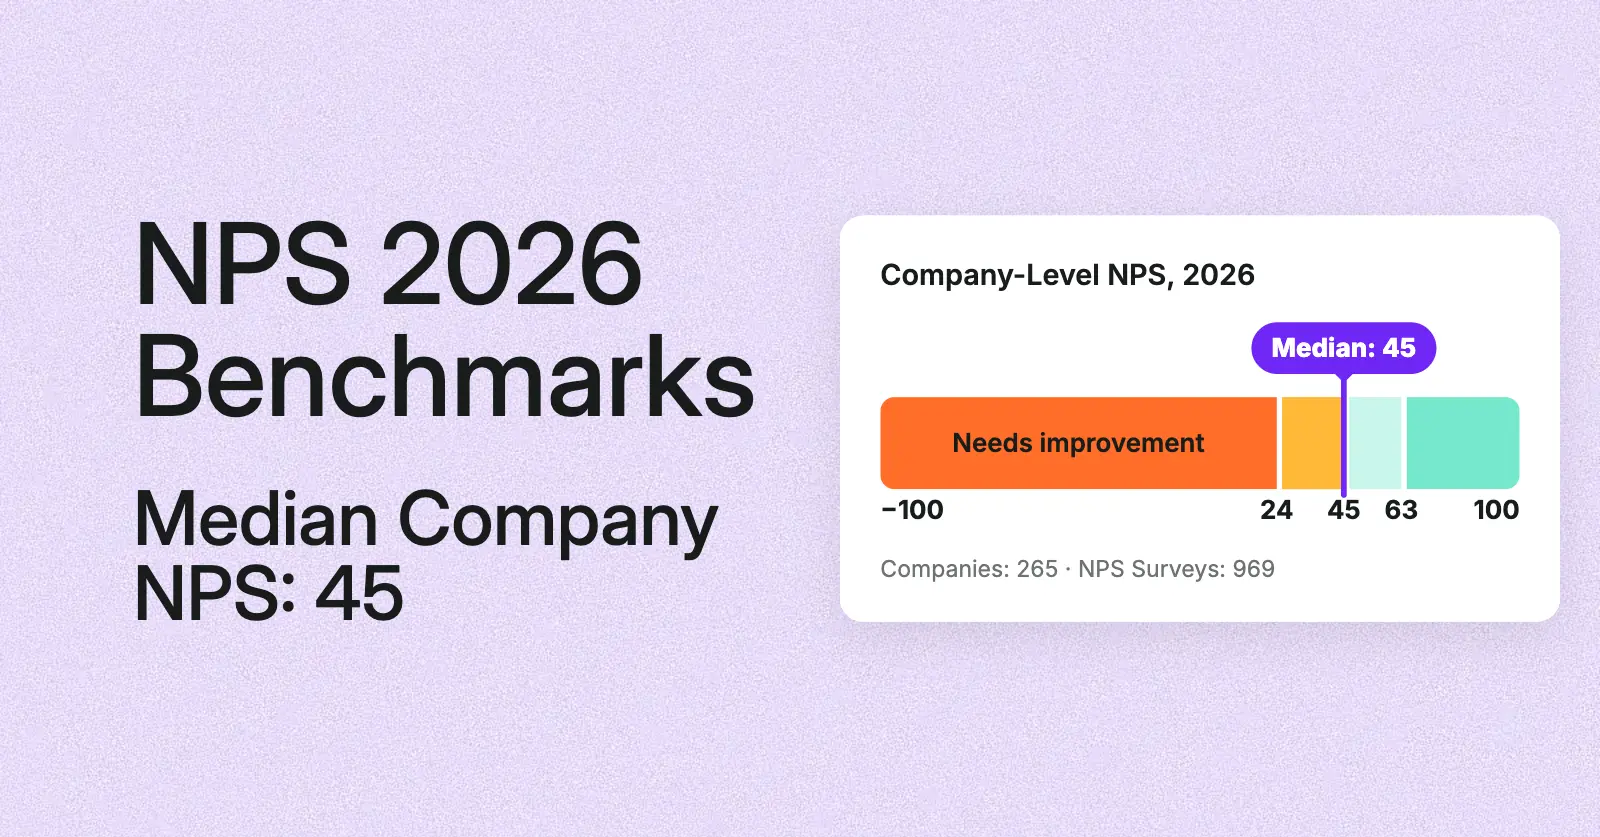
- The median NPS is 45, but a quarter of companies score 24 or lower. The middle 50% of companies in the 2026 dataset fall between 24 and 63, based on 265 companies and 969 surveys.
- The median NPS has barely changed since 2025, but the bottom quartile has improved. The overall median moved from 46 to 45, while the 25th percentile rose from 16 to 24. Because each year's sample includes a different set of companies, this shift may reflect both changes in sample composition and changes in company performance.
- Professional Services, Financial Services, and Retail & E-commerce lead the industry rankings. Their median NPS scores range from 53 to 54, while SaaS sits at the bottom with 33. The 21-point gap shows how much scores vary between industries.
- SaaS has had the lowest median NPS in all three snapshots. Its median score stayed between 29 and 33 in 2021, 2025, and 2026. With 76 companies and 387 surveys in 2026, SaaS also has the largest industry sample in the report.
- The gap between B2B and B2C NPS has narrowed from 14 points to 3. B2B's median rose from 36 in 2021 to 44 in 2026, while B2C's fell from 50 to 47. The comparison covers more than 100 companies in each group every year, but the companies weren't tracked consistently across all three snapshots, so it doesn't establish an industry-wide improvement in B2B.
- The median NPS survey completion rate is 80.91%. The middle 50% of companies record completion rates between 71.18% and 88.60%, providing a reference point for evaluating survey performance.
NPS benchmarks 2026
A quarter of companies score below 24, half score below 45, and a quarter score above 63. The data is based on 265 companies and 969 surveys collected from January to September 2026.
Five years of NPS benchmarks (2021-2026): the bottom quartile jumped
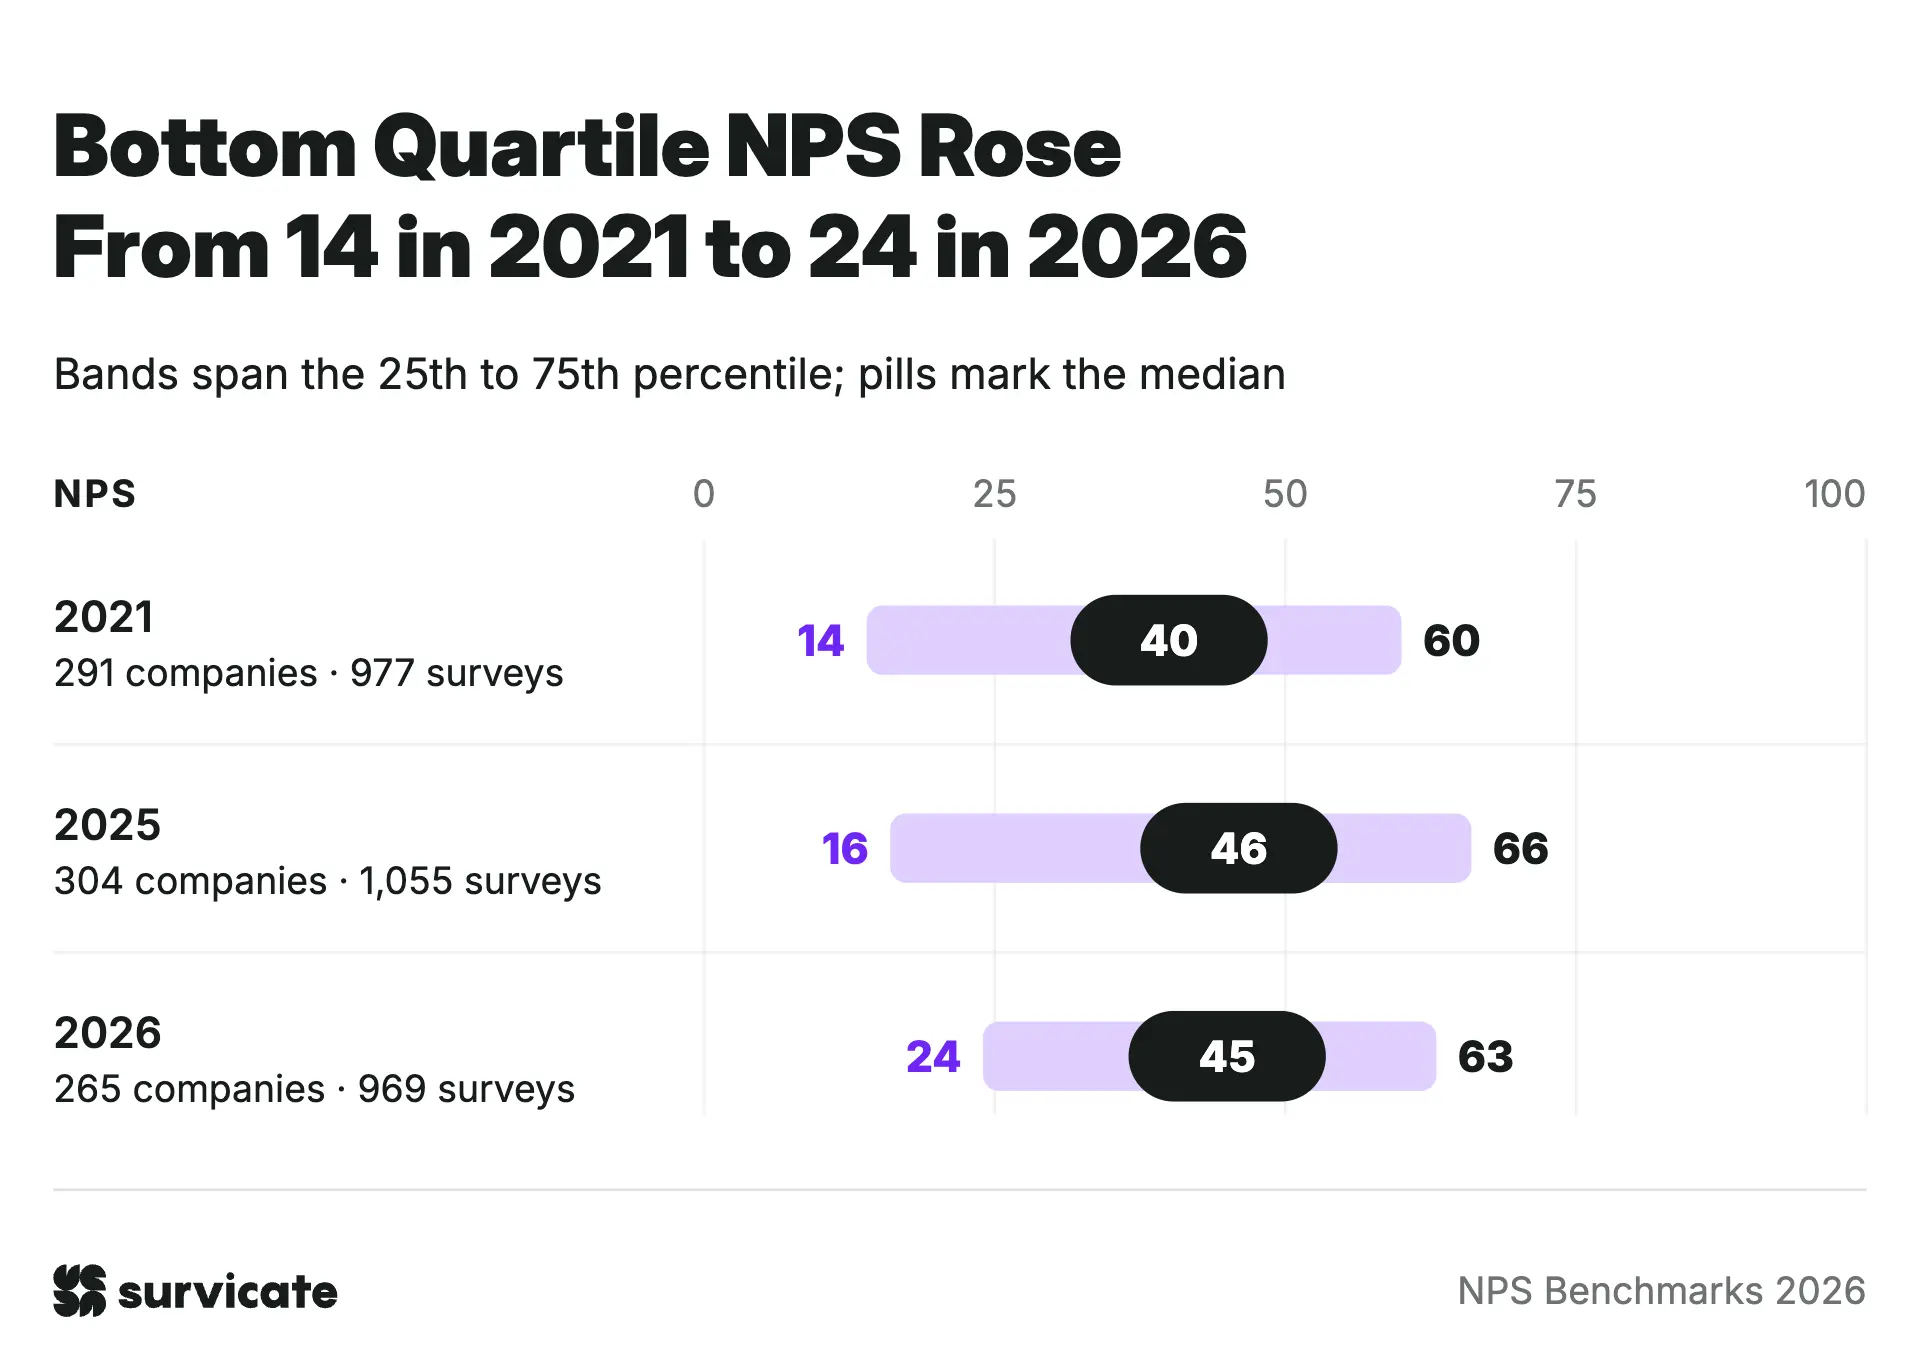
In 2026, the median sits at 45, which is five points above 2021, and just one point below 2025.
The biggest shift appears at the bottom of the distribution. The bottom quartile climbed from 14 in 2021 to 16 in 2025, and then jumped to 24 in 2026. Fewer companies are sitting with very low scores, which looks like the headline trend at first glance, but I would abstain from calling it that way, because 80% of the change actually happened in the last twelve months.
Two things could explain the jump, in the order I'd bet on them:
- Sample composition. Each year captures a different set of companies. Part of this jump can simply come down to who happens to be in the 2026 sample.
- Closing the loop. The best case is that more teams got better at acting on feedback and closing the loop, and customers rated them higher because of it. I'd love that to be true, but nothing in this dataset shows it.
At the top end, the 75th percentile moved the other way in the last year, lowering from 66 to 63. The middle half of companies now sits between 24 and 63, compared to 16 and 66 in 2025, narrowing the gap between weaker and stronger performers.
Keep in mind that these numbers represent three separate snapshots of different company sets rather than a tracked panel over time. Among the companies we have data for in both 2025 and 2026, roughly as many improved as declined. So companies didn't broadly get better.
2026 NPS benchmarks by industry: A 20-point gap separates the leaders from underachievers
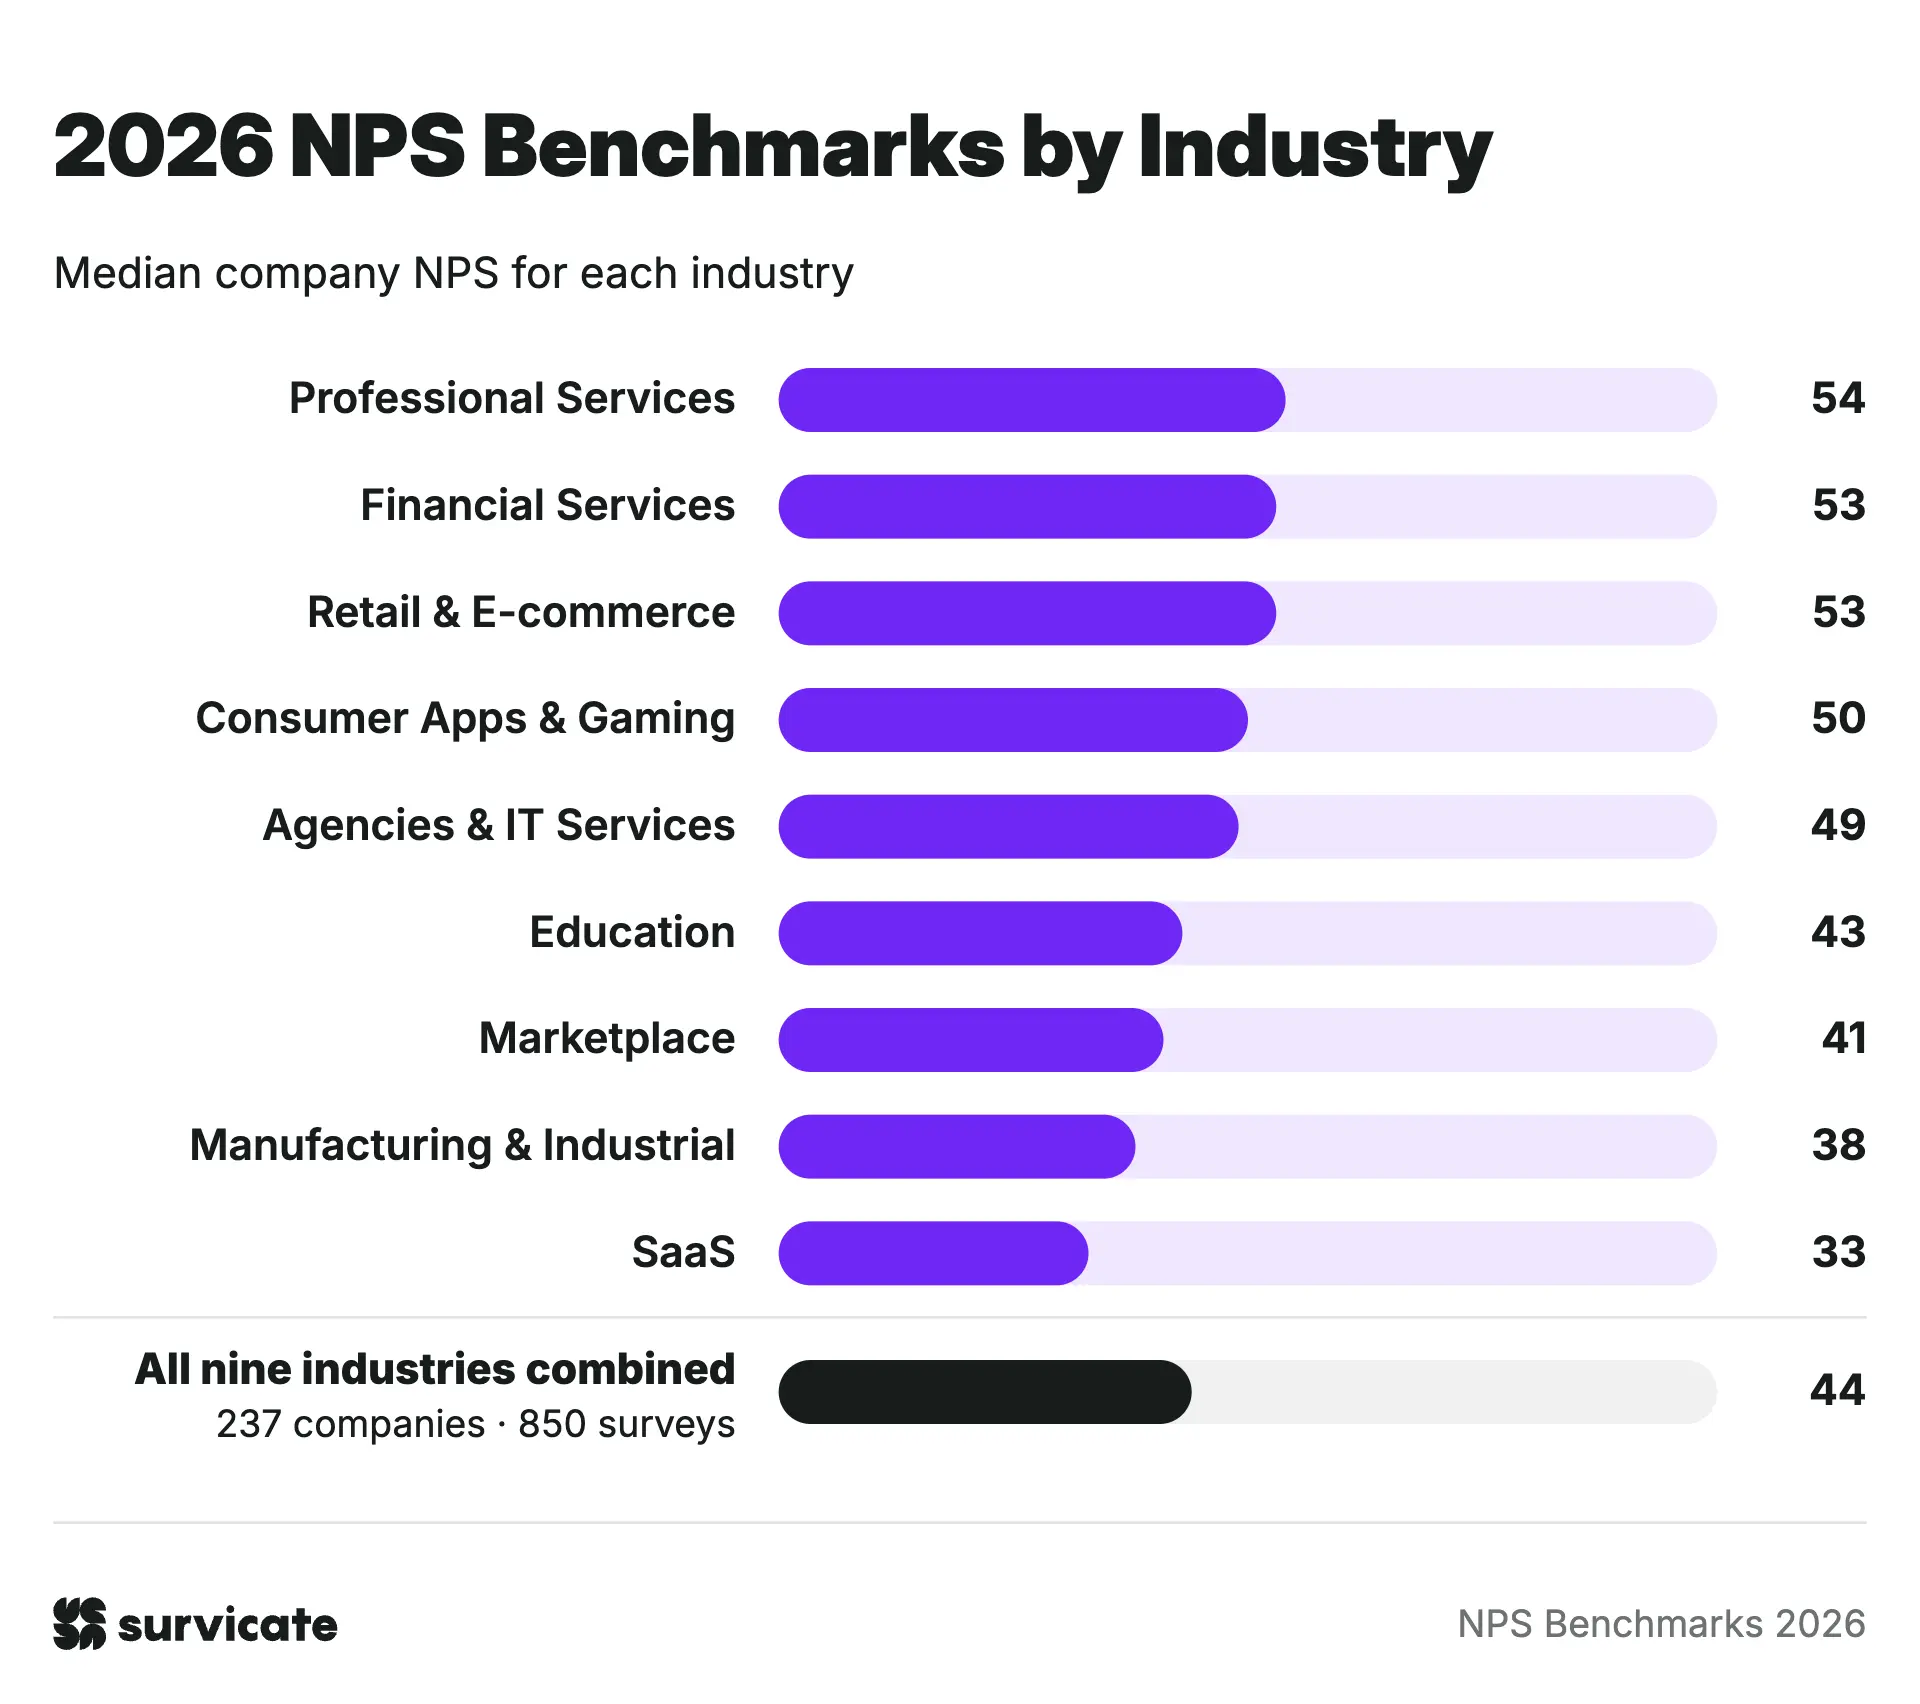
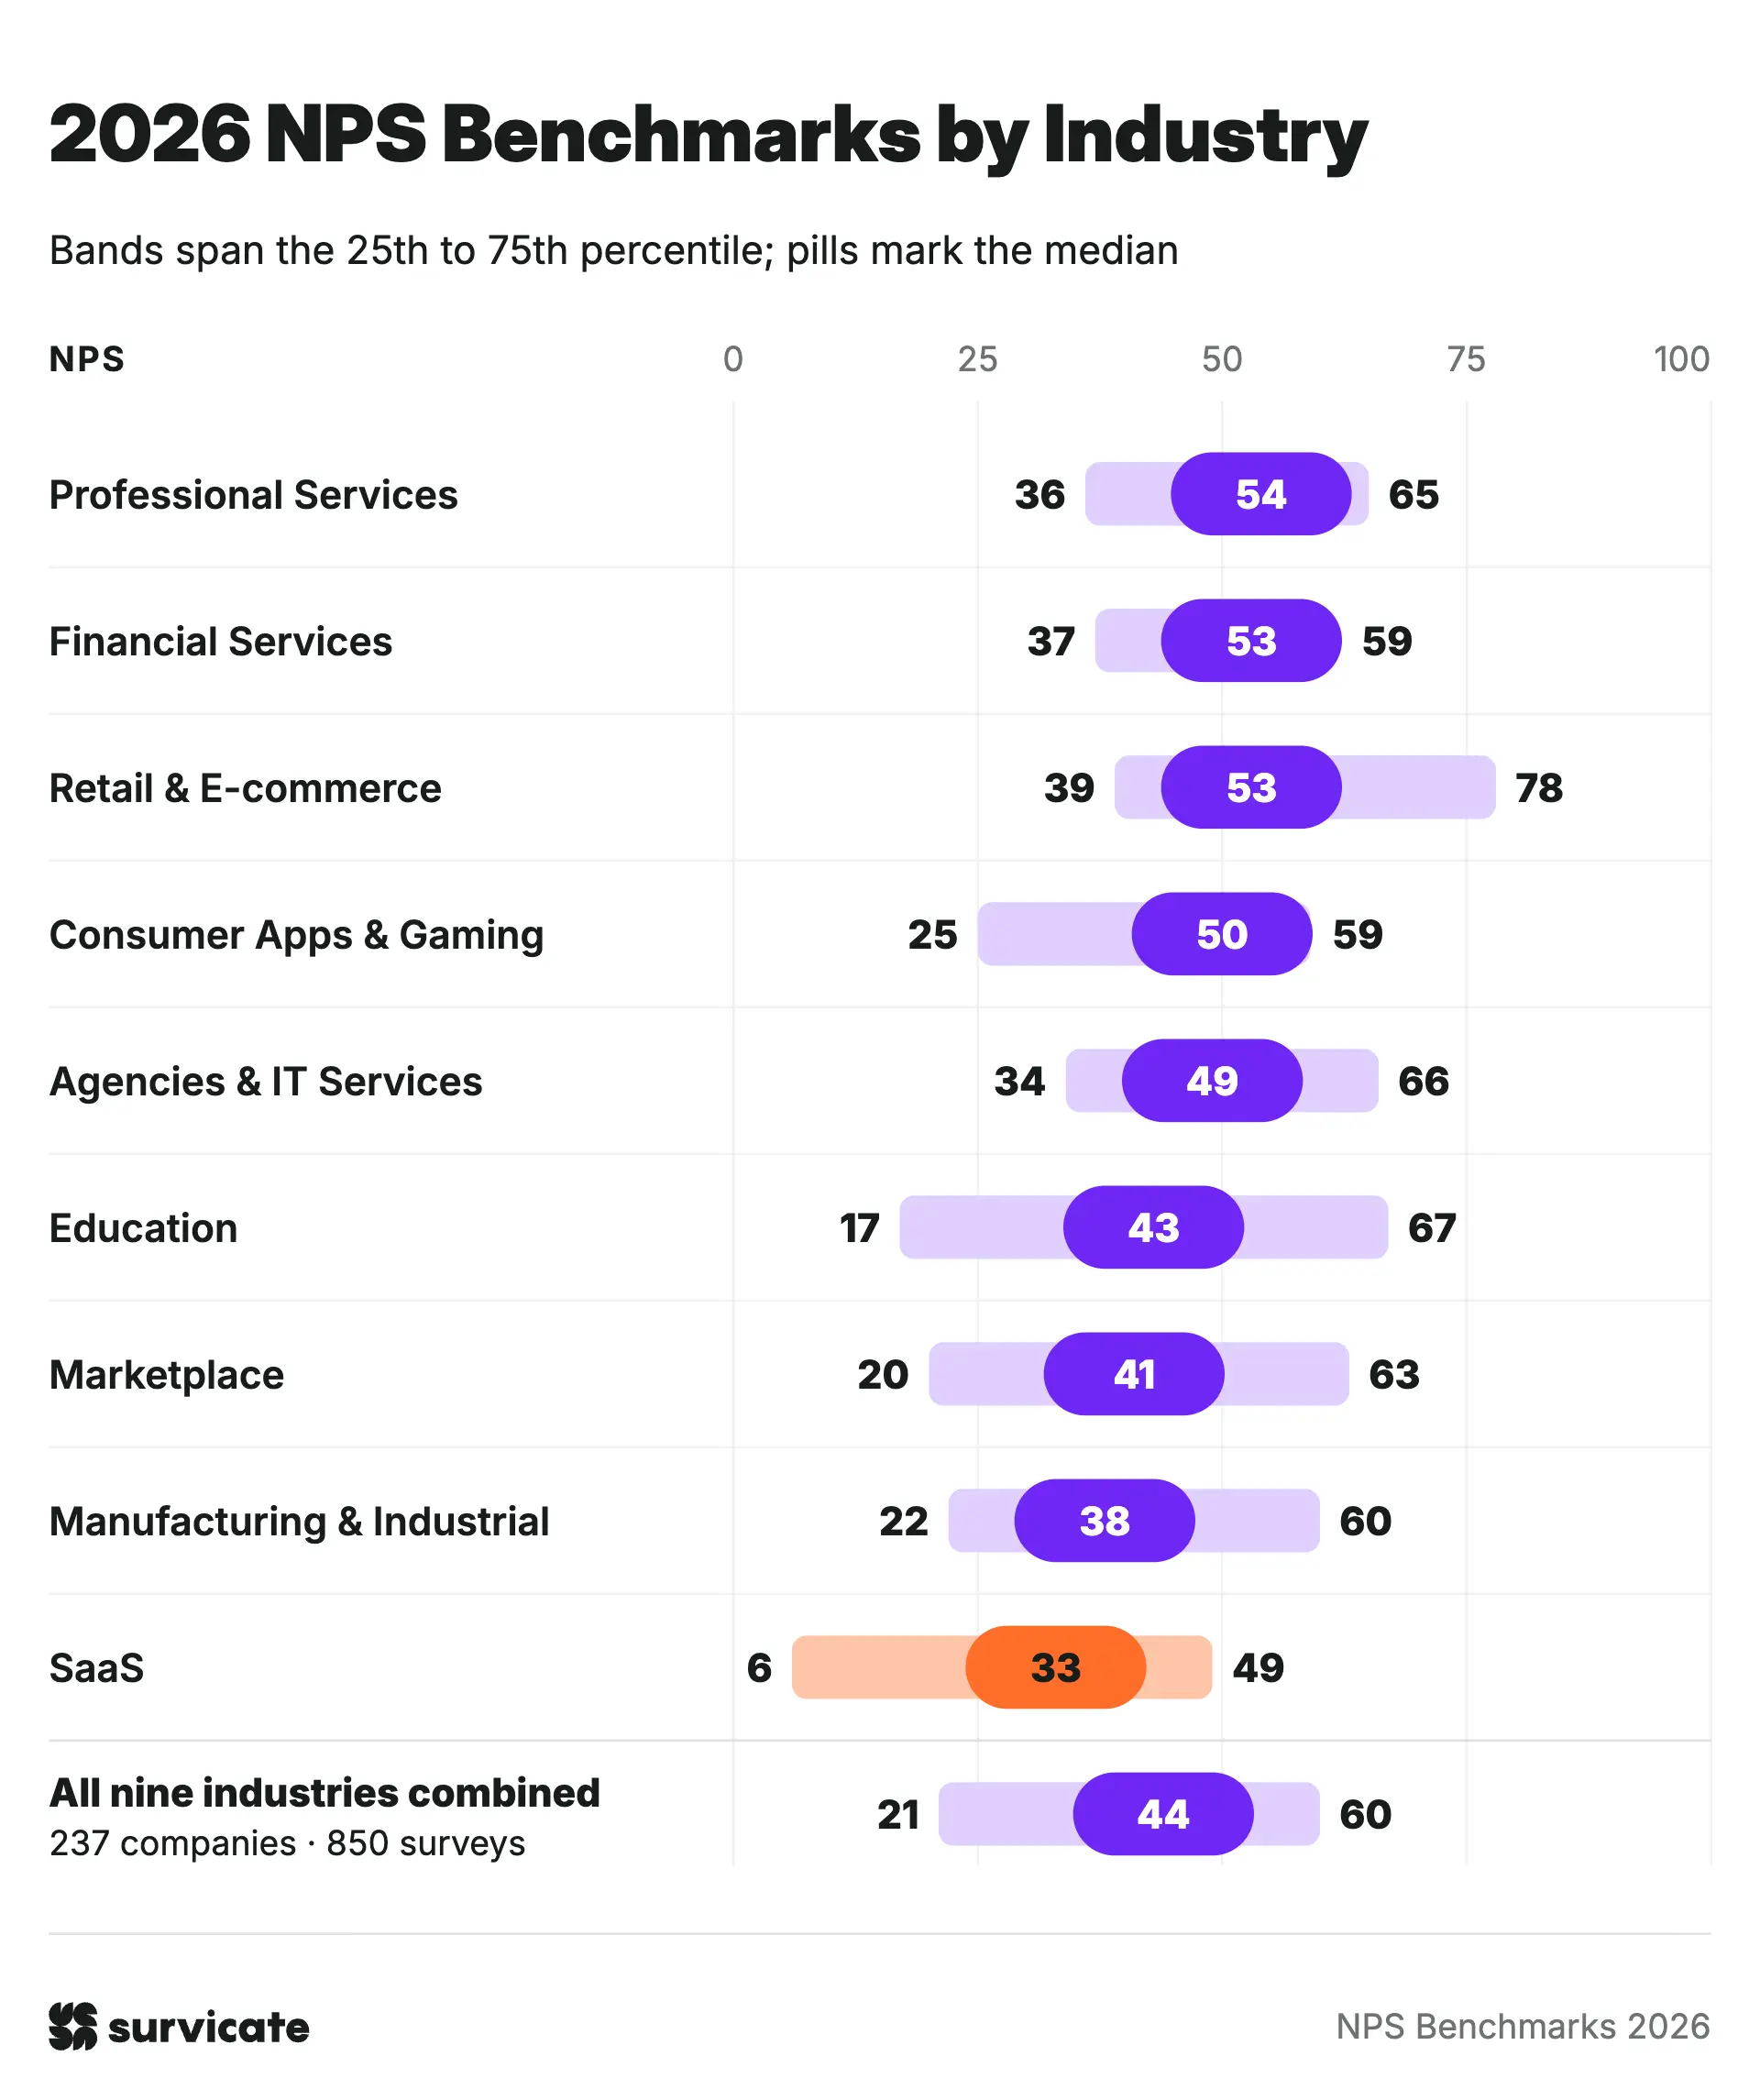
Professional Services, Financial Services, and Retail & E-commerce share the top spot at 53 to 54, sitting 8 to 9 points above the overall median of 45. Professional Services lands first on paper, though only by a fraction of a point so it is really a three-way tie at the top.
Retail & E-commerce has the strongest top performers in the dataset. A quarter of retailers score above 78, making it the only industry where the 75th percentile clears 70. So a score in the high 70s is achievable in retail, because a quarter of the companies in our sample already get there.
In the middle, Consumer Apps & Gaming (50), Agencies & IT Services (49), and Education (43) sit fairly close to the overall benchmark. Education rests on exactly 8 companies, though, so treat that number with a bit of caution. Further down, Marketplace (41) and Manufacturing & Industrial (38) round out the lower tier.
SaaS sits at the very bottom with a median of 33, which is more than 20 points behind the leaders. It is also the most reliable result in the table (76 companies, 387 surveys). A quarter of SaaS companies score below 6, meaning they have nearly as many detractors as promoters.
Why SaaS scores lower than every other sector
B2B overall got better scores between 2021 and 2026, and SaaS didn't. Its median has sat around 33 in every edition. Low scores may have become normal in SaaS, but I think a bigger part is how SaaS companies ask.
In-product surveys reach every end user, not just buyers. Most SaaS companies survey inside the product, so they hear from everyone, including people who never chose the tool. For example, one of our largest customers has over 300 users in Survicate, and we record a response from someone there almost daily. Generally, the scores are good, but occasionally someone leaves a 1 or 2 about a missing feature or minor confusion.
On paper, that puts their health score near the bottom of our accounts. Yet in outcome reviews, the people running the program tell us their survey results have improved since moving to Survicate, more people in the company see the feedback, and they are very happy. Our own surveys aren't NPS, as a matter of fact, but when a company uses NPS to measure general satisfaction, this exact dynamic plays out.
Bad survey timing interrupts a quick task. Logging into a tool after weeks away just to get one quick thing done, only to get hit with an NPS pop-up right away, is bound to get you a low score. This will happen even when the overall experience is fine, because the person is rating the interruption, not the product.
Why the combined median differs from the headline benchmark
The nine industries in the next table cover 237 of the 265 total companies, which is why their combined median (44) sits one point below the headline 45.
The other 28 companies sit in six categories that fell below the 8-company reporting threshold: Events, Sports & Membership Orgs; Healthcare; Media & News; Public Sector & Non-profit; Telecom & Utilities; and Travel & Hospitality. Healthcare and Media were in last year's report, and they are off this year's list simply because neither hit the 8-company mark in the 2026 sample.
Industry NPS benchmarks 2026 vs. 2025 vs. 2021: Big gains in finance, big drops in manufacturing

Marketplace gained the most since 2021, climbing 15 points from 26 to 41, and Financial Services rose 13 points from 40 to 53, which puts it in the top tier. Marketplace is also down 8 from 2025, so most of its climb came before last year and part of it has already reversed. Consumer Apps & Gaming also gained 9 points overall, with almost all of that movement happening over the past twelve months.
Two sectors barely moved across all three snapshots. Professional Services stayed between 51 and 54 in every period, and SaaS stayed between 29 and 33, so I read SaaS's low score as a persistent pattern, not a one-year dip.
On the downside, Manufacturing & Industrial saw the steepest drop, losing 12 points in a single year and 14 points since 2021. It is the only industry clearly down across both comparisons. Agencies & IT Services (−11) and Retail & E-commerce (−7) also pulled back from their 2025 peaks, though Retail still sits comfortably near the top of the rankings.
Disclaimer: Changes are calculated from the displayed whole numbers. Education has no 2025 value because only 6 companies qualified that year.
Disclaimer: Each year has a different set of companies, and Manufacturing (9 companies in 2025, 14 in 2026) and Education are the most sensitive to that.
Manufacturing & Industrial rests on just 9 companies in 2025 and 14 in 2026, while Education sits right at the 8-company cutoff in 2021 and 2026, and dropped off the 2025 table entirely after falling to 6 companies. Notice, however, that all these samples are relatively small, so we should treat them as year-by-year snapshots rather than industry-level trends.
By contrast, SaaS has by far the most companies in every period (76 to 95 companies, with survey volume climbing to 387 in 2026), followed by Retail & E-commerce (33 to 44 companies). That's why I trust SaaS and Retail more than a sharp one-year jump in a smaller category.
Use industry benchmarks to see roughly where you sit, not to set strategy. The most reliable benchmark is your own score from the previous period, because it's the only one measured on your own customers.
B2B vs B2C NPS benchmarks: 2026 vs 2025 vs 2021
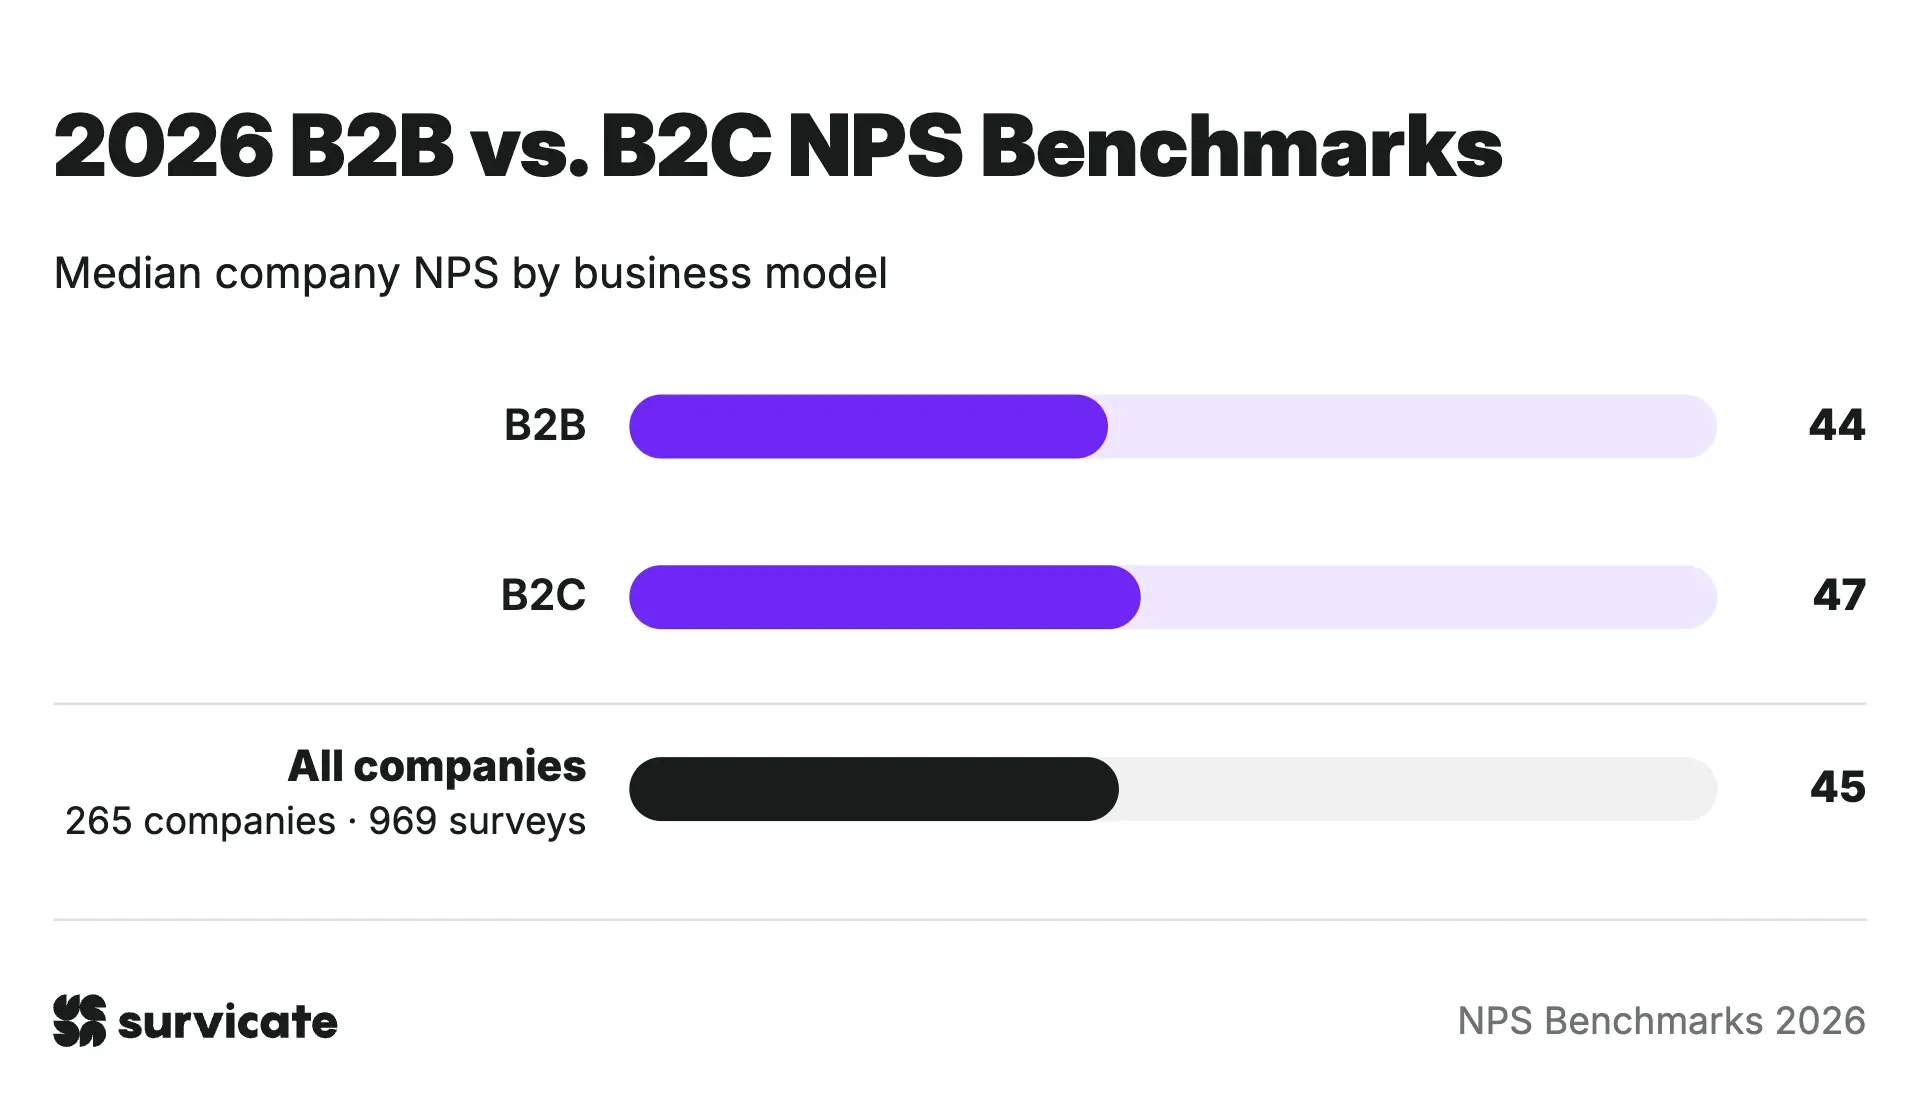
B2C companies have a slightly higher median NPS than B2B companies in 2026, but the difference is only three points.
The gap between B2B and B2C is also much smaller than it was in 2021:
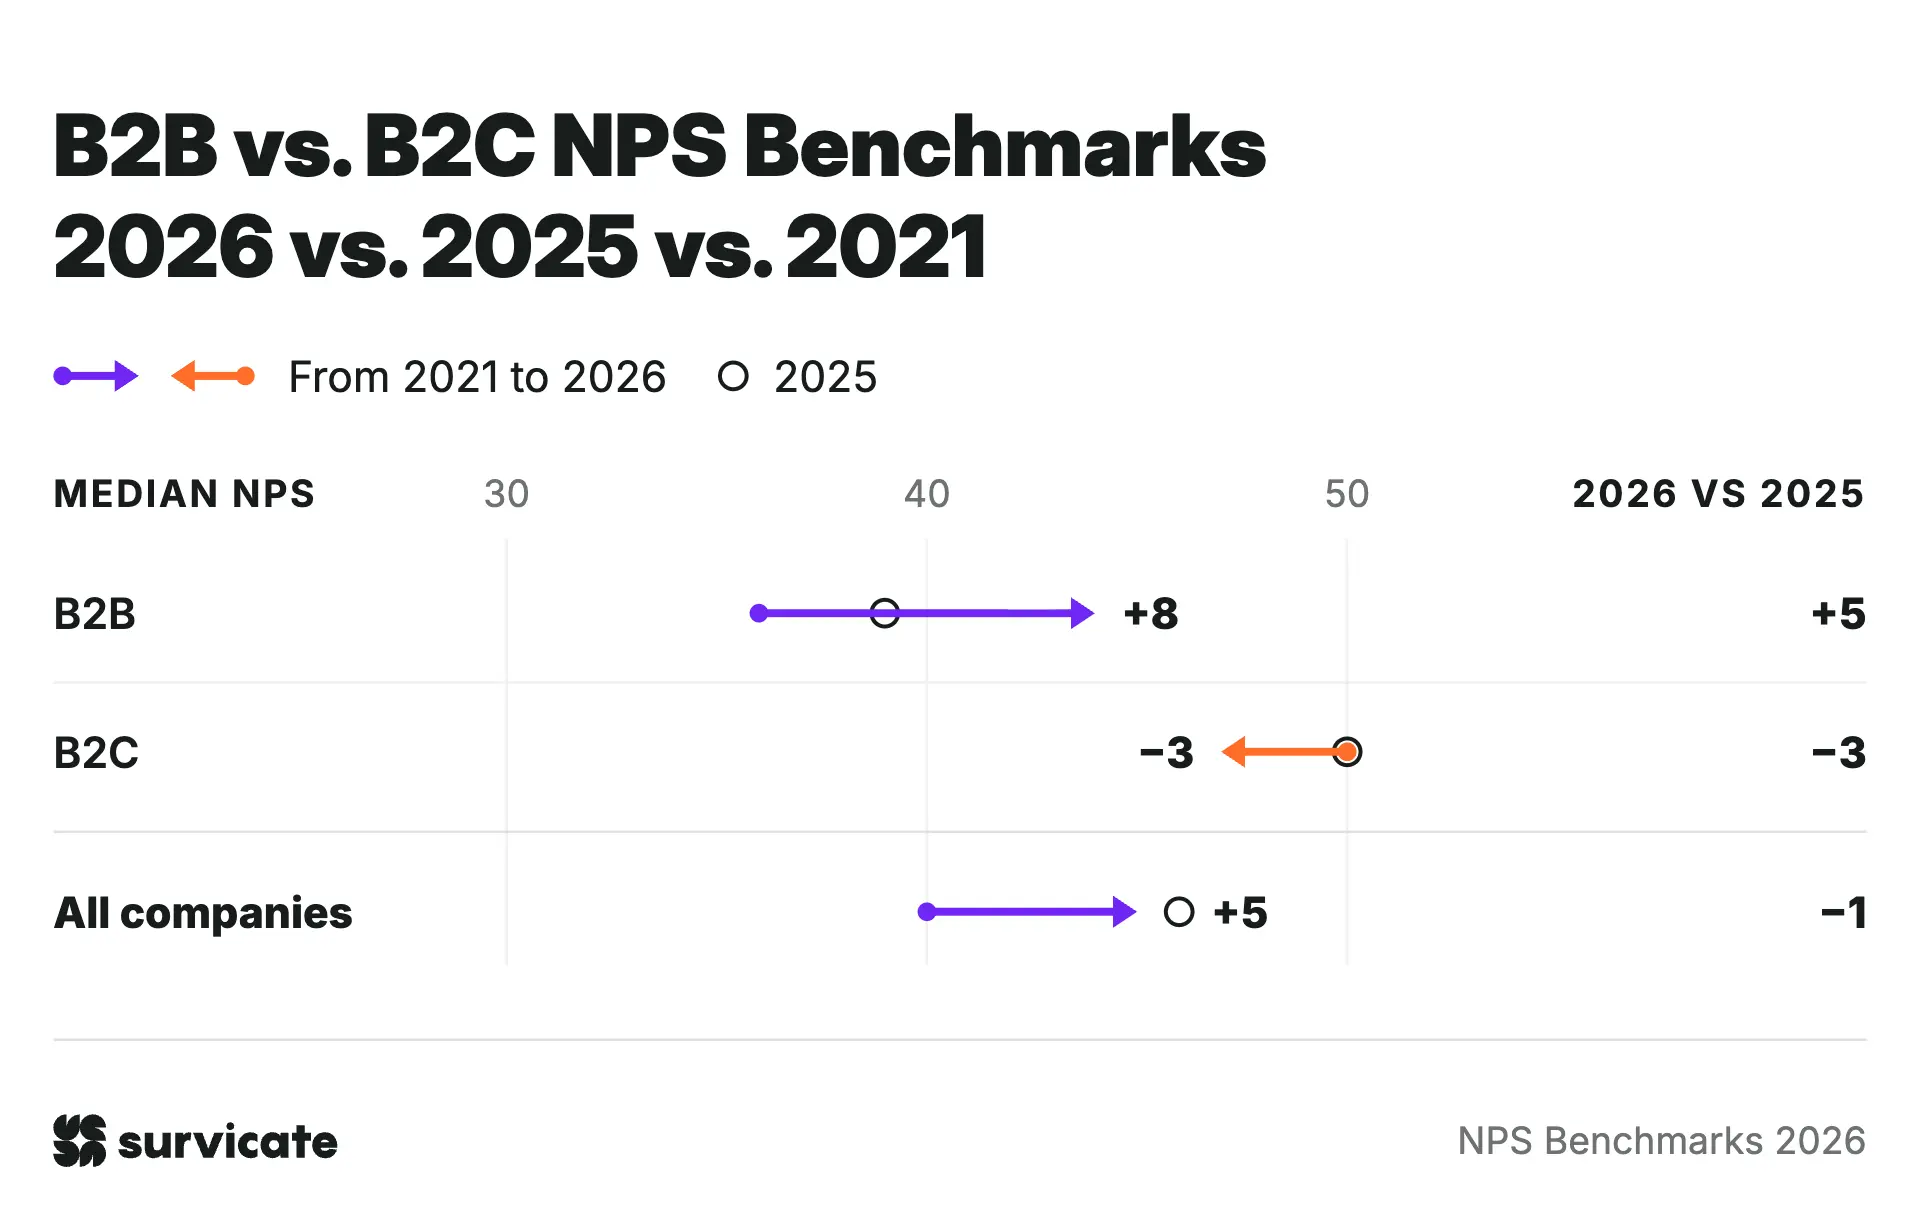
That pattern is consistent with B2B companies in our sample improving relative to B2C, but I wouldn't claim that B2B has improved across the market as a whole.
We didn't track the same companies across all three years, so changes in which companies appear in each sample may explain part of the difference. Each group includes more than 100 companies in every snapshot, which makes the comparison useful, but it doesn't remove that limitation.
So, while it's possible that B2B customer experience has improved over this period, we don't have the same-company data to say that definitively. That’s why it’s worth treating this as individual results for each year rather than proof of an industry-wide trend.
What is a good Net Promoter Score, then?
The median company NPS is 45, while the bottom quartile starts at 24. Our 2026 data supports 30 as a reasonable benchmark, although most companies in our sample score higher.
SaaS is the only industry close to the bottom quartile, with a median NPS at 33. Scores above 70 are much harder to achieve: Retail & E-commerce is the only industry where the 75th percentile reaches that level, at 78.
In general, an NPS above 0 is positive, 30 or higher is good, and a score above 70 puts you among the best-performing companies.
If your NPS is high, put it to work:
- Ask satisfied customers for testimonials and feature them in your marketing.
- Interview your happiest customers and turn their experiences into case studies.
- Launch a referral or affiliate program.
- Use customer loyalty as a selling point when talking to prospects.
Don't settle for a score below 0, even if your industry benchmark is lower. A negative NPS means detractors outnumber promoters, which is a good reason to investigate what's going wrong. Add a follow-up question asking customers why they gave that score. The number tells you where you stand, and their answers help you understand what needs to change.
The best benchmark is still your own historical performance.
Track your NPS over time and compare each new result with your previous scores. Industry benchmarks provide useful context, but they don't tell the whole story. For example, Manufacturing & Industrial dropped 12 points between 2025 and 2026, while Consumer Apps & Gaming gained 8. A broader market shift can make your own performance look better or worse than it really is. Your historical data helps you separate the two.
Factors to consider before benchmarking your NPS
An industry benchmark gives you a reference point, but it's not a verdict on your customer experience. Before deciding whether your score is good or bad, consider three factors that can influence how customers rate the companies they buy from.
Competition intensity matters
Customers have more alternatives in some industries than others. When switching providers is easy, a poor experience can push them toward a competitor. In markets with fewer alternatives or higher switching costs, customers may be less likely to give up on their current provider, even when they're not entirely satisfied.
SaaS is the clearest case in our data.
It has the lowest median NPS of all industries in 2025 and 2026, and the second-lowest in 2021 after Marketplace: 33 in 2021, 29 in 2025, and 33 in 2026. I wouldn't say competition explains these scores on its own, since we don't measure competitive intensity. But it's a factor worth considering when comparing your NPS with companies in other markets.
External conditions impact satisfaction
Your customers don't experience your company in isolation. Economic downturns, political instability, pandemics, and environmental crises can all affect their expectations, priorities, and willingness to recommend a business.
Our 2021 results are a good reminder to consider this context. The median company NPS was 40 that year, compared with 46 in 2025 and 45 in 2026. The bottom quartile was also lower, at 14, compared with 16 and 24 in the following snapshots. The COVID-19 pandemic was one of the major external events during that period, but we can't attribute these differences to it alone.
Cultural and regional differences exist
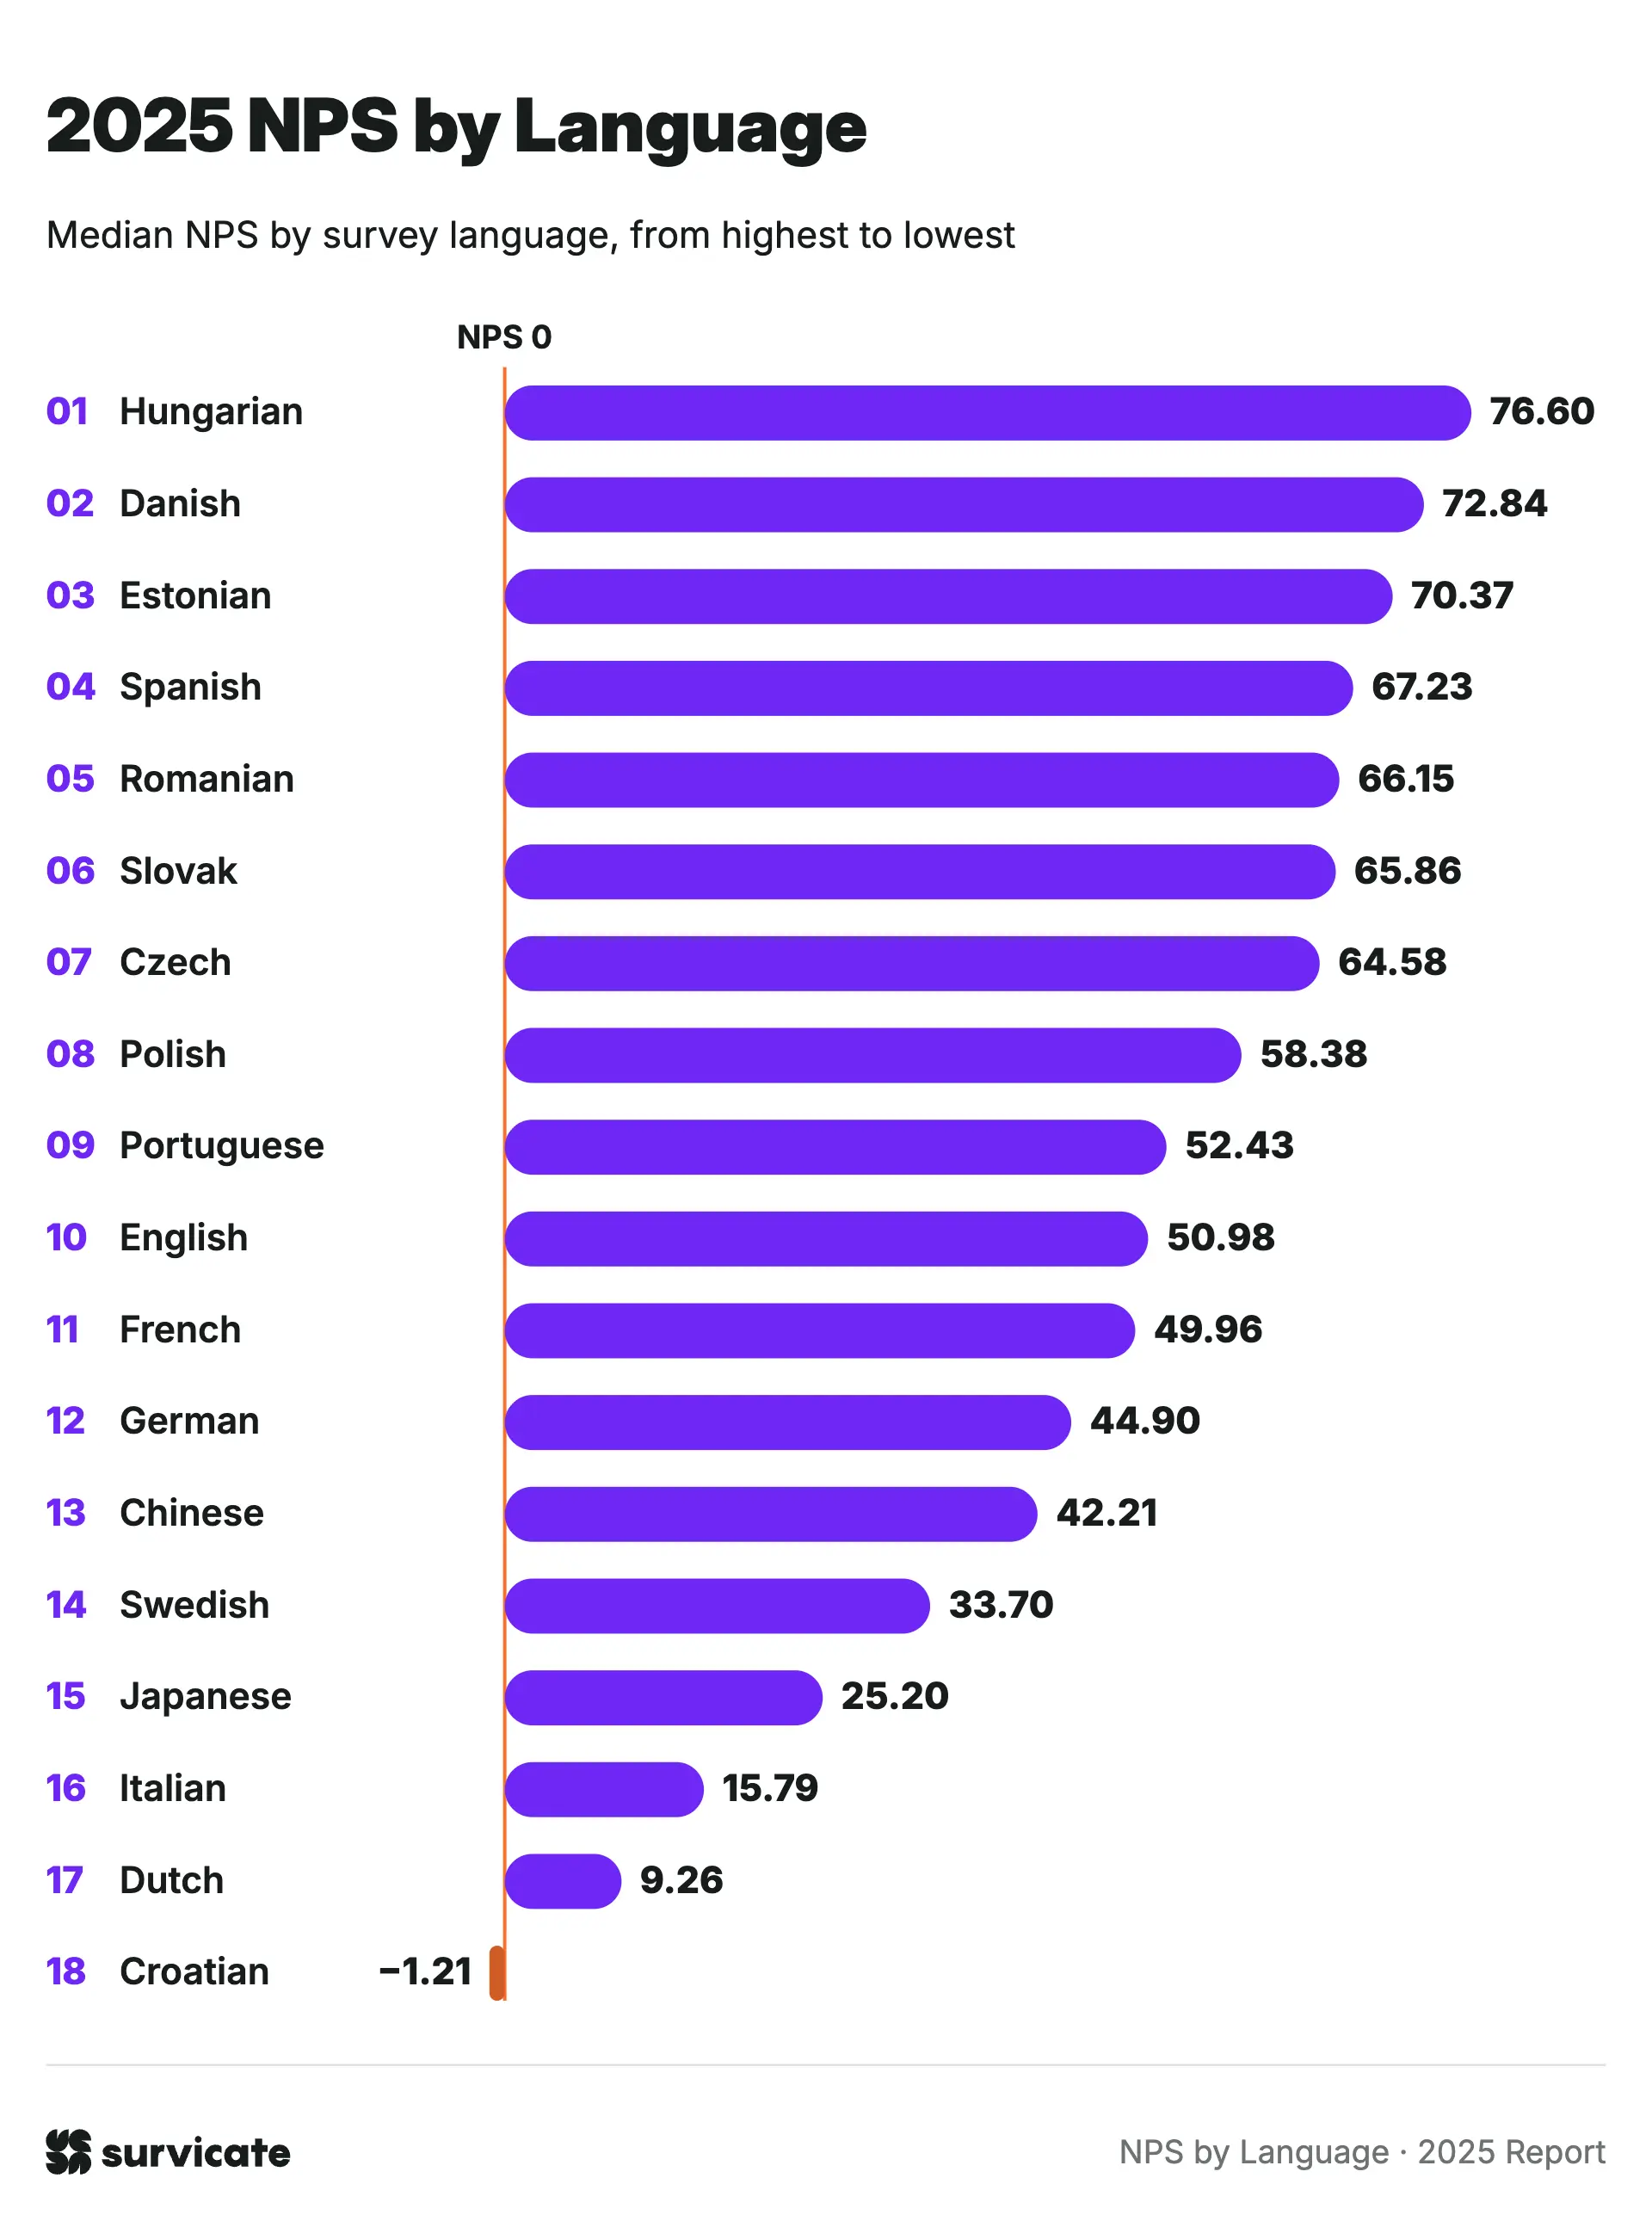
Customers in different countries don't always use the 0-10 scale in the same way. Some are more conservative with top scores, while others are more comfortable giving a company a 9 or 10. This can affect comparisons between markets, even when customers have similar experiences.
Our benchmarks aren't broken down by country or language, so they don't account for these differences. If you're collecting feedback across multiple markets, I'd compare results within each market before drawing conclusions. You can read more on the different scoring patterns in our report on global NPS by language.
Use industry benchmarks to see where you stand, and don't treat them as targets, because your industry, market conditions and customer base all move the score regardless of how good your CX is. I'd pay just as much attention to your own historical performance, because it shows if your customer experience is actually getting better.
How to create an NPS survey
Now that you know what the NPS landscape looks like for your industry, it's time to run your own NPS surveys. Make sure you follow NPS survey best practices:
- Keep surveys concise and logical
- Respond to and act on customer feedback
- Distribute surveys through your audience's preferred channels
- Include open-ended questions so customers can explain their scores and provide suggestions
- Run surveys regularly to track trends over time
Use customer feedback software for better results
Running NPS surveys with a dedicated platform like Survicate makes the entire process more efficient and sustainable. Customer feedback platforms let you collect feedback across multiple channels, analyze it from all sources, and take action through integrated tools, turning NPS benchmarking into an ongoing process that doesn't require a dedicated research team.
Then, you can monitor your results using an analytics dashboard, without having to prepare separate reports or calculating your Net Promoter Score manually or with a separate NPS calculator.
Collecting your NPS score is just the beginning. To truly understand the “why” behind your promoters and detractors, and turn that feedback into action, you need a system for analyzing and interpreting those responses. That’s where Survicate’s built-in analytics and research tools come in.
Centralize and categorize feedback with Research Hub
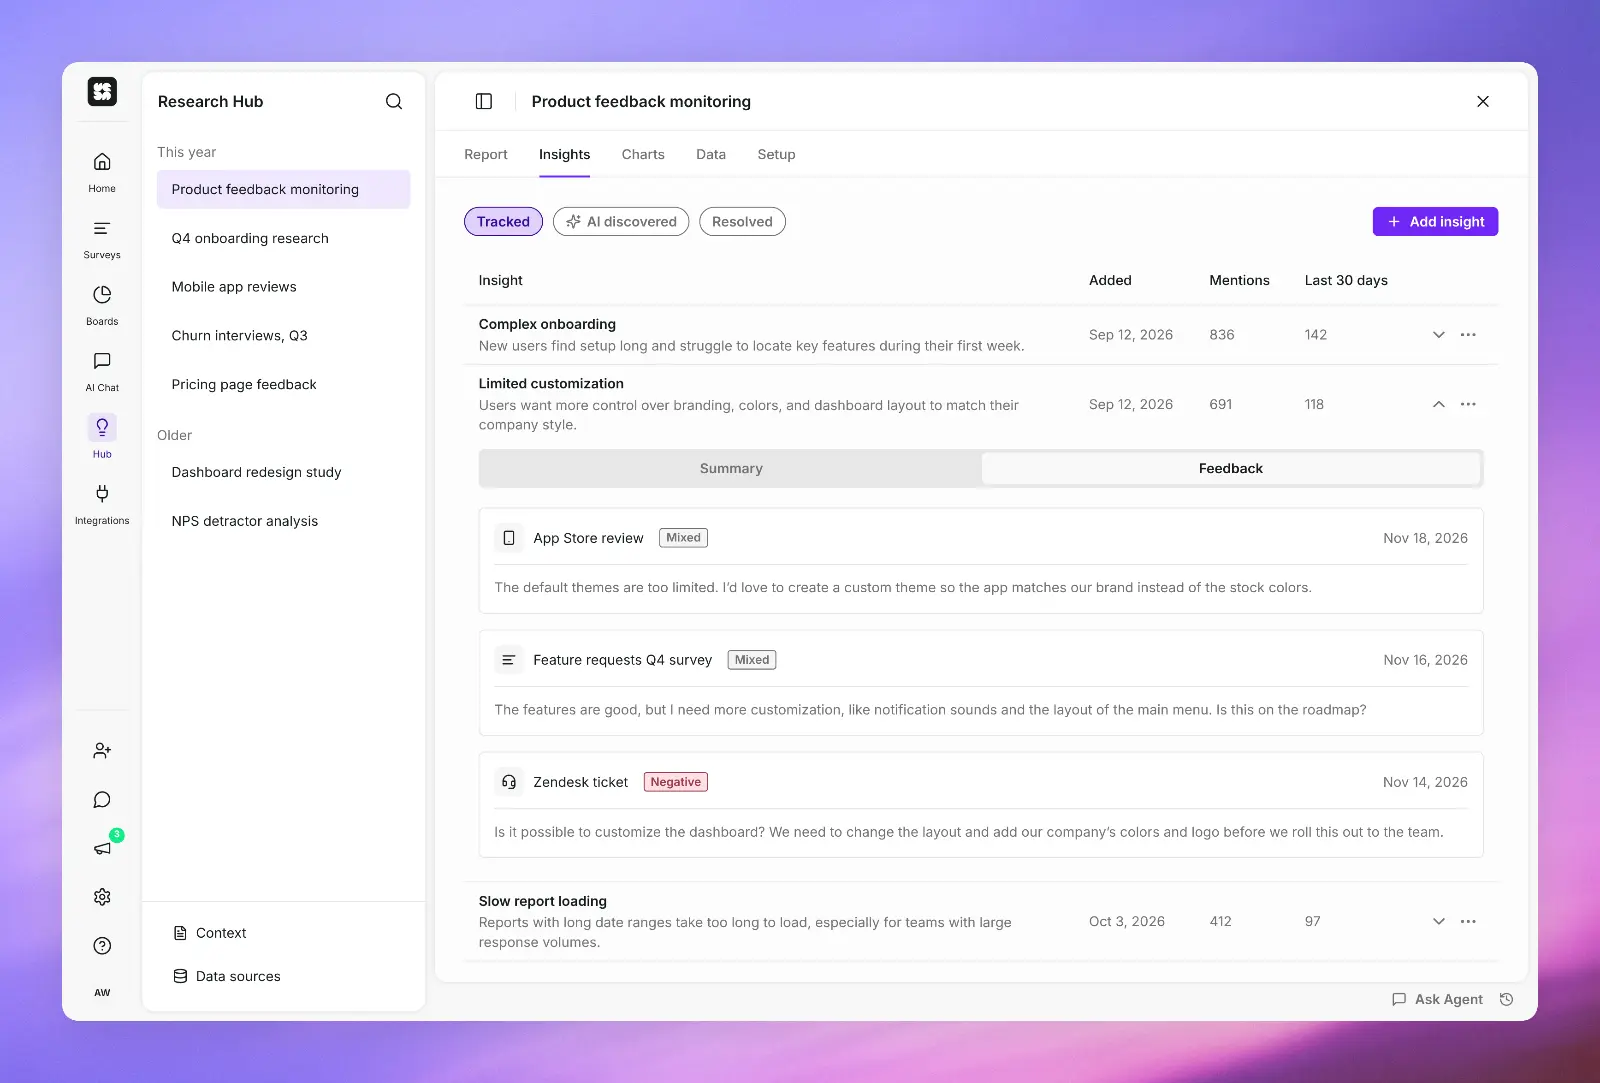
Research Hub automatically collects and organizes open-ended NPS responses alongside other feedback sources, like support tickets, app store reviews, and survey responses. Using AI, it groups them into relevant topics (e.g., onboarding, pricing, UX bugs), so you can spot trends, uncover blind spots, and validate product assumptions, without spending hours manually tagging feedback.
This is especially useful if you're running NPS surveys across multiple channels or teams. Whether you’re gathering feedback from your website, app, or email campaigns, Research Hub gives you a full picture of your customer sentiment in one place.
Monitor performance with real-time dashboards
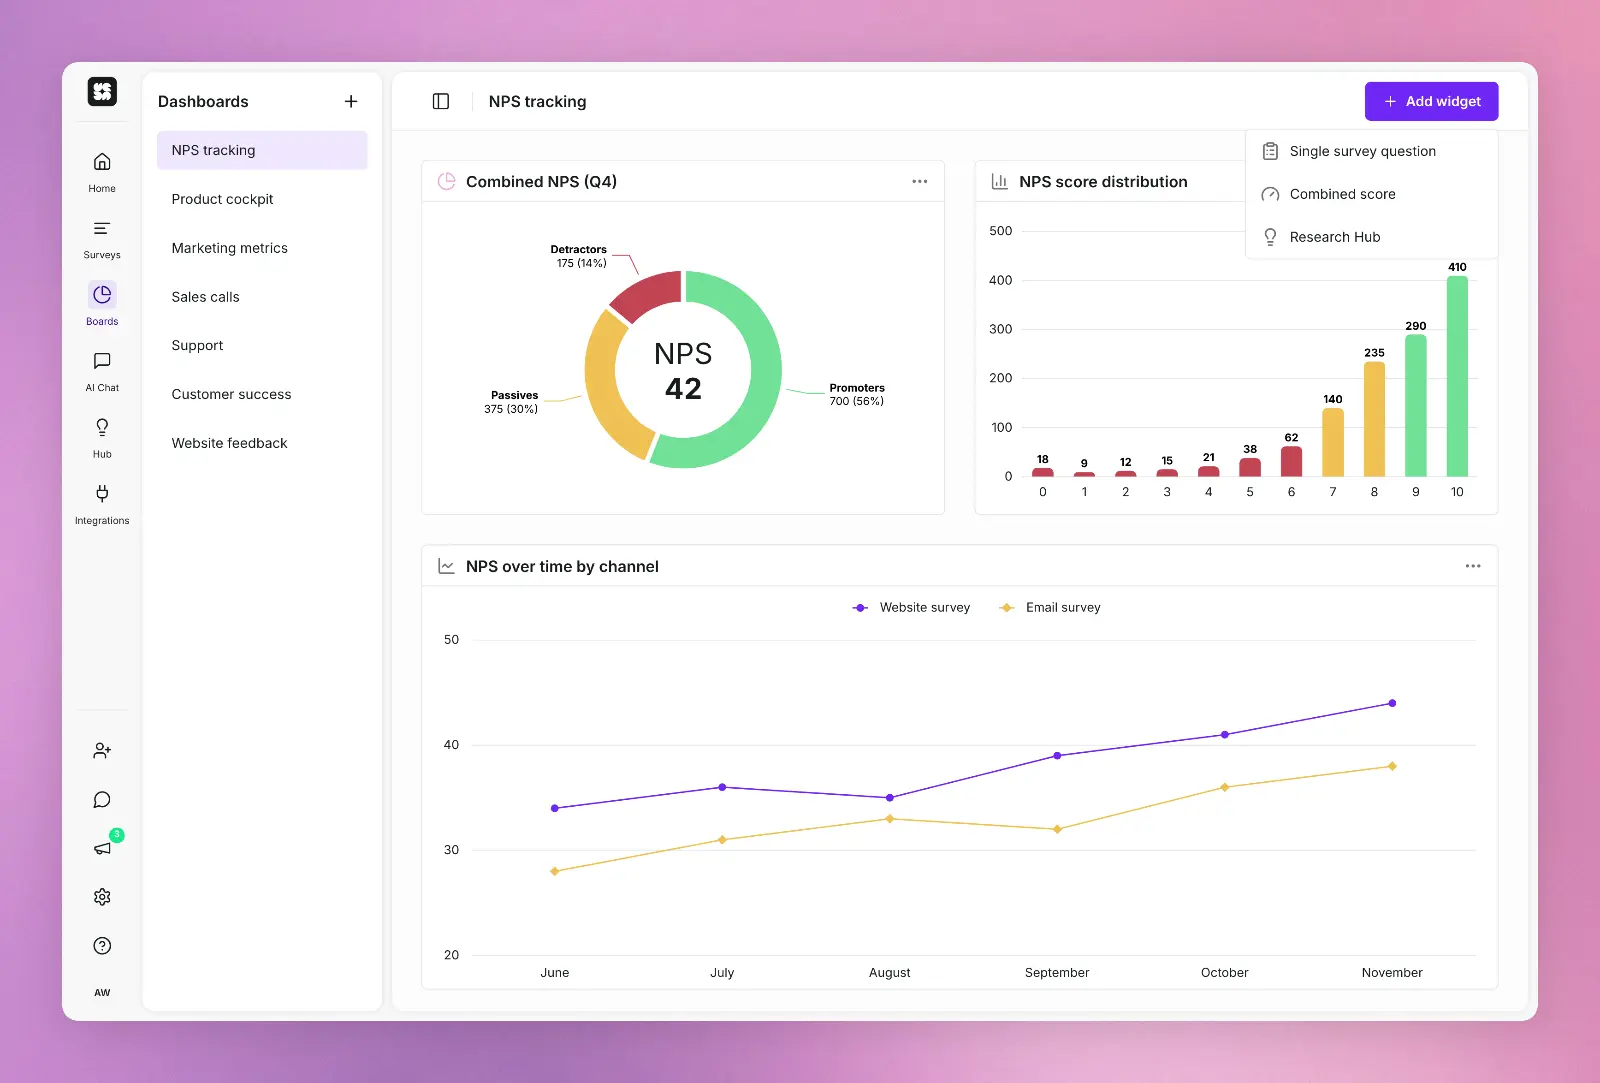
Need a quick snapshot of your latest NPS campaign? Survicate’s dashboards visualize everything in real time, from score trends and response volume to segment-level breakdowns. You can track how your NPS fluctuates over time, compare performance across campaigns, and quickly surface issues that need immediate attention.
Dashboards also help your team stay aligned. Share them with stakeholders or use them to benchmark progress during product sprints, marketing launches, or post-support improvements.
Go deeper with Survicate Agent
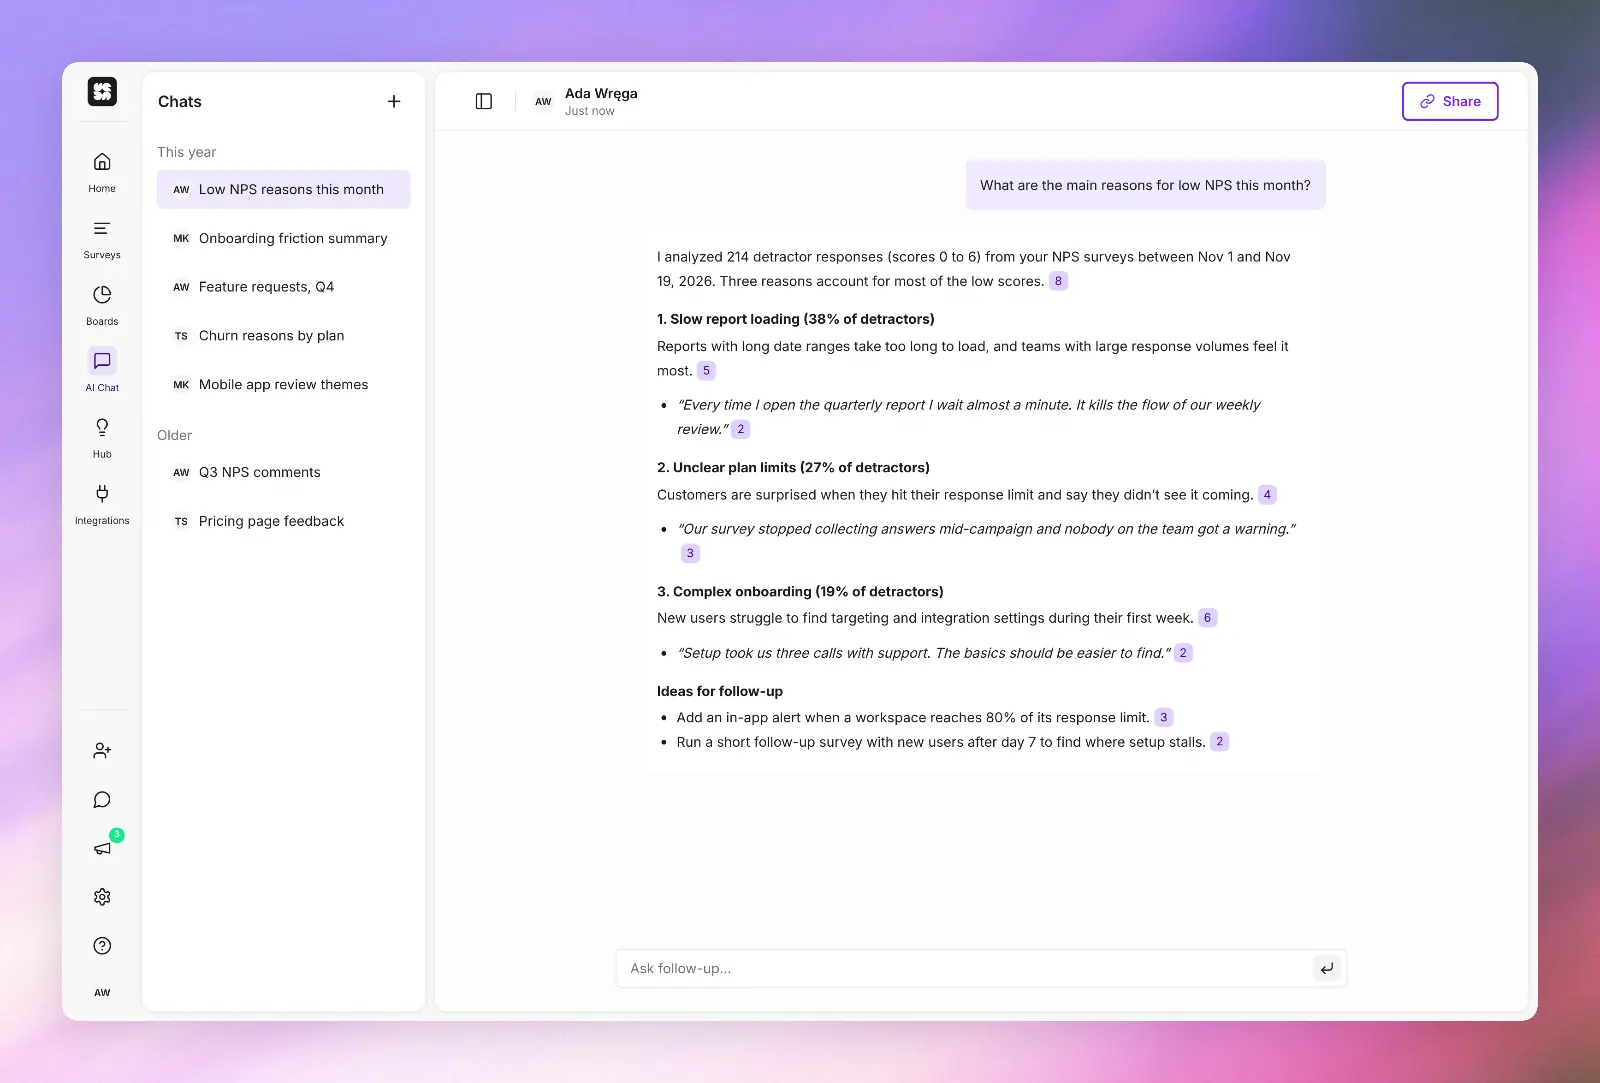
For deeper analysis, Survicate's agent helps you make sense of unstructured, open-text responses.
Just ask a question like “What are the main reasons for low NPS this month?” and you’ll get a clear, AI-generated summary backed by real customer quotes. It’s an easy way to get quick answers, identify actionable insights, or generate ideas for follow-up initiatives.
Support for multilingual NPS surveys
If you're collecting NPS feedback across different markets, Survicate also supports multilingual surveys with automatic translations. That means you can create a single NPS survey, deliver it in your respondent’s preferred language, and still analyze all feedback in a unified, translated dashboard. Research Hub and Survicate's agent work across languages too, helping you spot patterns globally, without losing local nuance.
And with a variety of available integrations, like HubSpot or Intercom, you can put your survey data in context, get deeper information on your client base, and, most importantly, act on the customer feedback you've collected.
Set up your own NPS benchmarks
Ultimately, your NPS is “good” only when it’s better than your previous one.
After running your first NPS survey, do your best to improve your customer experience, sort out the issues pointed out by your respondents, and make changes according to customer feedback. Then, re-run your survey and see if the NPS score rises.
If you notice significant NPS score improvements (over 5%), you’re on the right track. Continue re-checking if your score keeps rising. This way, you’ll likely grow your business, increase retention rate, and boost revenue.
If your score is continuously dropping, it’s time for you to act. Run follow-up surveys to figure out which parts of your business perform the worst and try to fix them.
Appendix: NPS survey completion rates (2026)
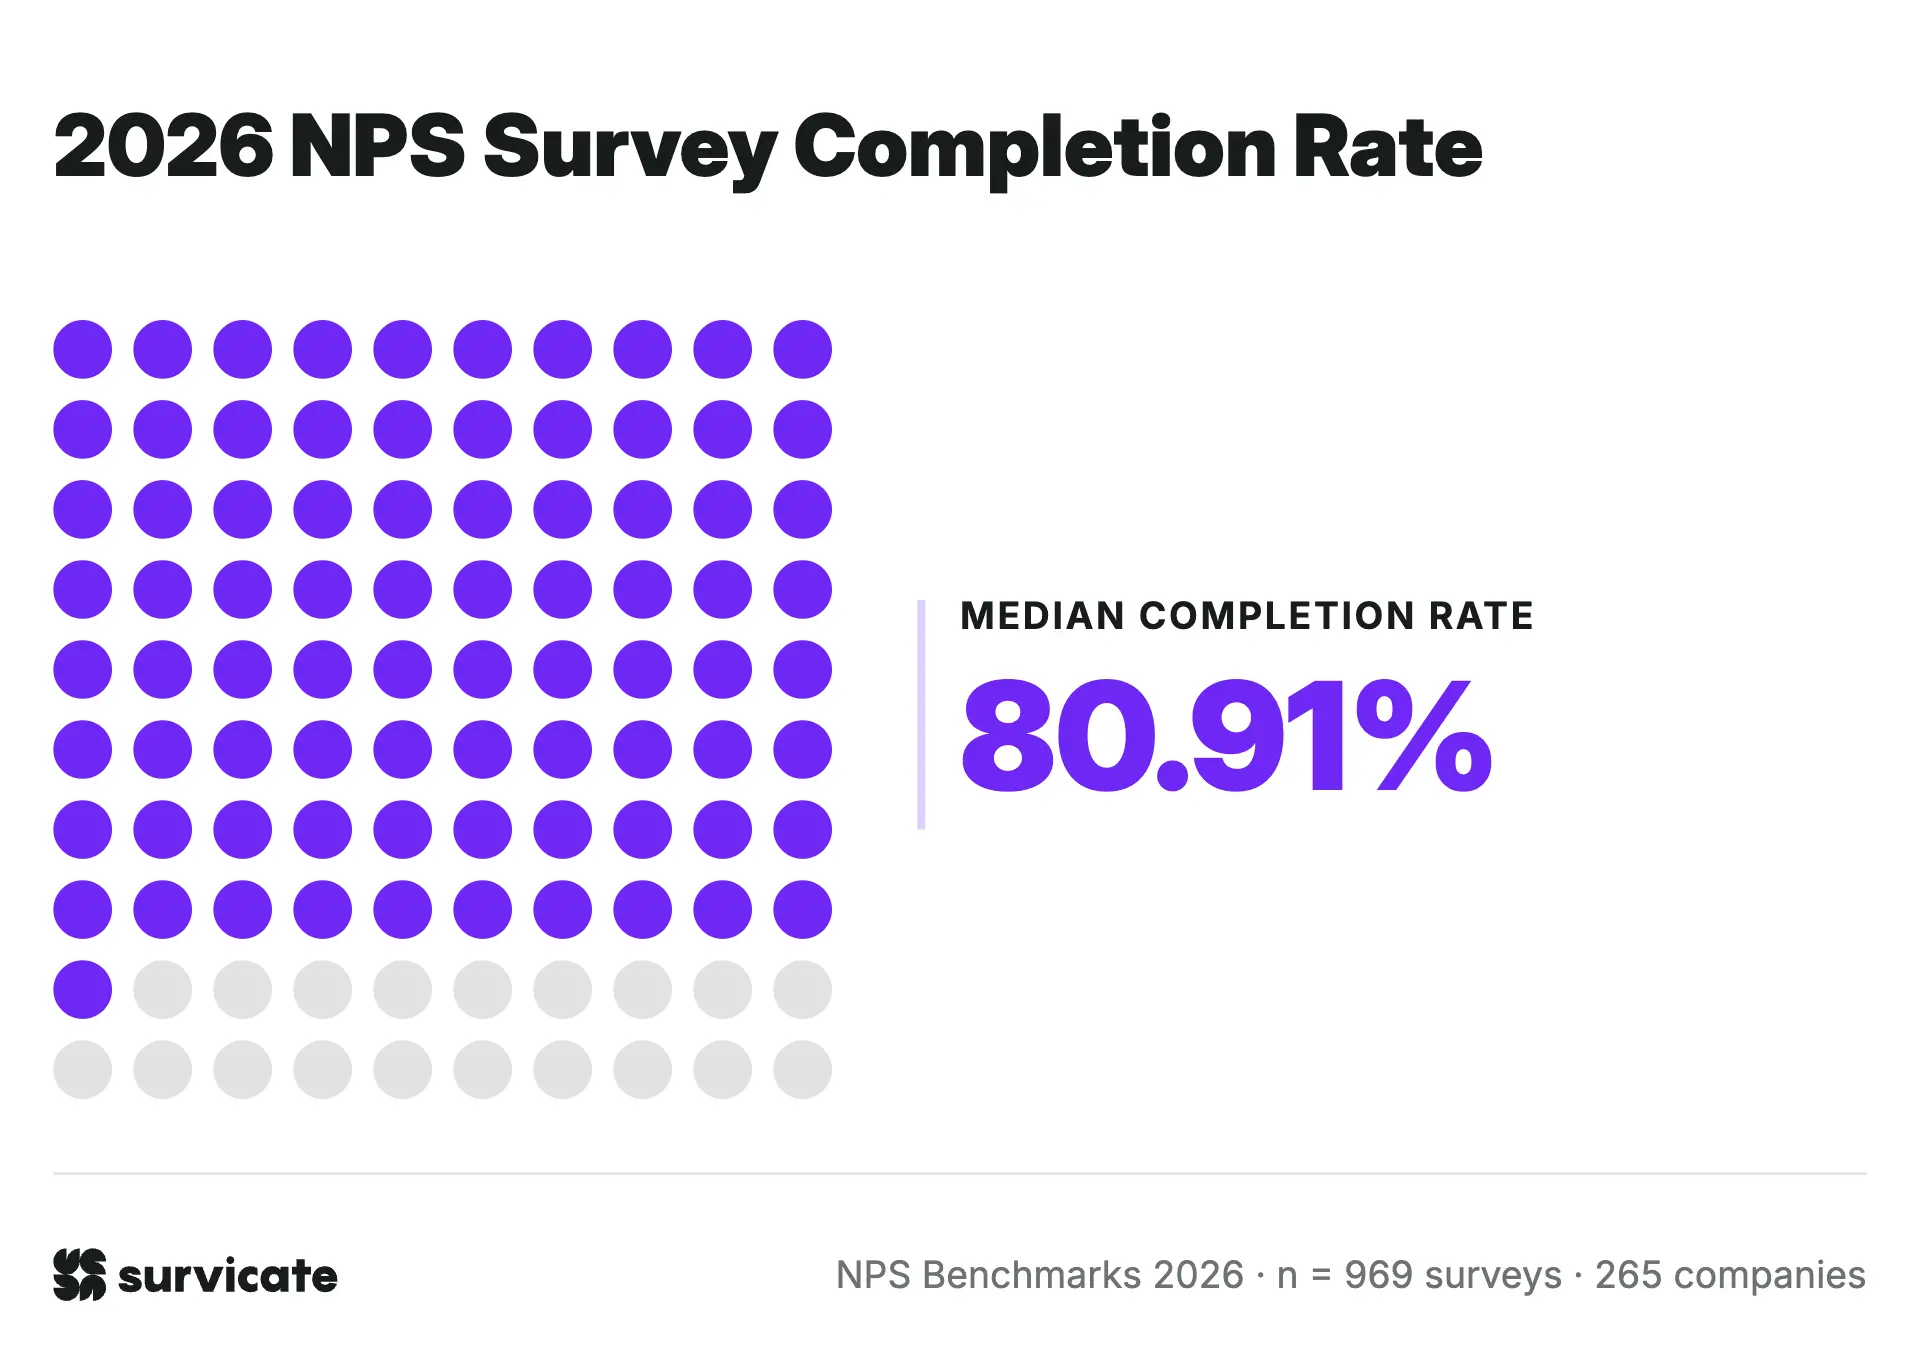
Your completion rate can tell you whether your survey placement, timing, and length are working. If it's well below the benchmarks, your NPS may reflect a narrow, self-selected group of respondents rather than a broader view of your customer base.
Track completion alongside NPS and compare both metrics with your previous results to see how they change over time.