You just ran a survey, which took your respondents 108 seconds to respond to. Is that normal?
When it comes to collecting feedback, guesswork leads nowhere. To maintain high completion rates and clean data, it helps to know if an audience can breeze through questions or if they stall along the way.
This report covers exactly what normal looks like. Based directly on real user behavior, these benchmarks break down survey completion time across the factors that matter most:
- Survey length. How question count impacts patience.
- Distribution channels. Standalone pages vs. website widgets vs. mobile apps.
- Question types and open-text load. The true time cost when users type answers.
- Industry benchmarks and business models.
Think of this report as a practical playbook. Use these baseline numbers to audit current surveys, spot hidden friction points, and design future feedback campaigns that respect respondent time and maximize completion rates.
How is completion time calculated?
Before we discuss the methodology, let’s explain how we measure completion time in Survicate. We define completion time as the median time it takes to respond to a survey, across all respondents. This doesn't assume each and every respondent completing the survey.
Rather, we measure the time spent until the last question is answered (not necessarily the last question in the survey) or the survey is closed.
This broader measure of completion time allows us to understand how much time people actually invest in a survey, including those who engage meaningfully but drop off before the final question.
Curious about the technical details behind how these metrics are tracked? Check out the full breakdown in the Survicate Help Center article.
Methodology
Here’s how we selected the data for the report to make sure it’s as comprehensive and objective as possible:
- For the 2026 report, we analyzed data from 1,044 unique companies that ran 7,677 surveys throughout the year 2025.
- All data comes from paying Survicate customers to ensure the benchmarks reflect real, professional use cases.
- We only included surveys with 30+ responses to minimize the margin of error and eliminate accidental tests or incomplete campaigns.
- Surveys with an average completion time longer than 1 hour per question were excluded to avoid skewing the results due to inactivity or abandoned sessions.
- For breakdown analysis, each separate category had to contain data from at least 30 unique surveys to ensure statistical relevance.
- All data was completely anonymized to protect customer privacy.
- Except for micro surveys (where multiple sources confirm a consensus threshold of up to 3 questions), there is no official industry standard for defining survey length buckets. We determined our categories based on data distribution to maintain statistically meaningful sample sizes, and respondent experience to reflect distinct levels of effort.
- We report median scores and percentiles. The median is often more reliable than the average because it's less affected by extreme outliers. A few very high or very low scores won't skew the overall picture. When calculating median values in seconds, results that included decimal places were rounded to provide clearer and easier-to-interpret figures.
How we selected the right threshold
To prove that our baseline threshold of 30+ responses didn't accidentally warp the findings, we tested the median completion time against increasingly strict filters. As you can see, whether the bar is set at 30 responses or a strict 100+, the median completion time remains incredibly stable:
Key findings
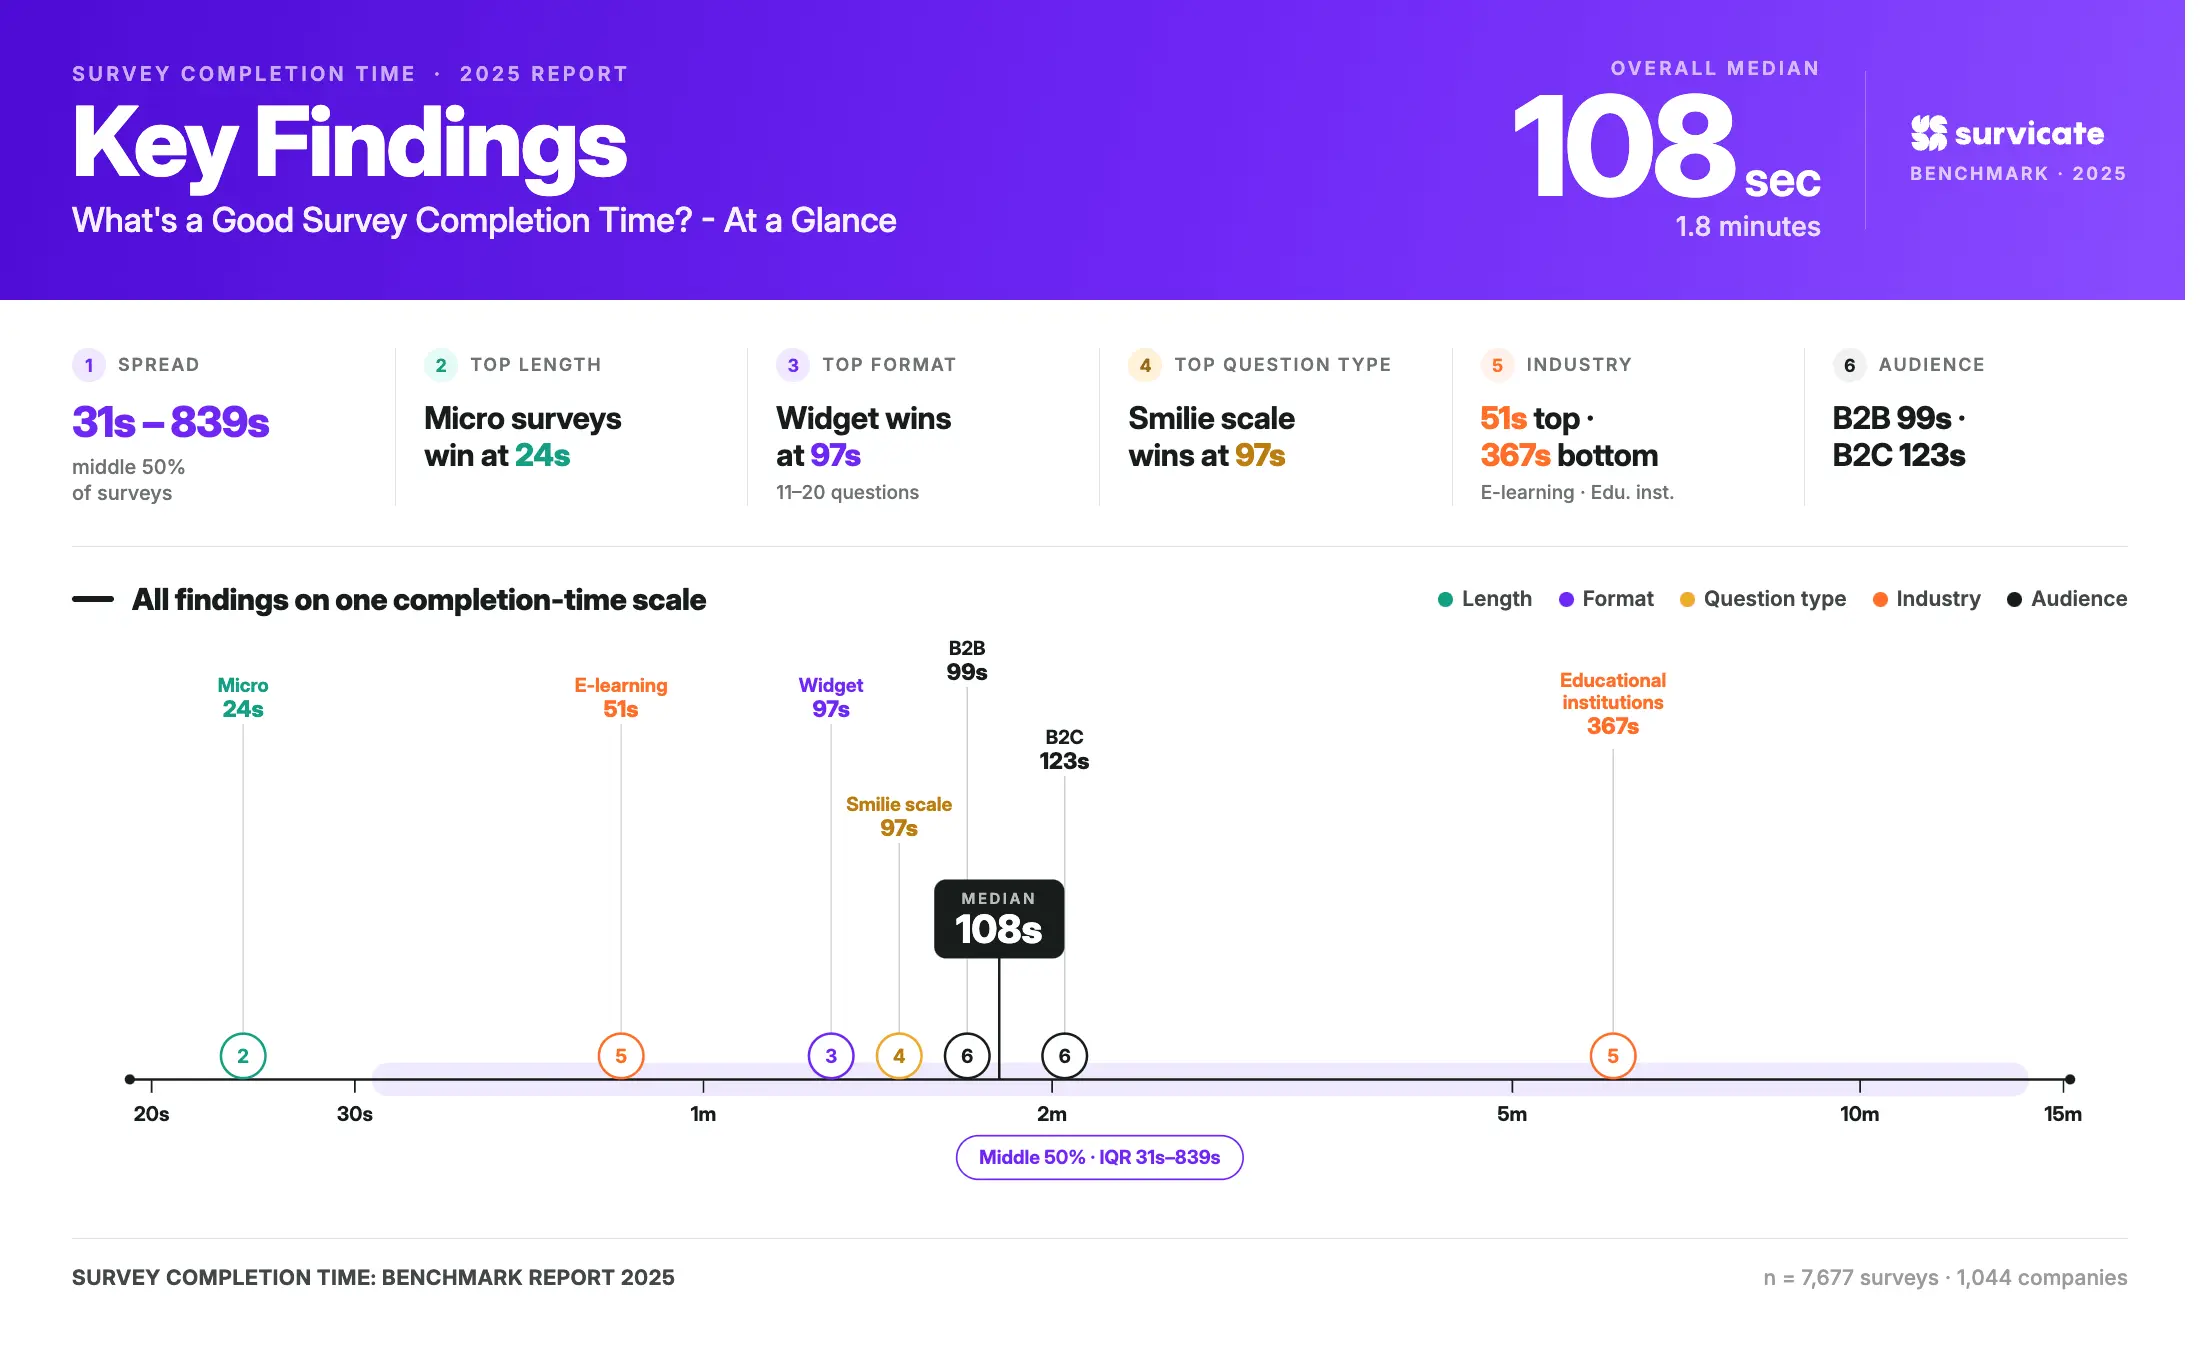
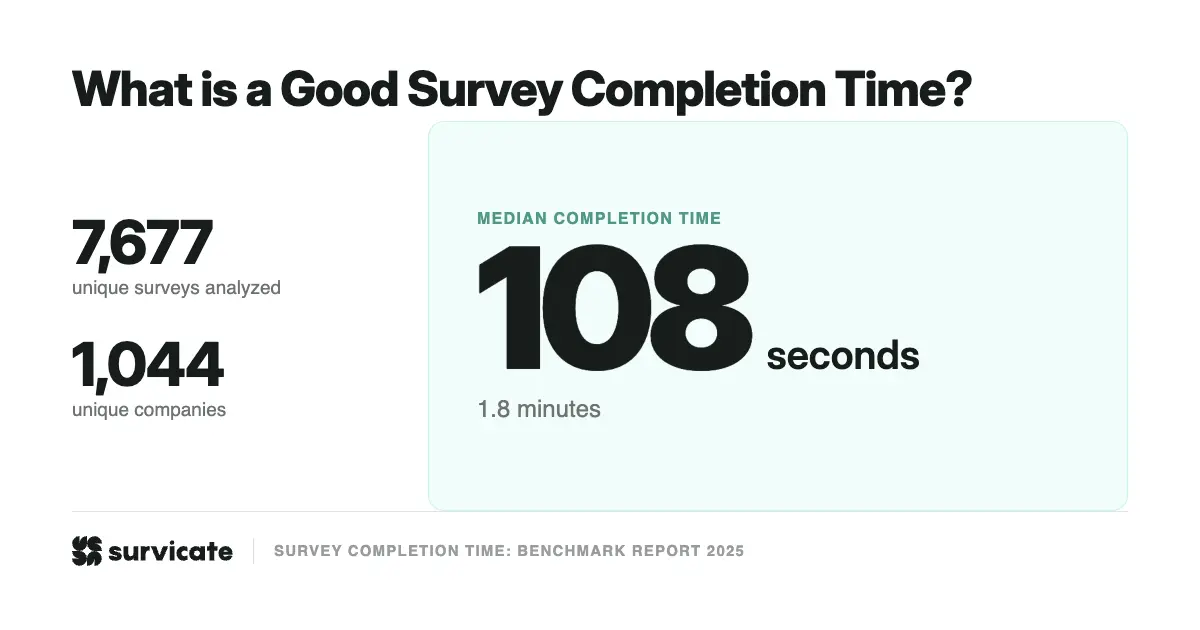
- The typical survey takes 108 seconds to respond to.
Across 7,677 surveys from 1,044 companies, the median completion time is 108 seconds (1.8 minutes). However, this benchmark is heavily influenced by shorter surveys, which make up the vast majority of the dataset. Nearly 75% of surveys contain 10 questions or fewer, while 92% contain 20 questions or fewer.
- Survey length has the biggest impact on completion time.
Completion time rises sharply as surveys get longer. Micro surveys (1-3 questions) record a median completion time of just 24 seconds, while long surveys (21-30 questions) reach 1,088 seconds (18.1 minutes). At the upper end of the dataset, surveys with 51+ questions take a median of 2,452 seconds (40.9 minutes) to complete.
- Page surveys take up to 5x longer to respond to than widgets and mobile surveys.
The gap between survey channels widens as surveys get longer. For medium-length surveys (11-20 questions), page surveys record a median completion time of 672 seconds, compared to 97 seconds for widgets and 139 seconds for mobile surveys. Across every length bucket in the dataset, page surveys take longer to respond to than widget or mobile surveys.
- Open-text questions add substantial time to survey completion.
Surveys with no open-text questions record a median completion time of 41 seconds. Adding a single open-text question increases that figure to 72 seconds, while surveys with 6-10 open-text questions reach 404 seconds. The largest jump occurs between the 3-5 and 6-10 open-text question groups, where median completion time increases by 120%.
- Question type matters more than many survey creators expect.
Smiley scale questions record the shortest median completion time at 97 seconds, followed by single selection and rating questions at 107 seconds. At the other end of the spectrum, matrix (400 seconds), dropdown (530 seconds), and ranking questions (633 seconds) record the longest completion times. Notably, text answer questions sit much closer to the faster question types, with a median completion time of 114 seconds.
- Completion time varies by more than 7x across industries.
Industry benchmarks range from 51 seconds in e-learning to 367 seconds in educational institutions. Financial services (66 seconds) and digital marketplaces (68 seconds) also sit well below the overall benchmark, while fintech records a median completion time of 228 seconds. SaaS and agency/consulting companies closely mirror the overall median at 113 and 110 seconds, respectively.
- B2C surveys take longer to respond to than B2B surveys.
B2B surveys record a median completion time of 99 seconds across 3,888 surveys, while B2C surveys reach 123 seconds across 3,789 surveys. This creates a 24-second gap between the two business models, making B2C surveys the slower of the two groups in this dataset.
The “typical” survey takes 1.8 minutes to respond to, but length changes the picture
Across 7,677 surveys, the median completion time is 108 seconds (1 minute 48 seconds).
However, estimating survey completion time can be quite tricky. The overall figure reflects a mix of factors in the dataset we analyzed.
Nearly 75% of all surveys contain 10 questions or fewer, and 92% contain 20 questions or fewer. In other words, shorter surveys account for the vast majority of responses and have the biggest influence on the overall median.
While 108 seconds gives you a useful reference point, it combines surveys of very different lengths into a single benchmark. If you want to understand what completion time looks like for your own survey, it's more useful to compare it against surveys with a similar number of questions.
Micro surveys have the shortest median completion time
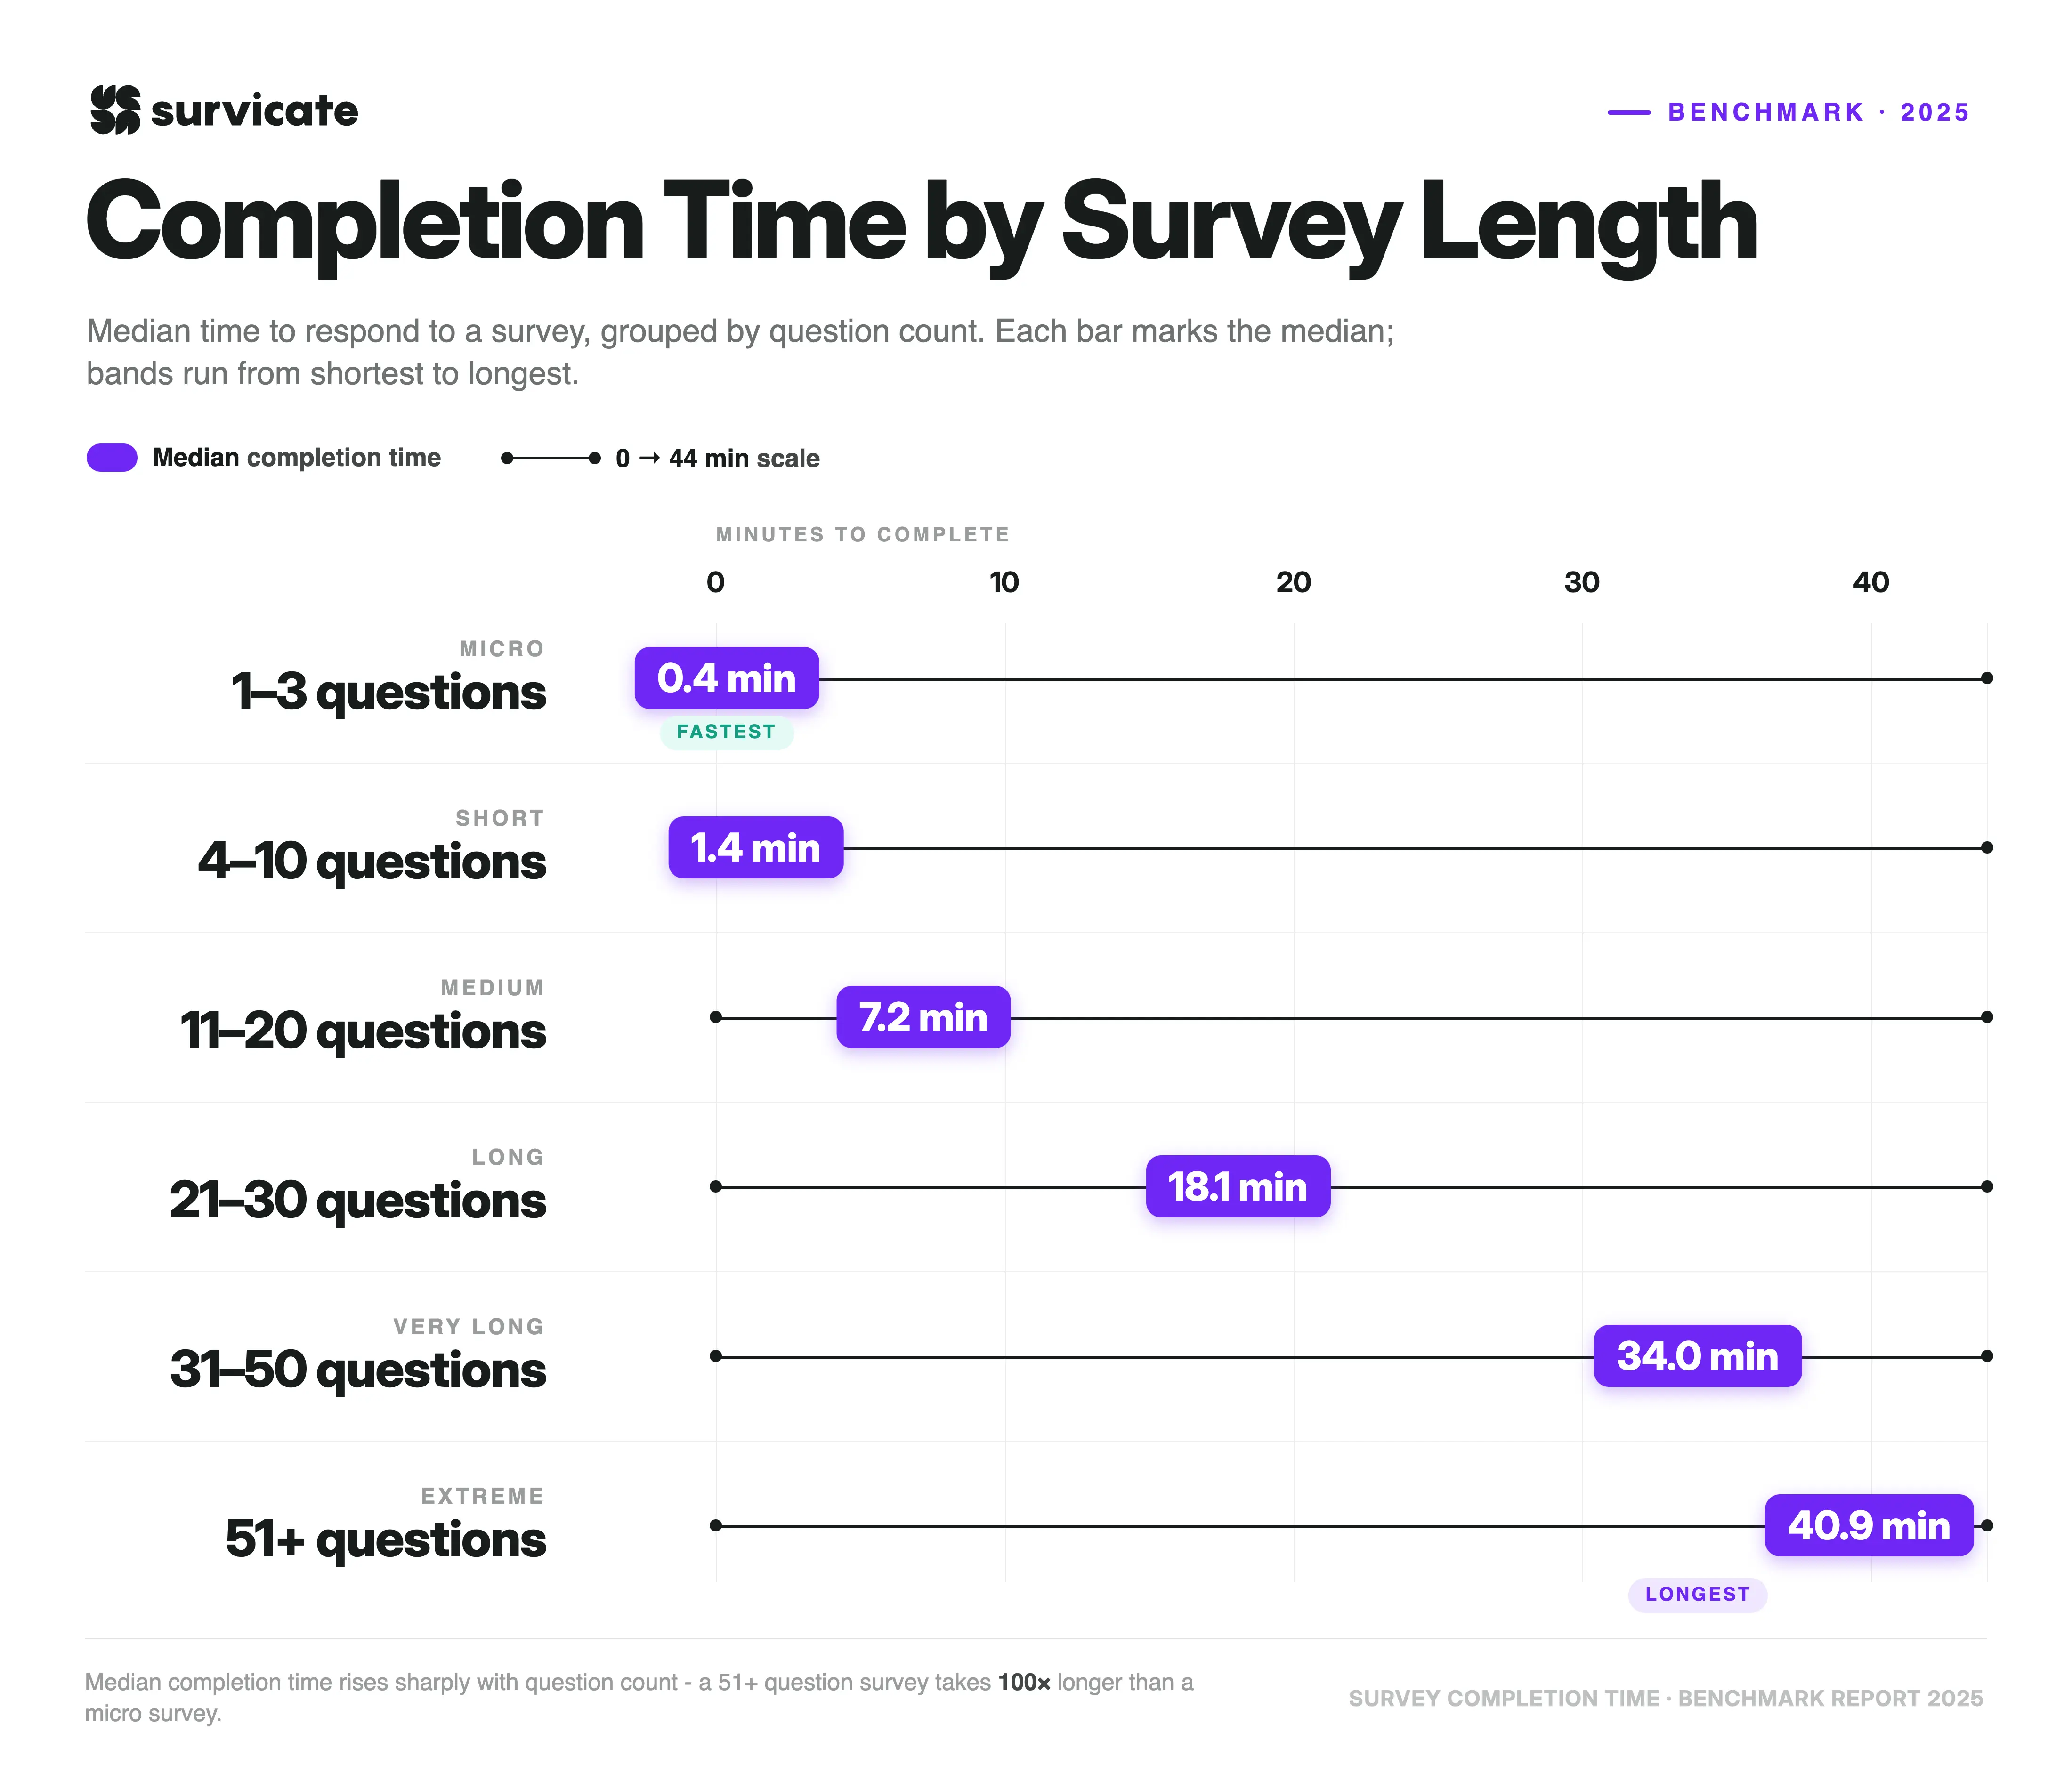
It probably comes as no surprise, but the number of questions included is the single biggest factor dictating how long respondents stick around. Survey completion time scales sharply with question count, speeding by in just 24 seconds for micro surveys (1-3 questions), but climbing to just under 41 minutes for extreme surveys with 51+ questions.
A quick note on the variance: While the medians give a great baseline, it is worth looking closely at the wide interquartile ranges (the gap between P25 and P75), especially in the longer buckets. This significant spread signals high variance within each category. For example, looking at the "Long" bucket, the fastest 25% of respondents breezed through the questions in under 6 minutes (325 seconds or less). On the flip side, the slowest 25% of respondents took over an hour and a half (5,562 seconds or more) to respond. Not everyone approaches a long form with the same level of speed or focus.
How long should a 30 question survey take?
Based on the data, a survey hitting the upper limit of the "Long" category (21–30 questions) has a median completion time of 1,088 seconds - meaning respondents typically spend around 18 minutes responding to it.
Completion time doesn't grow in a straight line as you add questions
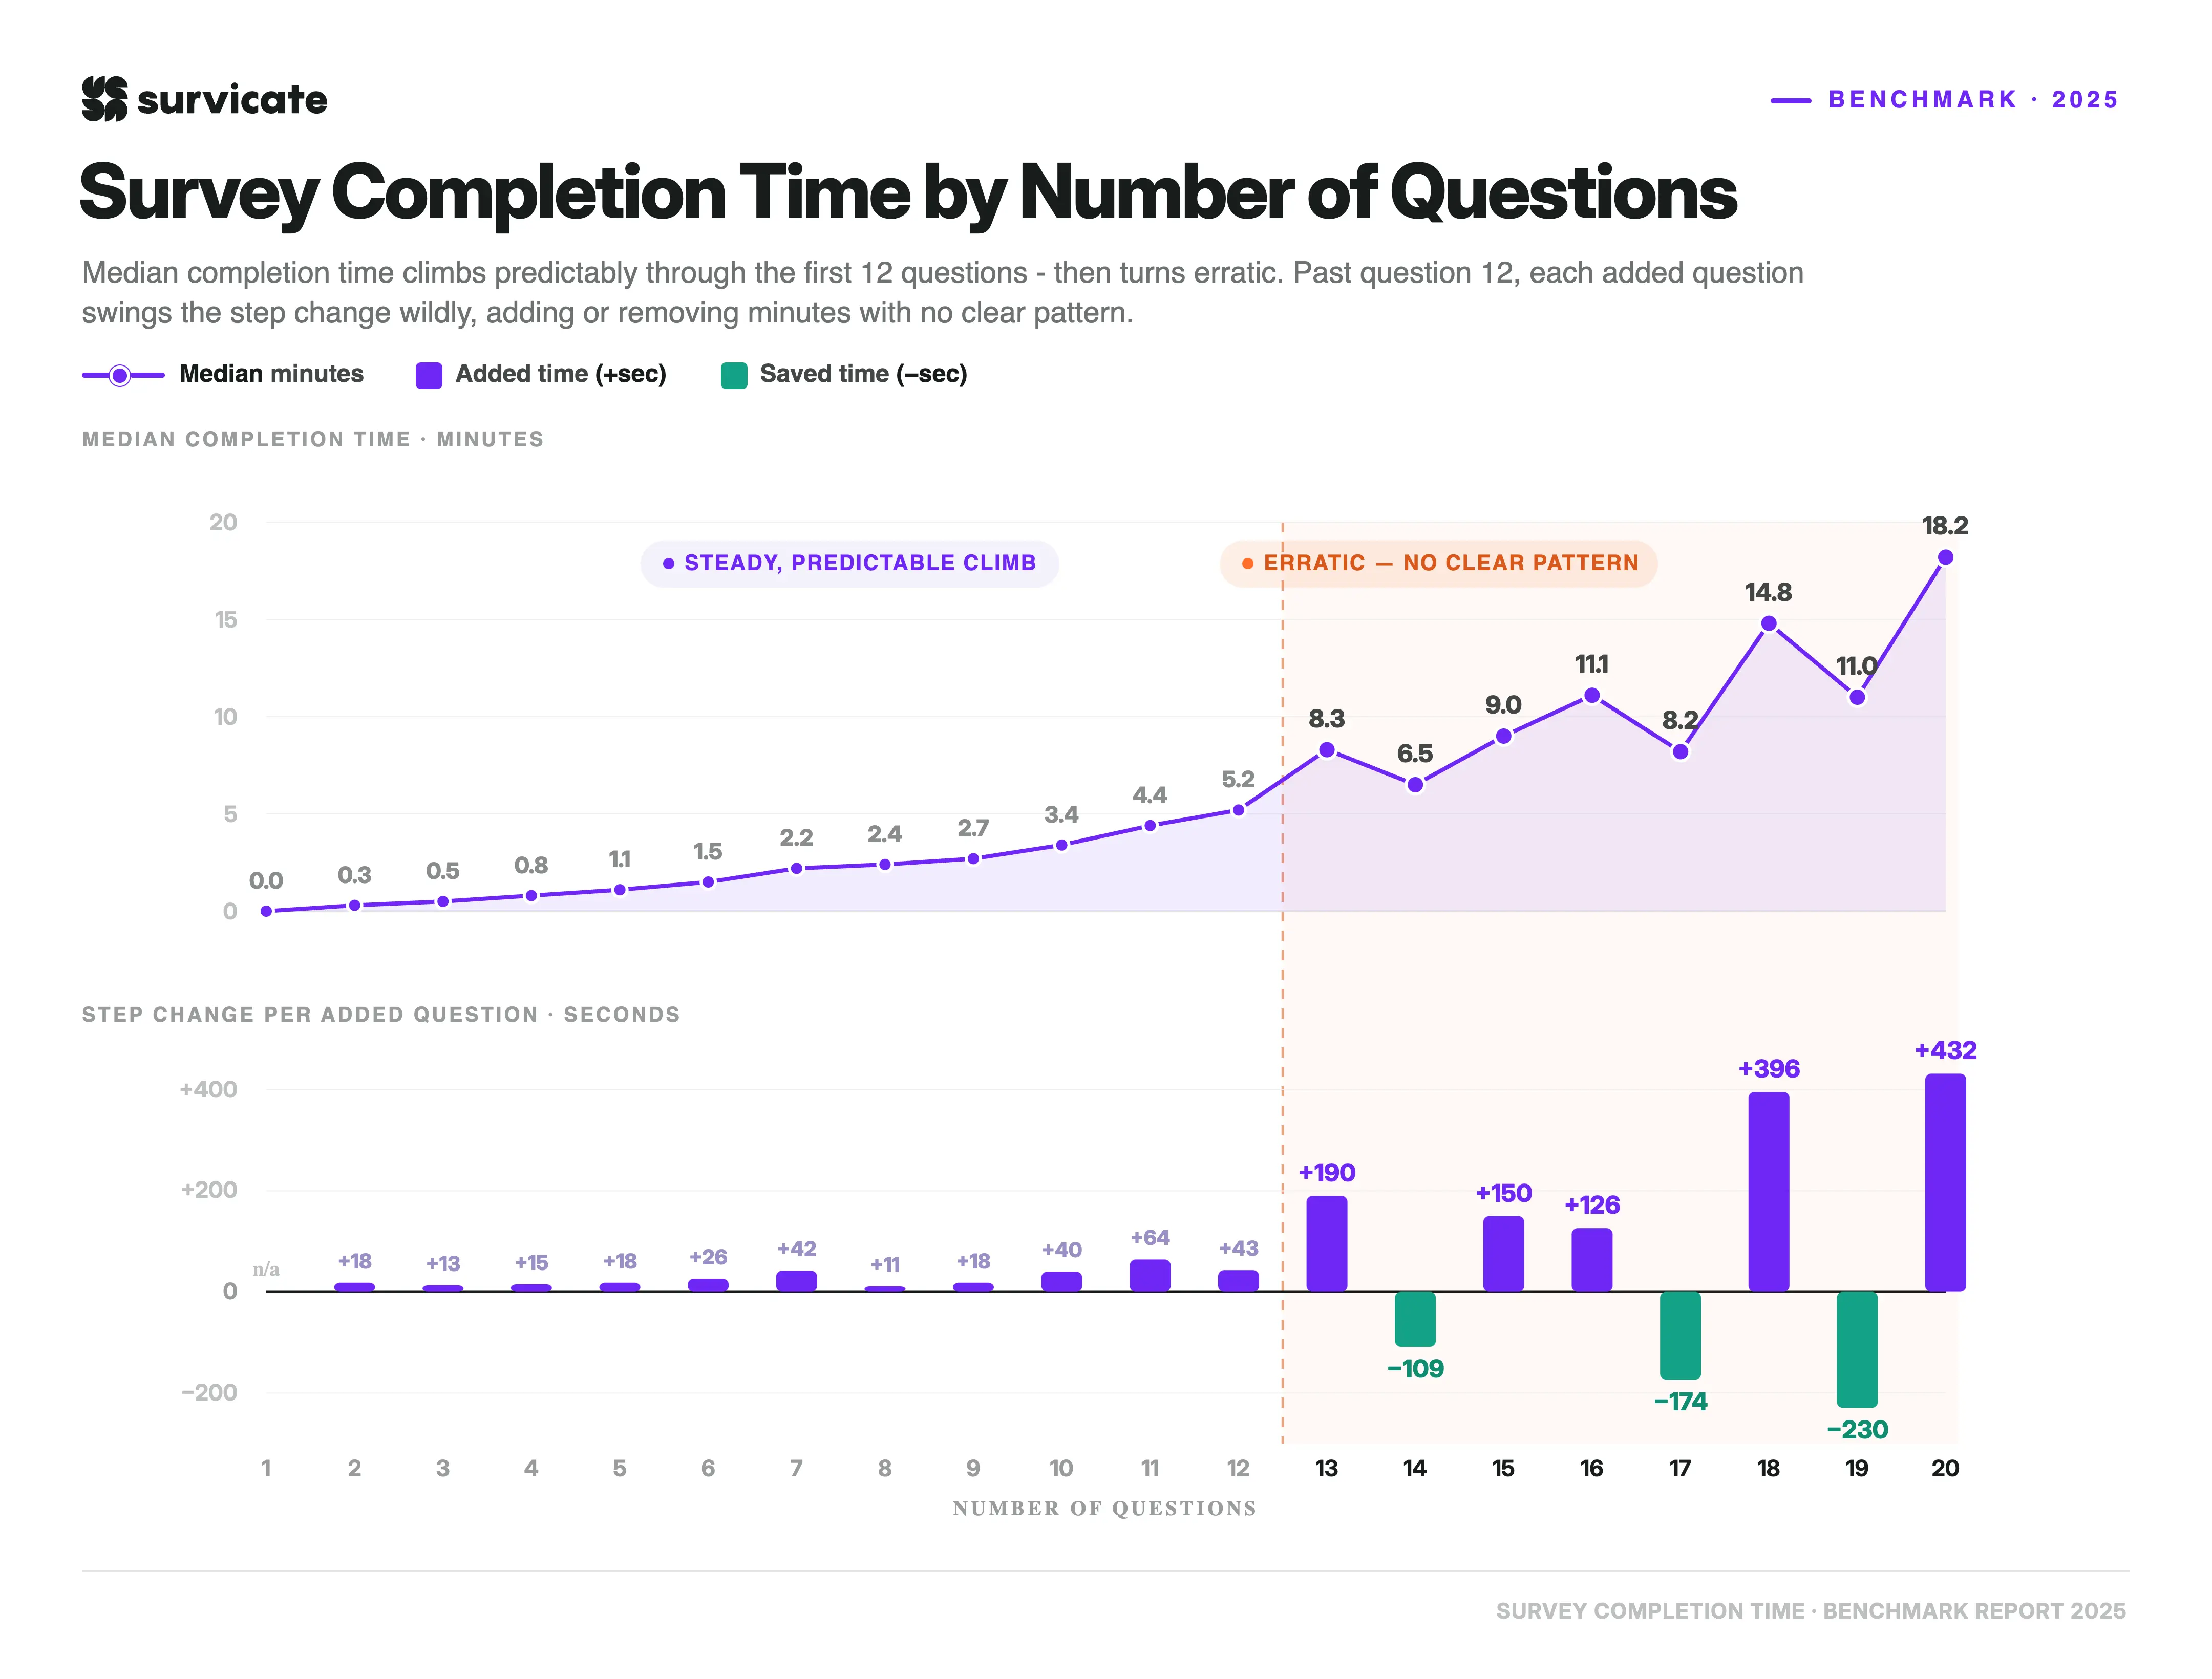
Since surveys with 20 questions or fewer account for roughly 92% of the dataset, this is where we can see the clearest patterns in how completion time changes as surveys get longer.
Looking at surveys one question at a time reveals three distinct phases. Completion time generally increases as questions are added, but the pace of that increase changes noticeably across different survey lengths.
Phase 1: The first additional question has an outsized impact
The largest proportional increase in completion time appears immediately when moving from one question to two. Median completion time jumps from just 1 second to 19 seconds.
At first glance, that result may look unusual, but we want to confirm that it's the actual median observed in our data. This finding stands out because no other step change between 1 and 12 questions is as large relative to its starting point.
What can possibly be the reason?
The data suggests that respondents interact with one-question surveys differently than longer surveys. Whether that's because some question formats can be answered almost instantly, or because respondents quickly dismiss the survey, falls outside the scope of this dataset.
Phase 2: A steady climb with growing variation (2-12 questions)
From 2 to 12 questions, completion time follows a generally upward path. Median completion time increases from 19 seconds at two questions to 309 seconds at twelve questions.
The size of each additional step varies. The increase ranges from 11 seconds (7→8 questions) to 64 seconds (10→11 questions). Early in this range, most step changes remain relatively close together. From around question 7 onward, however, we can see that the variation becomes more noticeable.
The pace of growth becomes less predictable as surveys get longer.
Phase 3: High volatility beyond 12 questions
After question 12, completion time continues to trend upward overall, but the relationship between survey length and completion time becomes much less consistent.
The largest single increase appears between 12 and 13 questions, where median completion time rises from 309 seconds to 499 seconds. This is followed by a decline of 109 seconds between 13 and 14 questions.
Similar swings continue throughout the remainder of the range, including a 174-second drop between 16 and 17 questions and a 396-second increase between 17 and 18 questions.
By the time surveys reach 20 questions, median completion time stands at 1,090 seconds (18.2 minutes). However, the path from 13 to 20 questions is far from linear, with large movements in both directions.
One important difference we see in this range is sample size. Surveys with 13-20 questions account for between 53 and 176 surveys per question count, compared with several hundred observations for many shorter survey lengths.
Completion rates follow a different pattern
Completion rates show a clearer directional trend in the first half of the distribution than in the second.
From 2 to 12 questions, completion rates generally decline as completion times increase. The median completion rate falls from 91.6% at two questions to 71.1% at twelve questions, although some individual question counts sit above or below the broader trend.
After question 12, that relationship becomes less consistent. Completion rates fluctuate between 78.7% and 85.1% across the 13-20 question range, without a clear upward or downward pattern. While completion time continues to vary substantially in longer surveys, completion rates remain comparatively stable within this part of the dataset.
Page surveys take up to 5x longer to respond to than widget and mobile
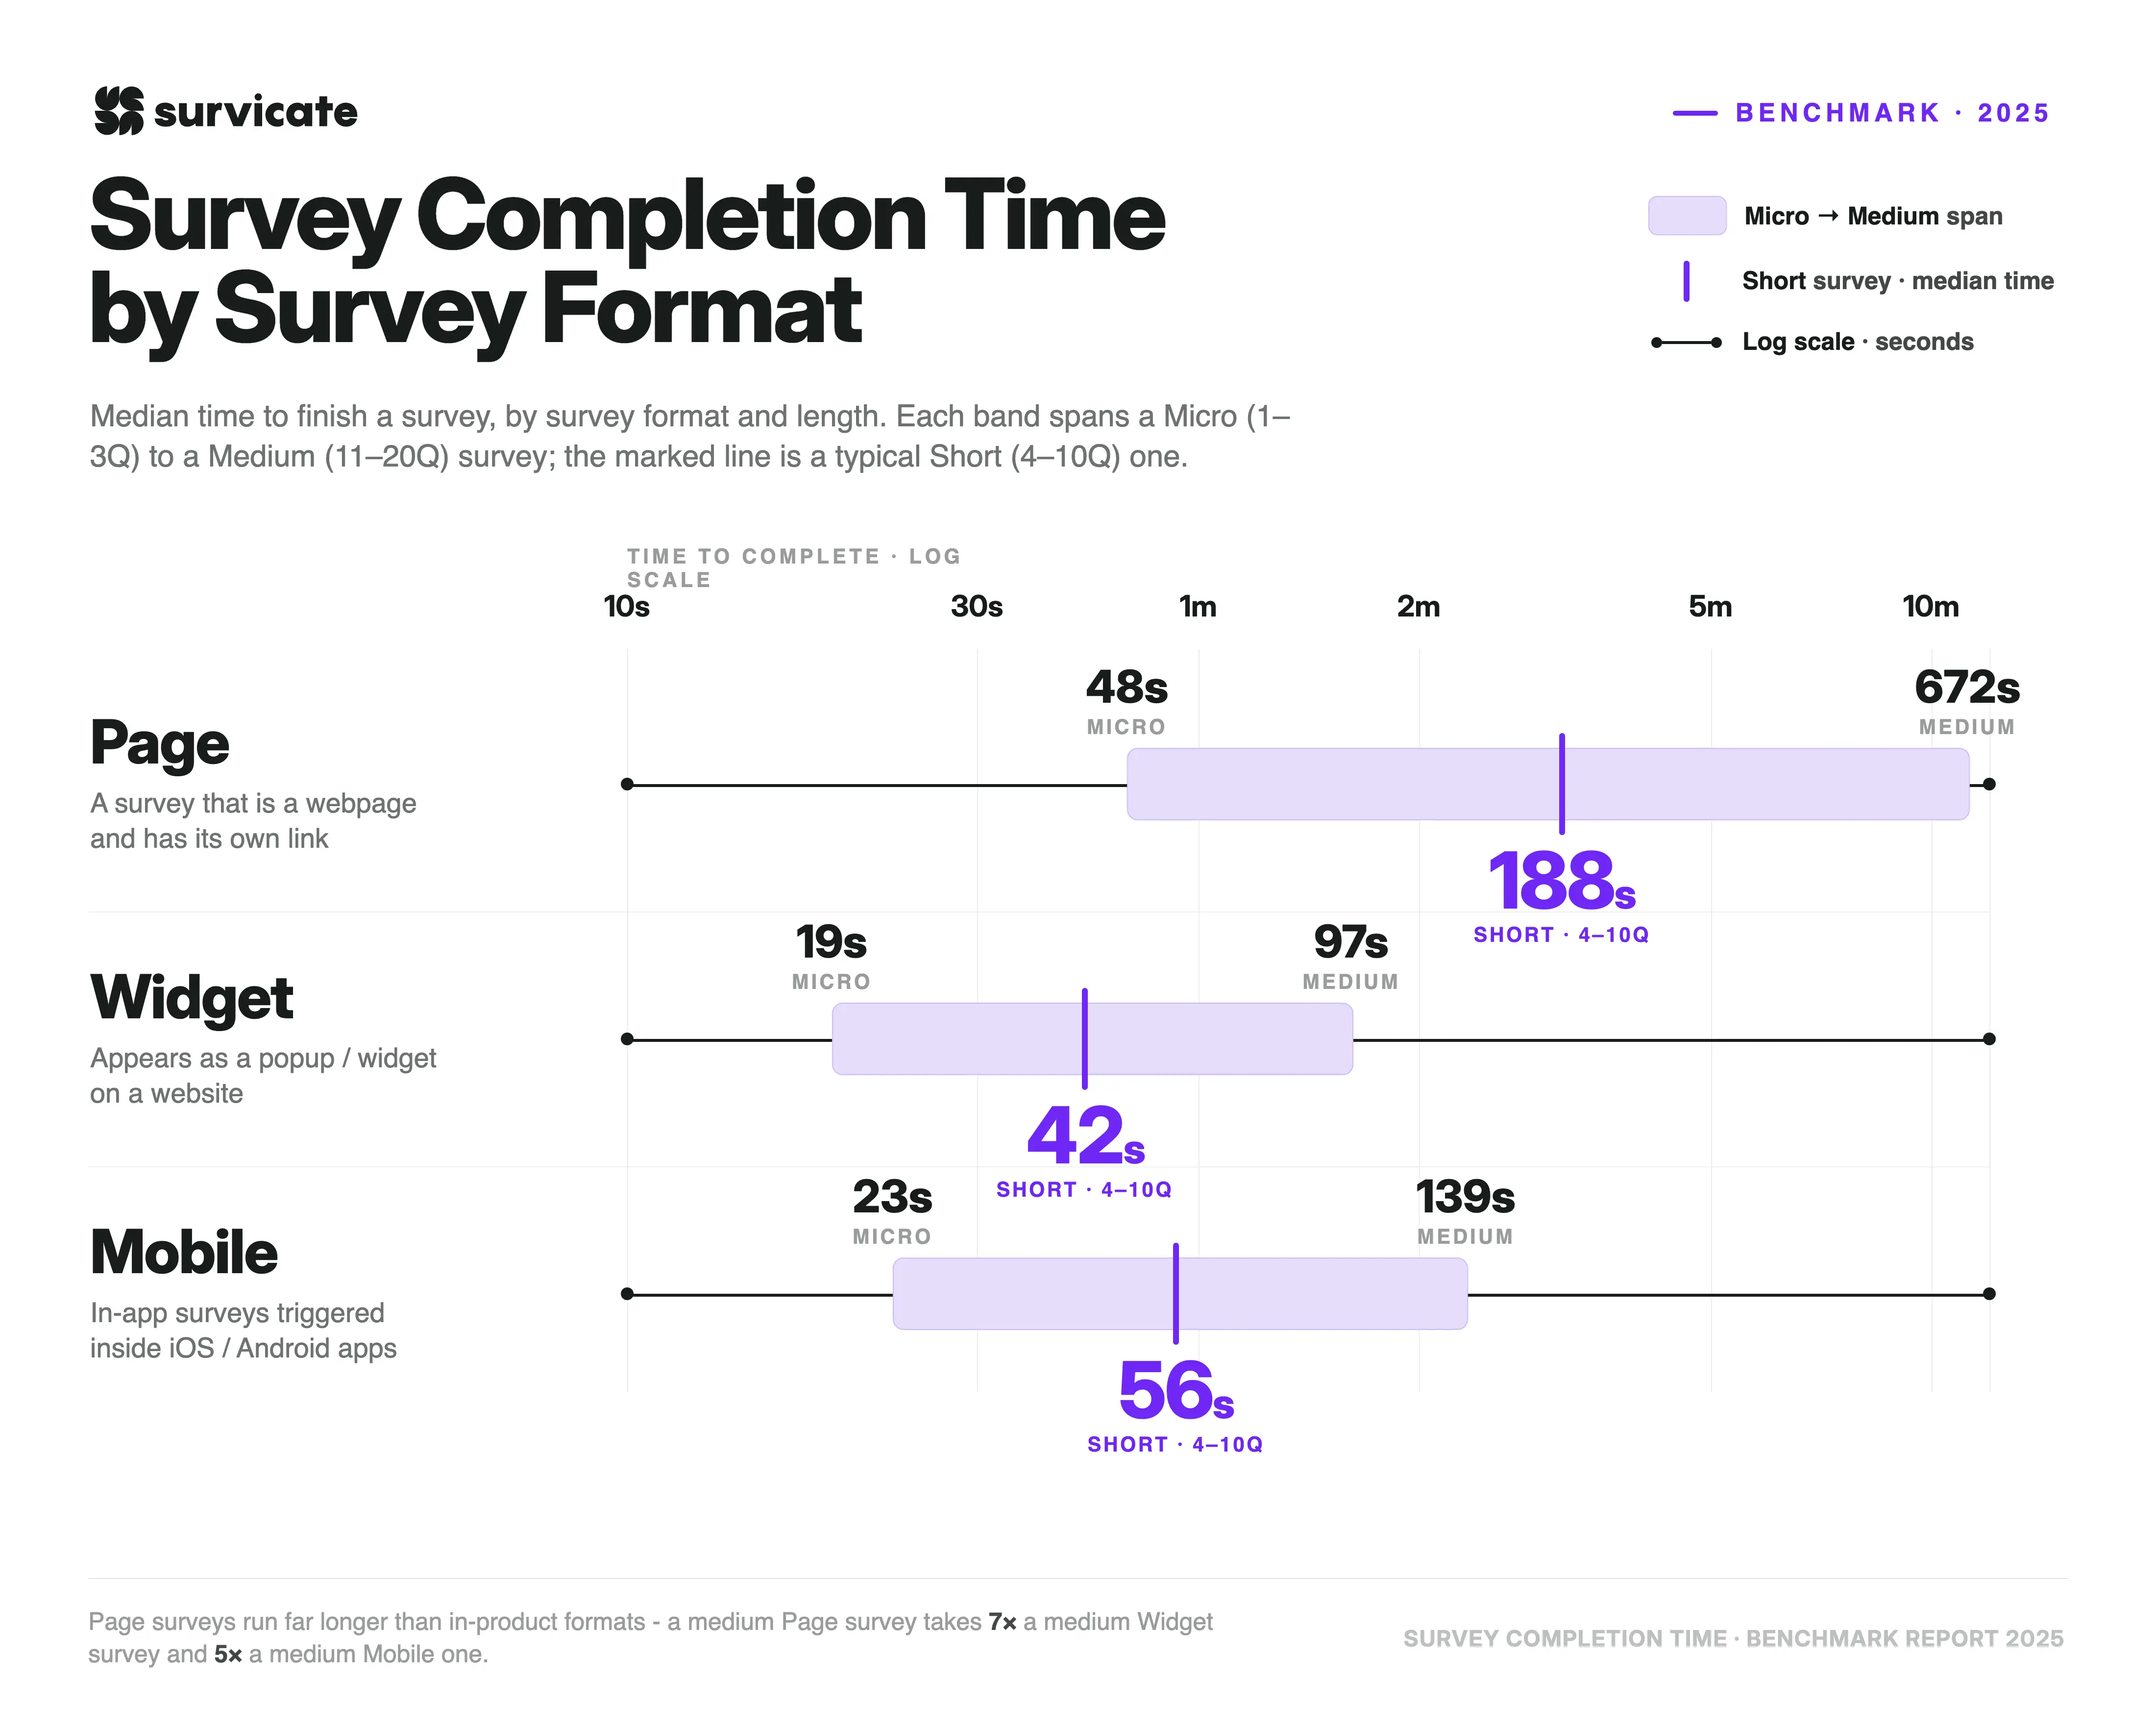
Where a survey lives makes a difference in how quickly people respond to it. The data shows that standalone page surveys take significantly longer to respond to than widget or mobile surveys across every single length bucket. On the flip side, widgets and mobile apps keep things moving at a fast, broadly similar pace.
The friction gap widens with length
The time penalty for using page surveys gets dramatically worse as the question count grows. At the micro level, page surveys take roughly double the time of widgets or mobile surveys. By the time a survey reaches medium length, that gap widens substantially to nearly 5x.
While a medium widget survey takes just over a minute and a half (97 seconds) of focused interaction, a medium page survey stretches out to over 11 minutes (672 seconds).
Pacing and variability
The interquartile ranges show that link-based page surveys also introduce much higher variability in how respondents pace themselves. For example, looking at short surveys (4-10 questions), the P75 for widget surveys is a tight 99 seconds – meaning 75% of users finish in just over a minute and a half.
For short page surveys, the P75 balloons to 1,510 seconds. This shows that a quarter of the respondents on page surveys are taking 25 minutes or longer, possibly because page surveys are frequently opened in a separate tab and left running in the background while people multi-task.
Question type affects completion rates more than you might think
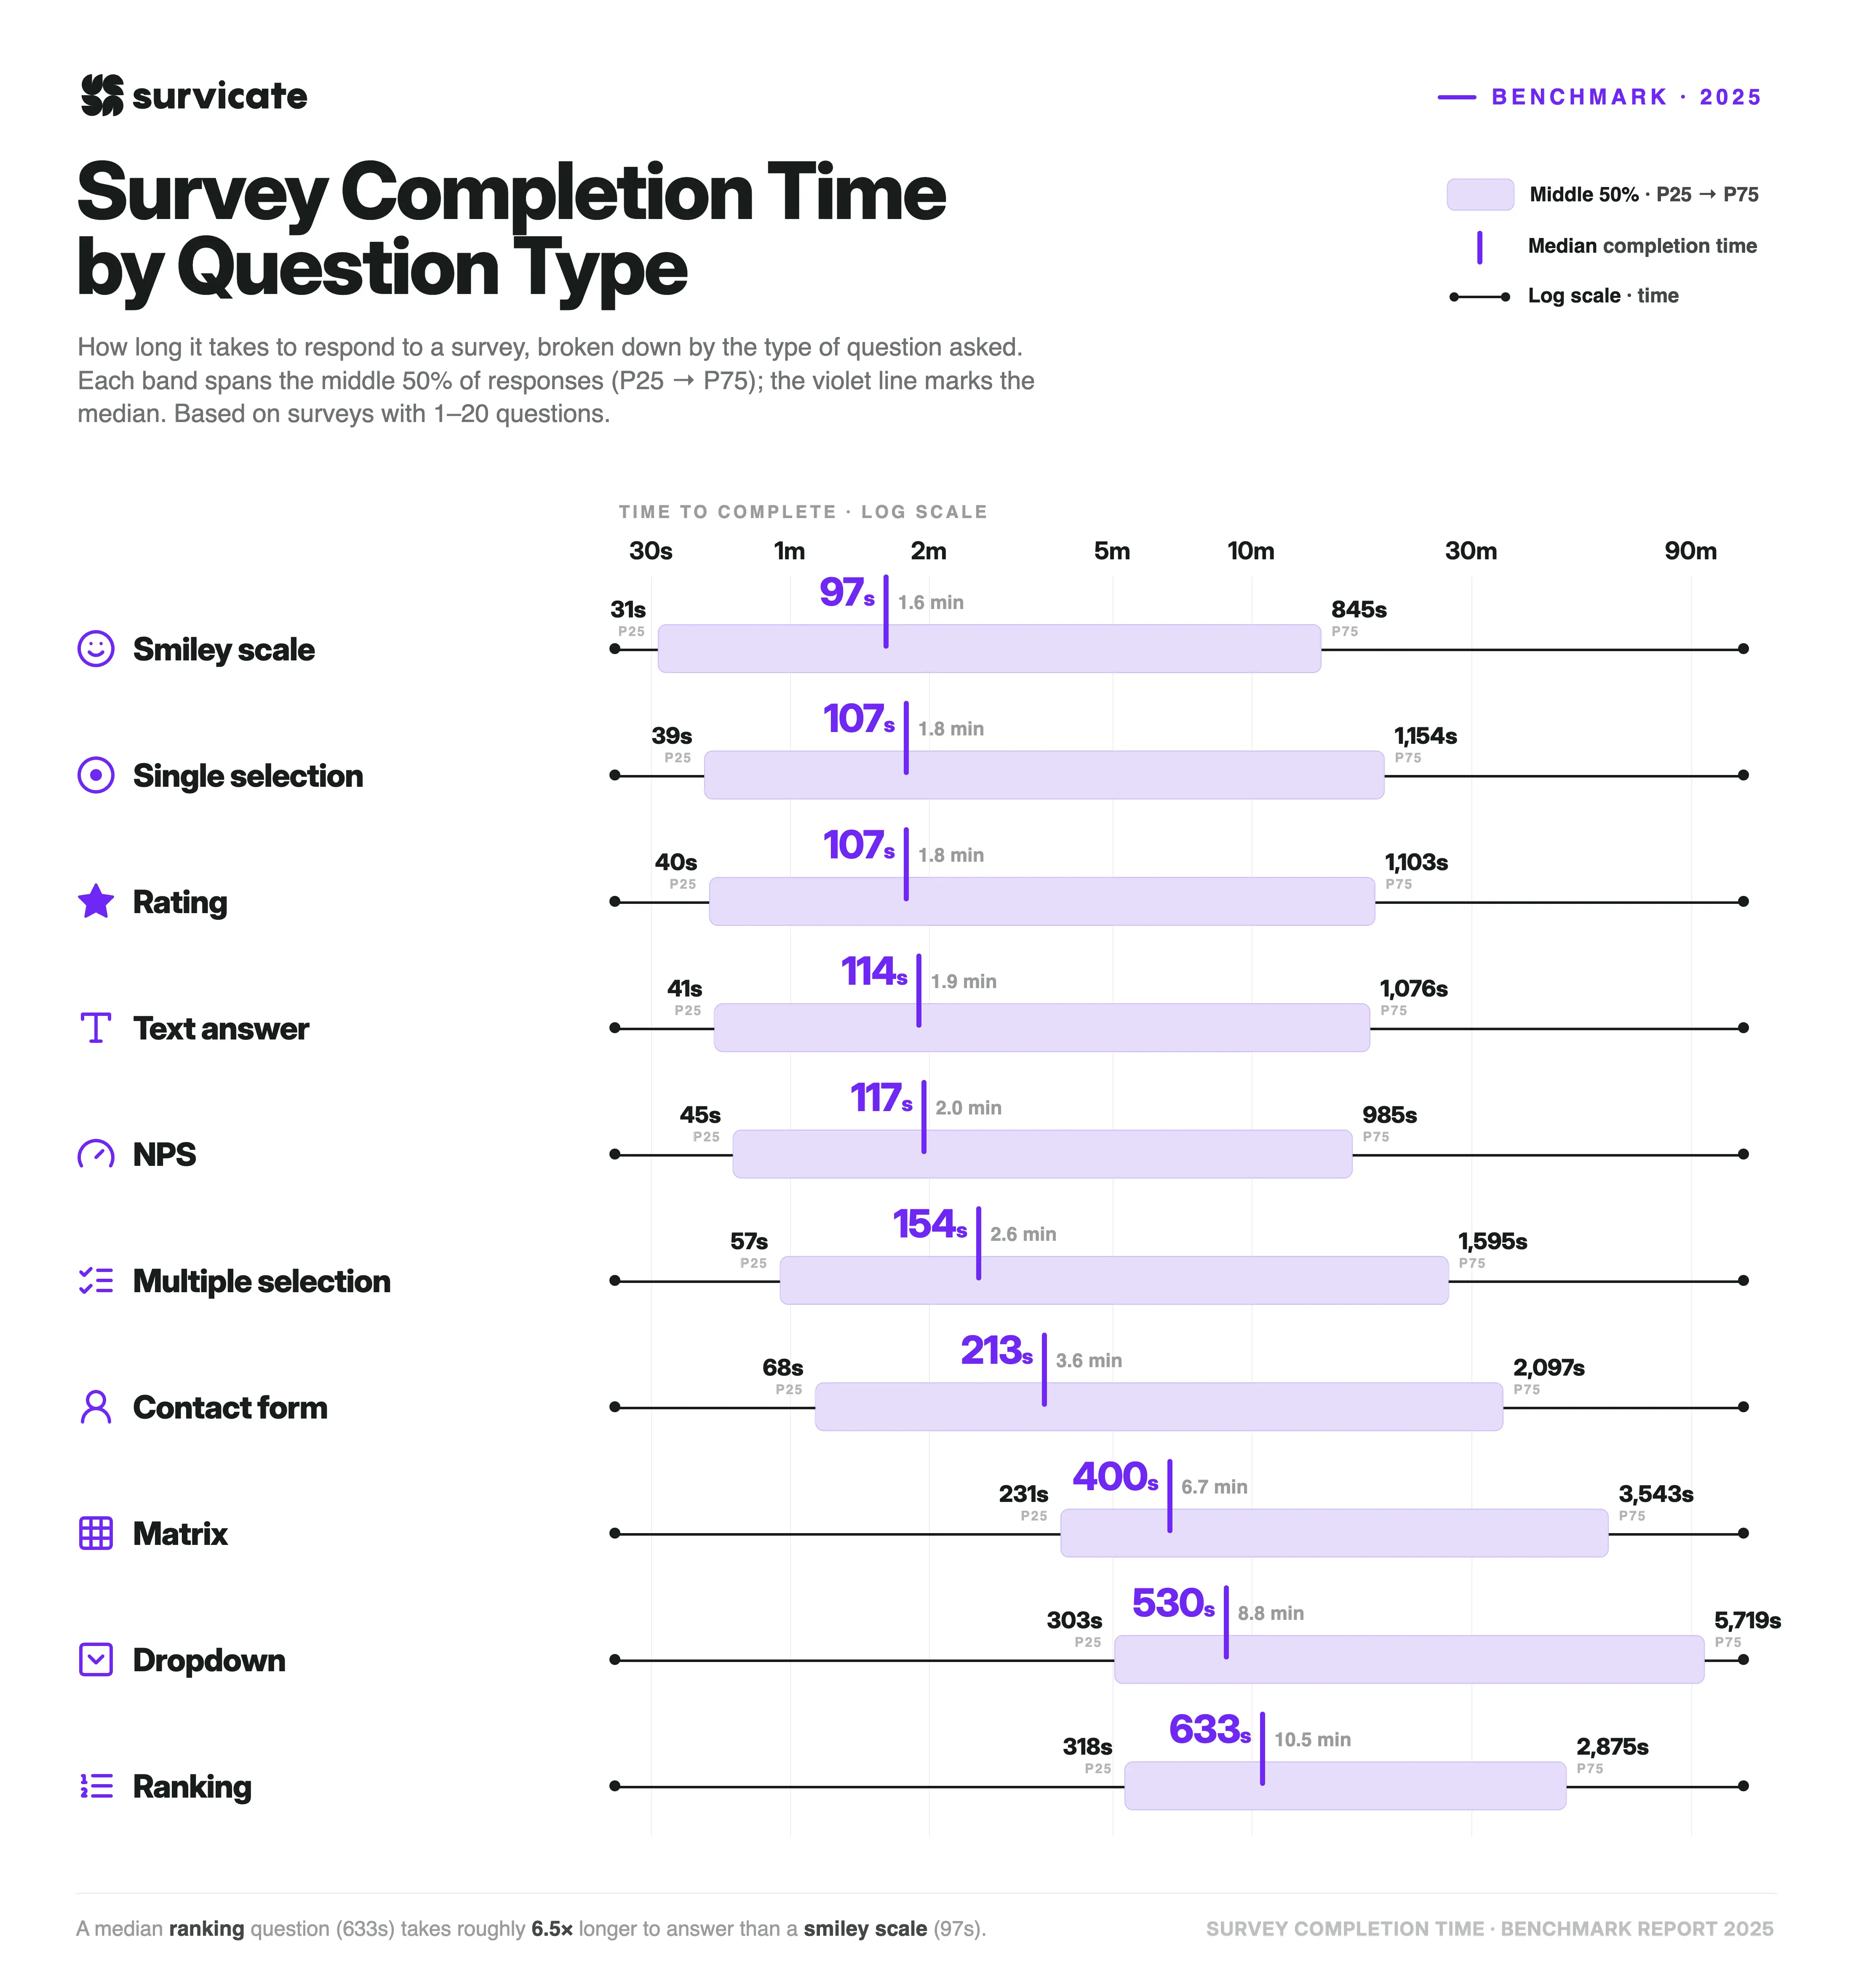
Survey length is one factor that shapes completion time, but question type also plays a measurable role. When we compare surveys containing 1-20 questions, we see substantial differences in completion time depending on the types of questions respondents come across.
The fastest question types cluster around the two-minute mark, while the slowest extend well beyond ten minutes.
Low-friction question types cluster around two minutes
Smiley scale questions record the shortest median completion time in the dataset at 97 seconds. Single selection and rating questions follow closely behind, both with a median of 107 seconds.
Text answer questions may be one of the more surprising findings. Despite requiring respondents to type a response, they record a median completion time of 114 seconds, placing them between rating-style questions and even ahead of NPS (117 seconds).
More complex interactions are linked to longer completion times
As question formats become more interactive, median completion times increase noticeably.
Multiple selection questions record a median completion time of 154 seconds, while contact forms reach 213 seconds.
The largest jumps appear with matrix, dropdown, and ranking questions. Matrix questions record a median completion time of 400 seconds, dropdown questions 530 seconds, and ranking questions 633 seconds.
This means the median ranking survey takes nearly six times longer to respond to than the median smiley scale survey.
The distribution widens considerably for longer-running question types
The spread between the 25th and 75th percentiles also grows as completion times increase.
For example, smiley scale questions have a 25th percentile of 31 seconds and a 75th percentile of 845 seconds. Ranking questions range from 318 seconds at the 25th percentile to 2,875 seconds at the 75th percentile, while dropdown questions span from 303 seconds to 5,719 seconds.
This means that not only do the longest-running question types have higher median completion times, but they also show greater variation across surveys.
Every extra open-text question group adds at least 50% to completion time
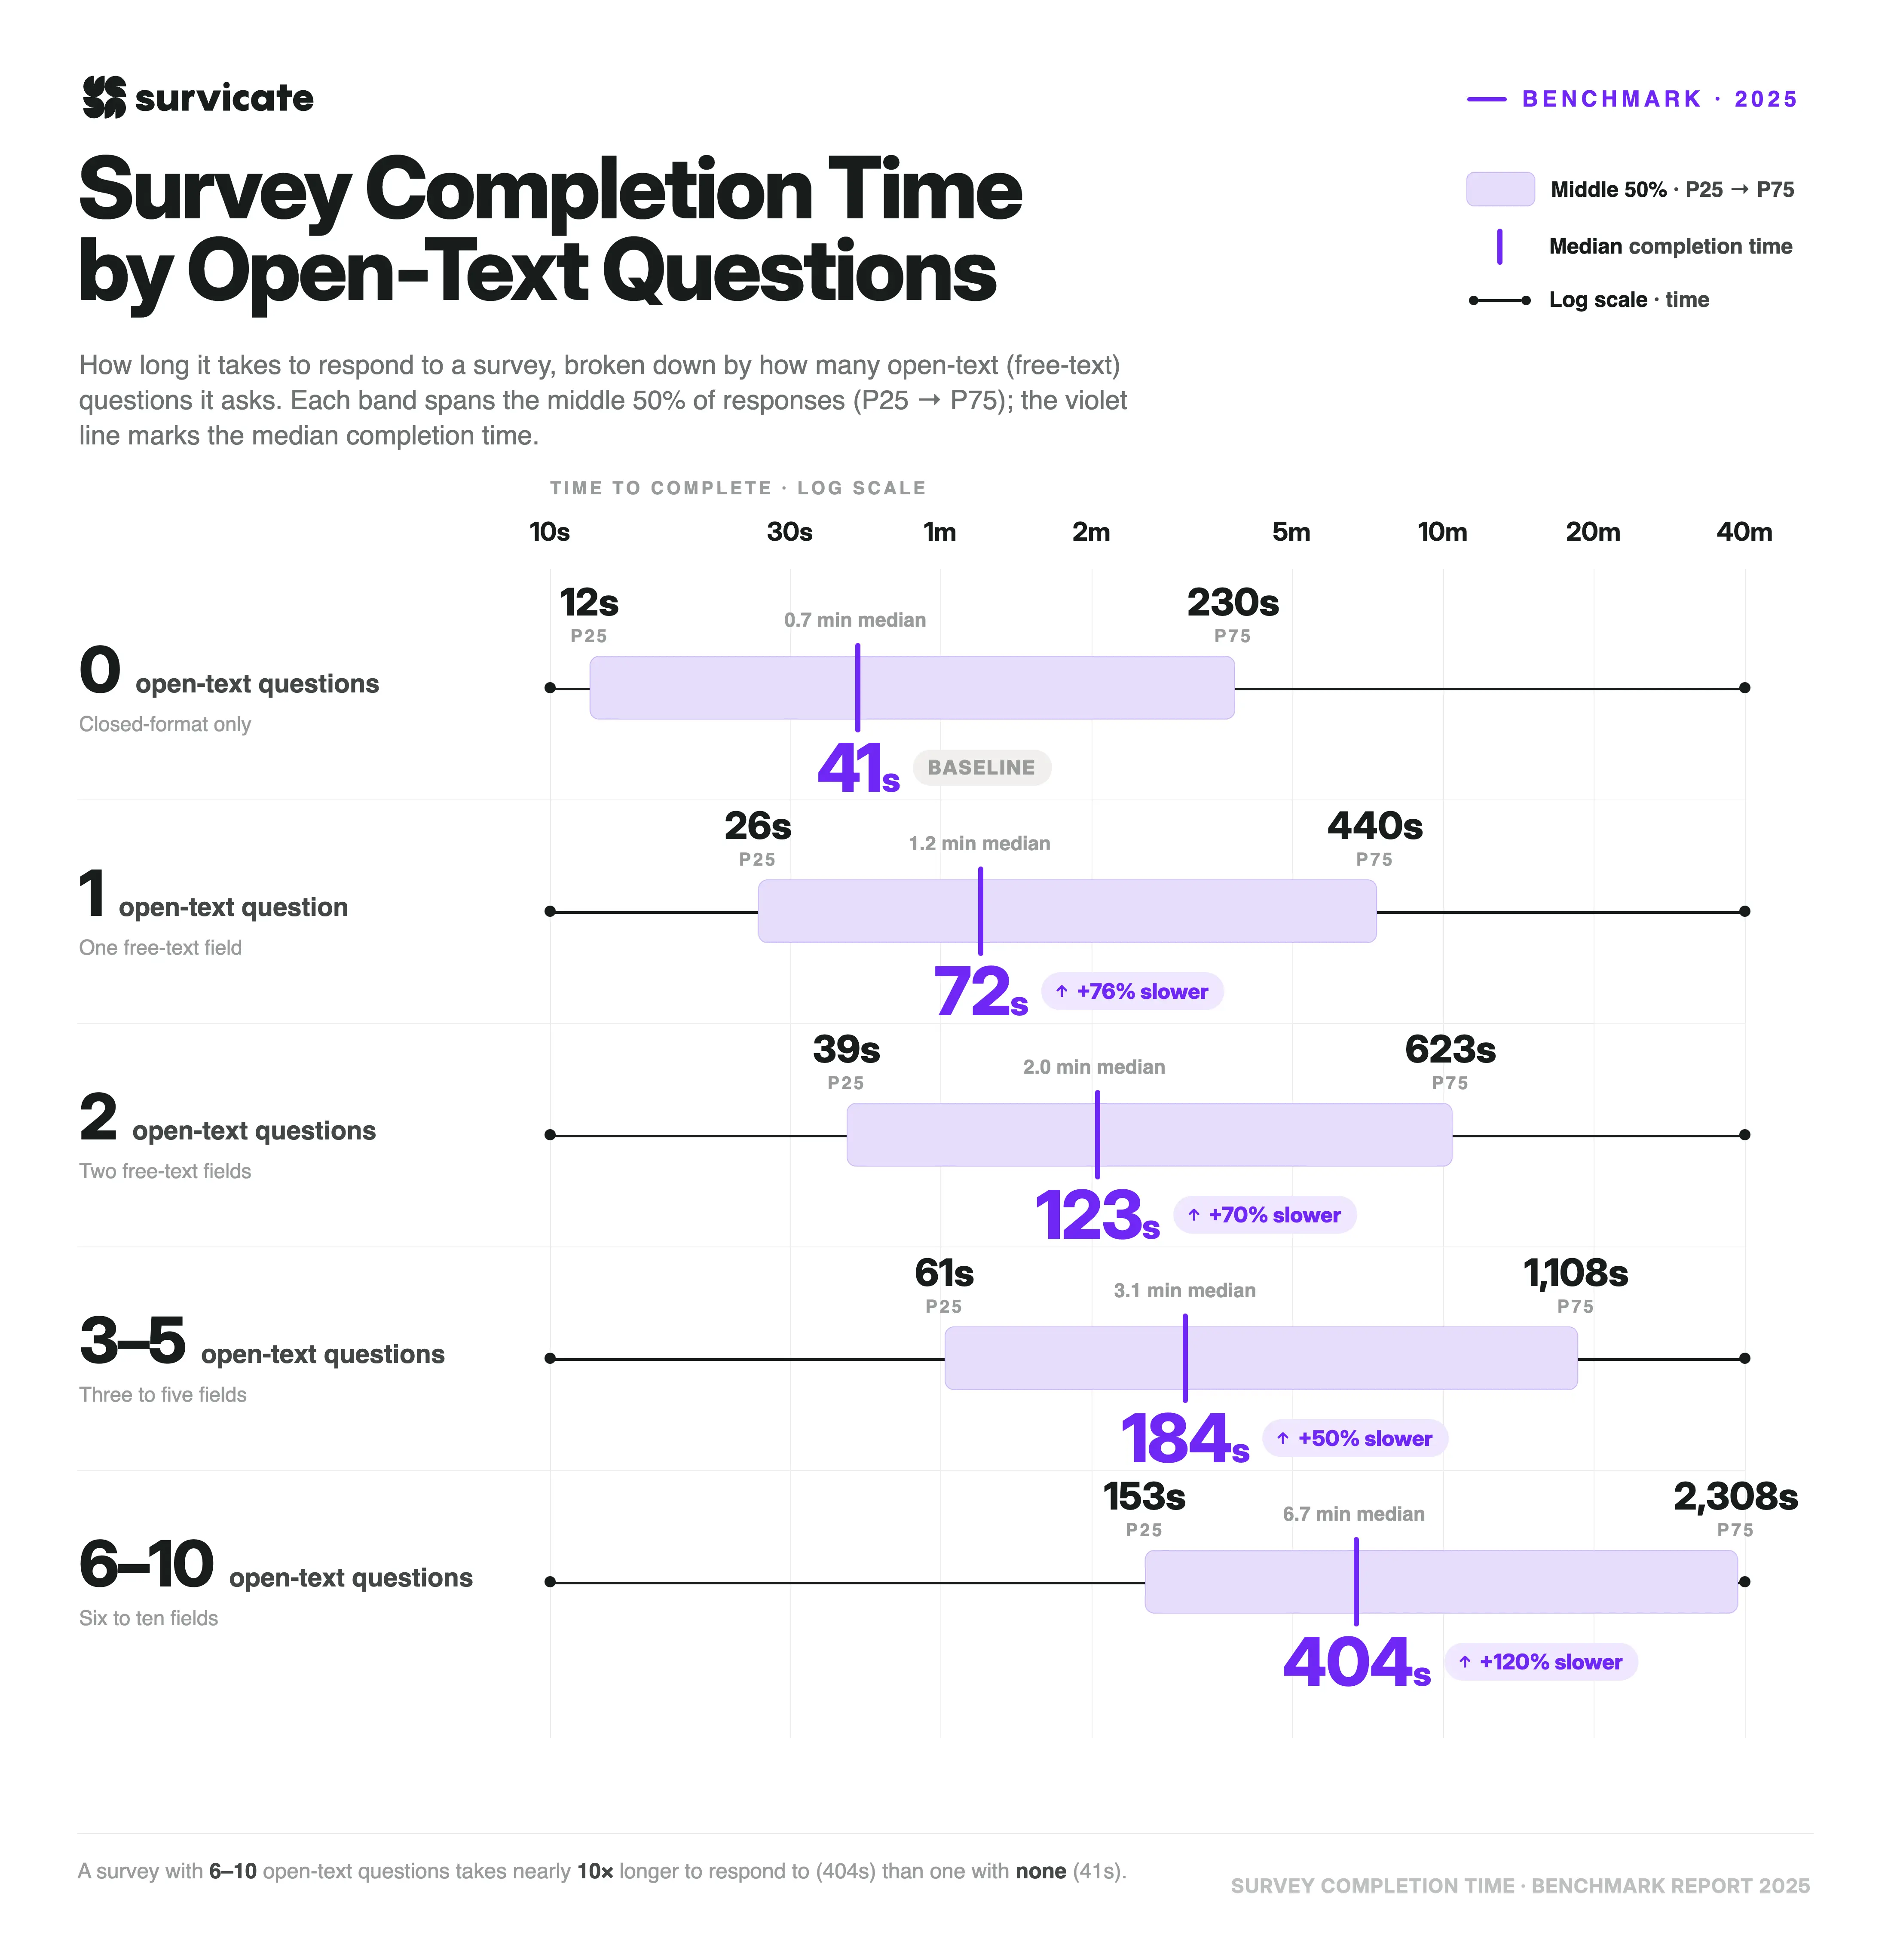
Forcing respondents to type out answers is a surefire way to slow things down. The data shows that each additional grouping of open-text questions adds at least 50% to the median completion time.
Surveys with 6-10 open-text questions show a median completion time of 404 seconds. That is more than double the time it takes to respond to surveys with 3-5 open-text questions (184 seconds), and nearly 10x the time of surveys that stick purely to multiple-choice or rating scales with zero open text (41 seconds).
The 6+ question tipping point
The jump from the 3-5 bucket to the 6-10 bucket represents a massive 120% spike in completion time, which is the largest proportional increase anywhere in the dataset.
This dramatic spike is also exactly where user behavior shifts, as seen in the sample sizes. The number of active surveys in the dataset drops significantly to just 196 surveys in the 6-10 open-text category. Most creators seem to intuitively avoid hitting users with that much heavy typing, keeping the large time commitment from becoming a widespread issue.
The jump from 3-5 to 6-10 open-text questions (+120%) is the largest proportional increase in the table, and also the point where sample size drops significantly (to 196 surveys).
Completion time varies widely across industries, with e-learning as the winner
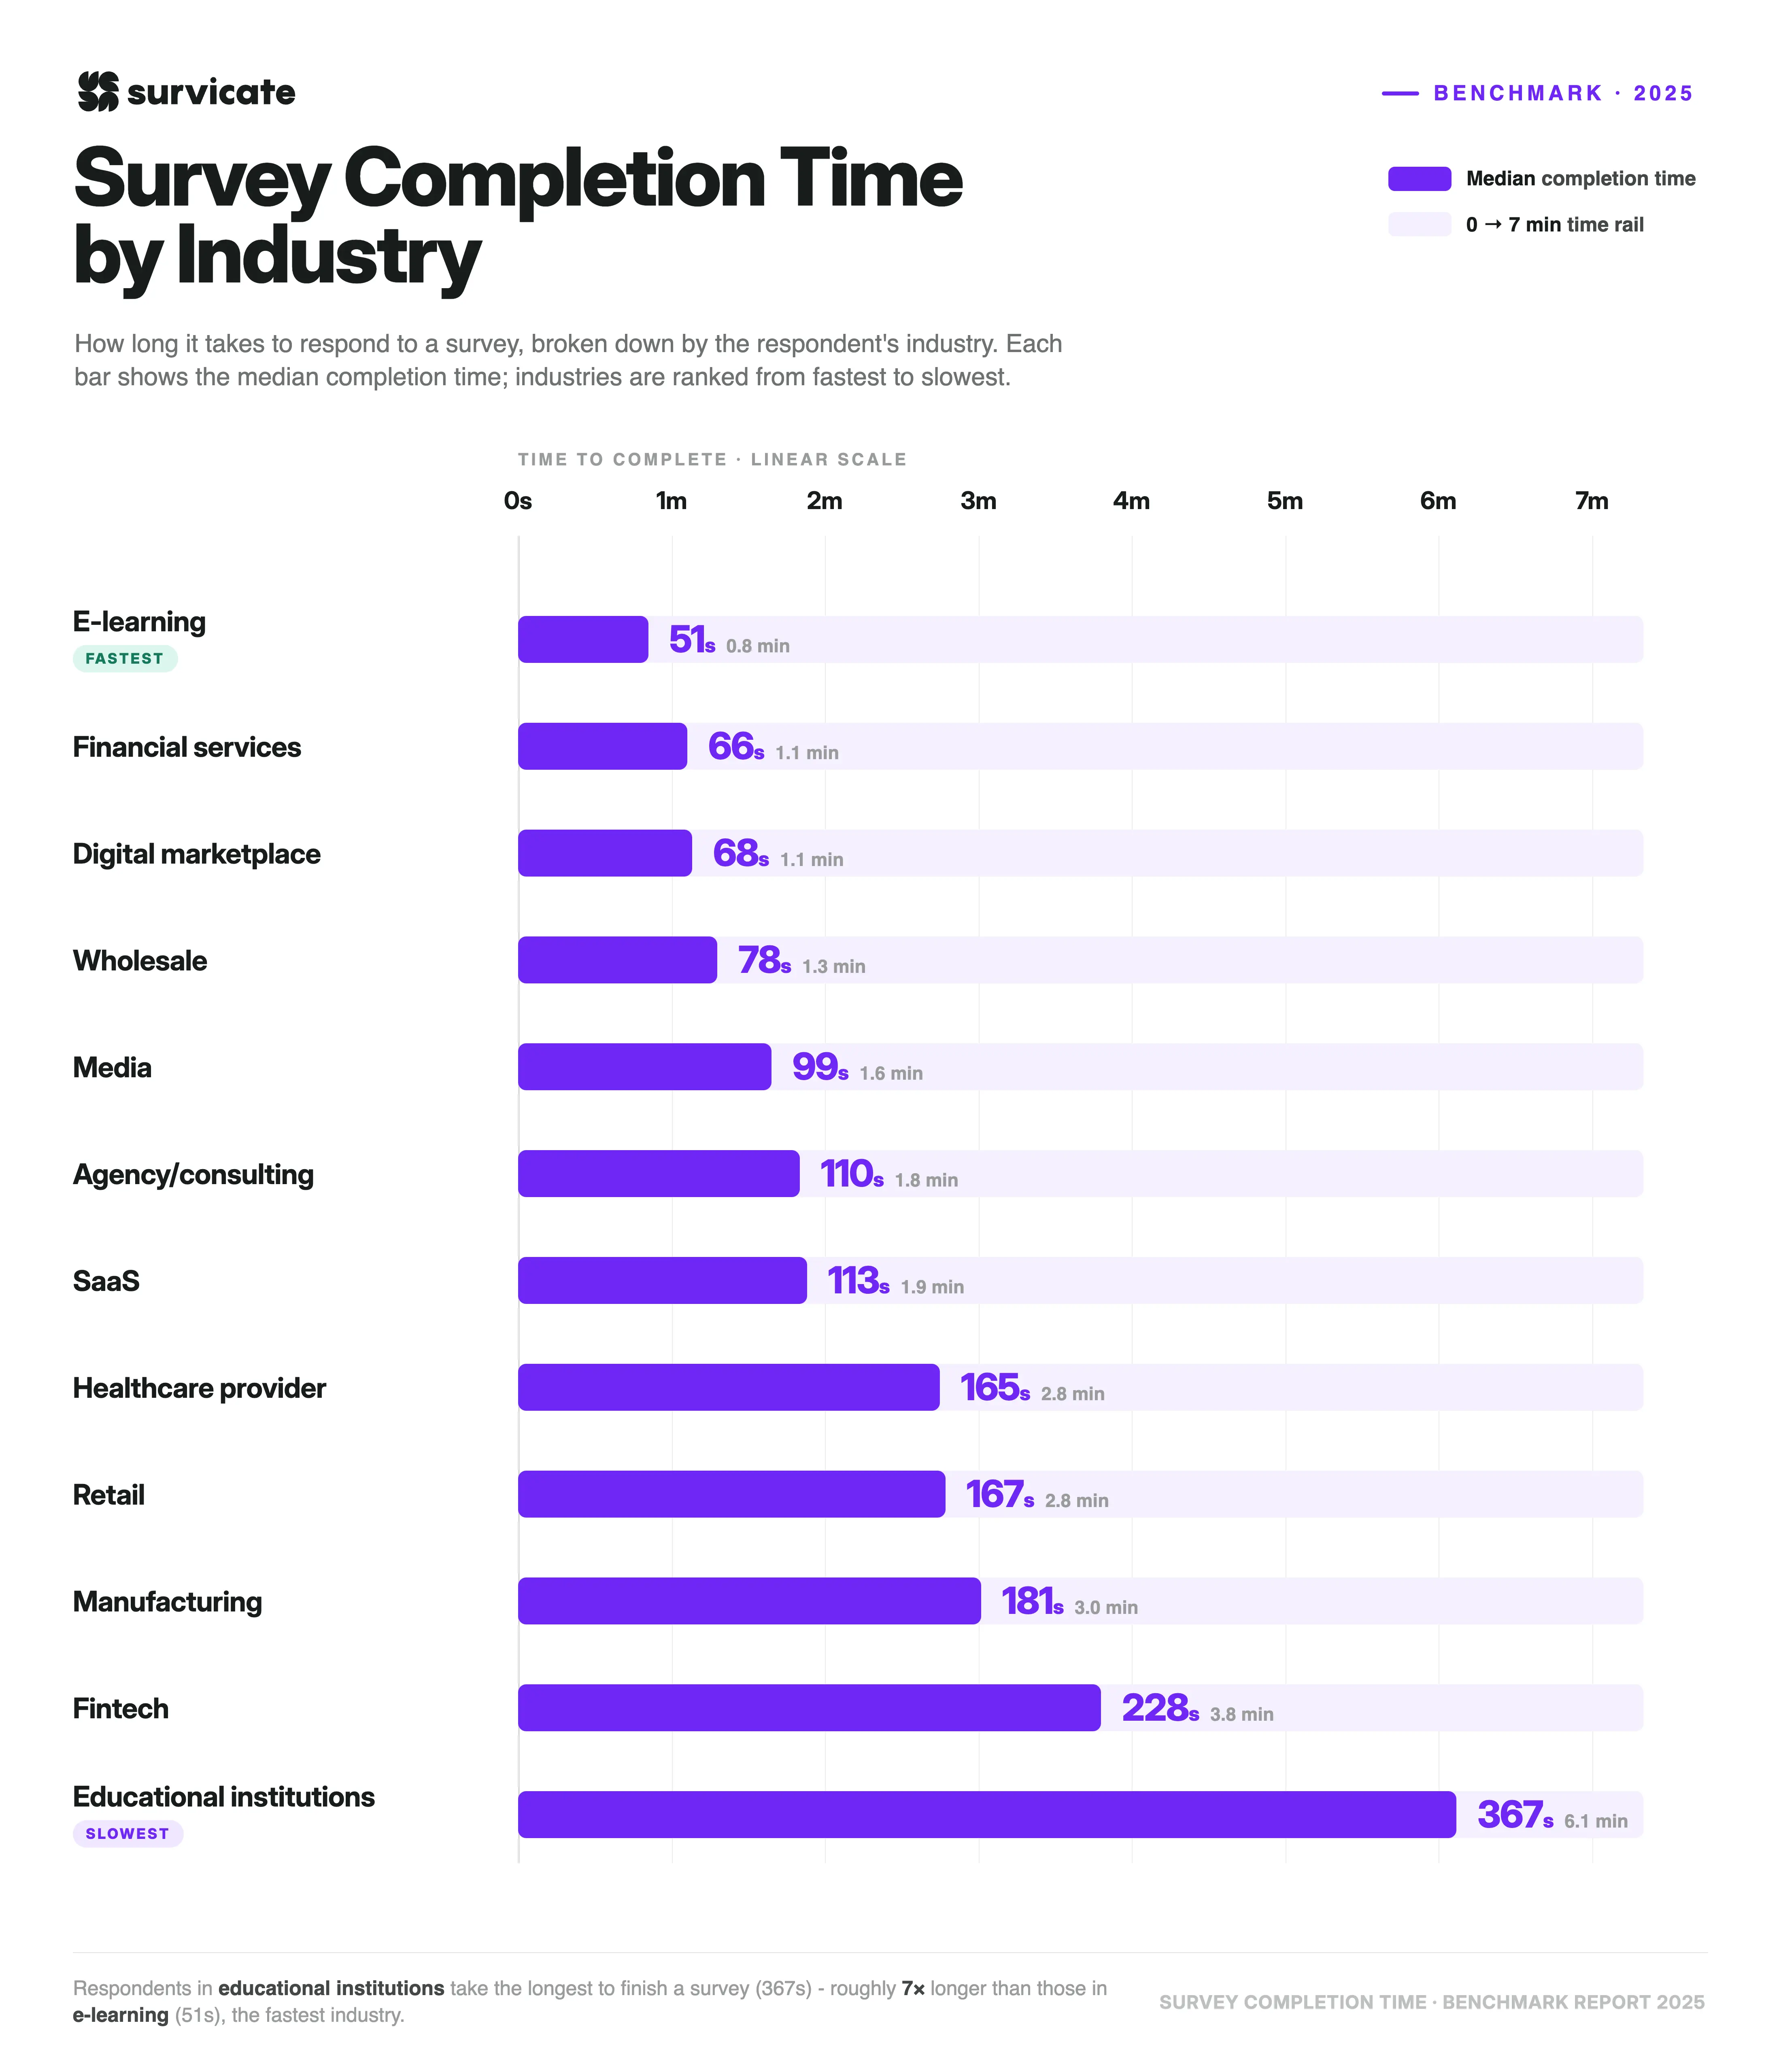
Industry is another factor that shows meaningful differences in survey completion time. Across the industries in our dataset, median completion times range from 51 seconds in e-learning to 367 seconds in educational institutions – a spread of more than sevenfold.
E-learning records the shortest median completion time at 51 seconds, followed by financial services (66 seconds) and digital marketplaces (68 seconds). Media also sits below the overall benchmark, with a median of 99 seconds. All four categories fall below the overall median completion time of 108 seconds.
Meanwhile, some of the largest categories in the dataset cluster around the overall median. Agency and consulting surveys record a median completion time of 110 seconds, while SaaS surveys come in at 113 seconds.
Together, these categories account for more than 2,700 surveys and closely mirror the overall benchmark.
Healthcare providers (165 seconds), retail (167 seconds), and manufacturing (181 seconds) all sit above the overall median, forming a distinct middle group in the dataset.
Educational institutions and fintech take the longest to respond. They record the longest median completion time at 367 seconds, followed by fintech at 228 seconds.
One notable finding is the difference between financial services and fintech. While financial services surveys have a median completion time of 66 seconds, fintech surveys record 228 seconds, placing them in very different parts of the distribution.
Note: The industry categories we used here have been enriched and merged from self-reported customer data. We used the same criteria as in our NPS benchmark report.
B2C surveys take longer to respond to than B2B surveys

When we compare surveys by business model, we see a measurable difference in completion time between B2B and B2C companies.
B2B surveys record a median completion time of 99 seconds across 3,888 surveys. B2C surveys record a median of 123 seconds across 3,789 surveys.
A 24-second gap between B2B and B2C
The difference between the two groups is 24 seconds, with B2C surveys taking longer to respond to on average than B2B surveys.
The sample sizes are nearly identical, with both categories representing roughly half of the dataset. This makes B2B and B2C one of the most evenly balanced comparisons in the report.
Based on this dataset, the typical B2C survey takes just over two minutes to respond to, while the typical B2B survey comes in just under the 100-second mark.
Conclusion
Benchmarks help calibrate expectations, they don’t set rigid targets. Every audience behaves differently, so context is everything. To get a true sense of success, you should cross-reference multiple dimensions from this report – like industry type alongside survey length bucket, or specific language and cultural groups.
A medium-length page survey in one sector might take five times longer than a mobile widget in another, and that is perfectly normal. Use these insights to spot friction, understand respondent behavior, and refine the approach. Ultimately, the best survey completion time baseline is a steady, high completion rate for your own brand.